Metadata Report for BODC Series Reference Number 598252
Metadata Summary
Problem Reports
Data Access Policy
Narrative Documents
Project Information
Data Activity or Cruise Information
Fixed Station Information
BODC Quality Flags
SeaDataNet Quality Flags
Metadata Summary
Data Description |
|||||||||||||||||||||||||||||
|
|||||||||||||||||||||||||||||
Data Identifiers |
|||||||||||||||||||||||||||||
|
|||||||||||||||||||||||||||||
Time Co-ordinates(UT) |
|||||||||||||||||||||||||||||
|
|||||||||||||||||||||||||||||
Spatial Co-ordinates | |||||||||||||||||||||||||||||
|
|||||||||||||||||||||||||||||
Parameters |
|||||||||||||||||||||||||||||
|
|||||||||||||||||||||||||||||
|
|||||||||||||||||||||||||||||
Problem Reports
The chlorophyll concentration channel is very noisy.
The data values in the PAR channel are all null in this cast.
Data Access Policy
Open Data
These data have no specific confidentiality restrictions for users. However, users must acknowledge data sources as it is not ethical to publish data without proper attribution. Any publication or other output resulting from usage of the data should include an acknowledgment.
If the Information Provider does not provide a specific attribution statement, or if you are using Information from several Information Providers and multiple attributions are not practical in your product or application, you may consider using the following:
"Contains public sector information licensed under the Open Government Licence v1.0."
Narrative Documents
Falmouth Scientific Integrated CTD (ICTD) Profiler
The FSI ICTD is designed to collect high precision conductivity, temperature and pressure data with self calibrating electronics. This instrument can support five primary sensors (including up to three temperature sensors) and can be coupled with a water bottle sampler. The ICTD is equipped with a titanium housing rated to 7000 m and has a sampling rate of 32 Hz.
Three temperature sensors are available: primary platinum, redundant platinum and exposed thermistor. Any combination of these can be used in the primary channels. The instrument also has multiple RS-232 serial inputs for a variety of sensors including: ADCP, Benthos PSA-916 Altimeter and WetLabs SAFire. There are an additional eight DC input channels that can support virtually any sensor that has a DC output.
Specifications:
| Parameter | Conductivity | Temperature | Pressure |
| Sensor | Inductive cell | Platinum thermometer | Precision-machined Silicon |
| Range | 0 to 70 mS cm-1 | -2 to 35°C | Customer specified |
| Accuracy | ±0.002 mS cm-1 | 0.002°C | ±0.01 % full scale |
| Resolution | 0.0001 mS cm-1 | 0.00005°C | 0.0004 % full scale |
| Response | 5.0 cm at 1 ms-1 | 150 ms Platinum 20 ms Thermistor* | 25 ms |
*Optional
Further details can be found in the manufacturer's specification sheet.
Dr Haardt BackScat I fluorometer
The Dr Haardt BackScat I is a backscatter fluorometer designed to detect concentrations of a variety of substances in the water column. The instrument uses a Xe-flashlight source and exhibits a fast response and low power consumption. Integrated turbidity and other sensors are available and the instrument has a titanium housing rated to a maximum depth of 6000 m.
Each fluorometer is custom-built to measure substances of interest. Available spectral ranges are visible, UV I and UV II. A range of filter units are available for the measurement of chlorophyll-a, phycoerythrin, humic acids, aromatic hydrocarbons, phenol, oils, rhodamine B, sulforhodamine, fluorescein, eosin, pyranin and naphthionate.
Seapoint Turbidity Meter
The Seapoint Turbidity Meter detects light scattered by particles suspended in water, generating an output voltage proportional to turbidity or suspended solids. Range is selected by two digital lines which can be hard wired or microprocessor controlled, thereby choosing the appropriate range and resolution for measurement of extremely clean to very turbid waters. The offset voltage is within 1 mV of zero and requires no adjustment across gains. The optical design confines the sensing volume to within 5 cm of the sensor allowing near-bottom measurements and minimizing errant reflections in restricted spaces.
Sensor specifications, current at August 2006, are given in the table below.
Sensor Specifications
| Power requirements | 7 - 20 VDC, 3.5 mA avg., 6 mA pk. |
|---|---|
| Output | 0 - 5.0 VDC |
| Output Time Constant | 0.1 sec. |
| RMS Noise> | < 1 mV |
| Power-up transient period | < 1 sec. |
| Light Source Wavelength | 880 nm |
| Sensing Distance (from windows) | < 5 cm (approx.) |
| Linearity | < 2% deviation 0 - 750 FTU |
| Gain | Sensitivity (mV FTU-1) | Range (FTU) | |
|---|---|---|---|
| Sensitivity/Range | 100x 20x 5x 1x | 200 40 10 2 | 25 125 500 ** |
** output is non-linear above 750 FTU.
Further details can be found in the manufacturer's specification sheet.
RV Corystes Cruise 7/98 CTD Data Documentation
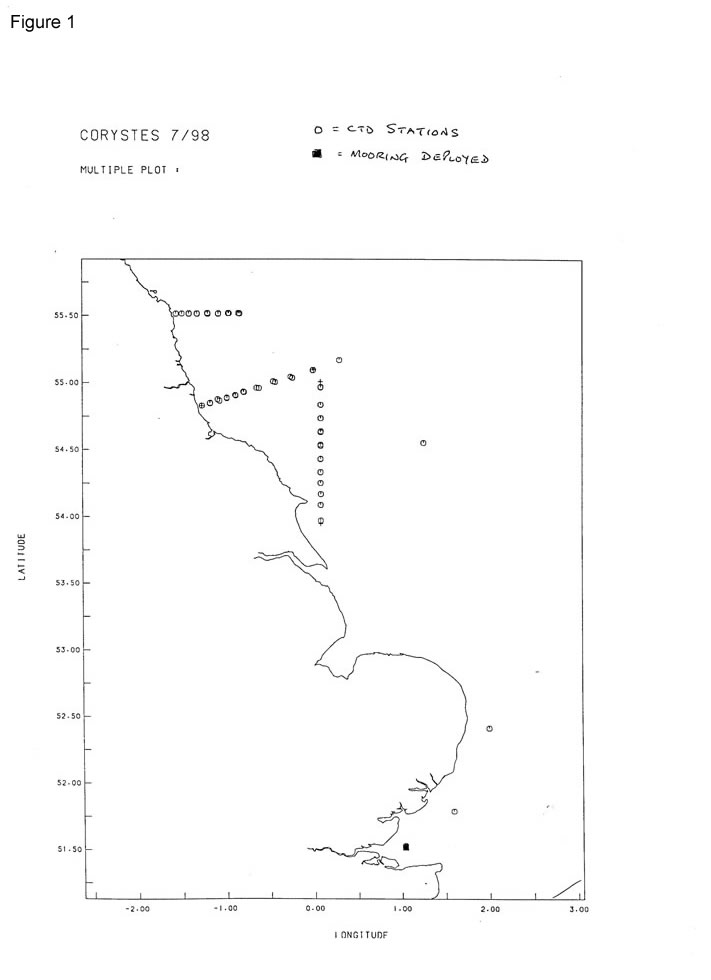
Thirty-eight CTD profiles were obtained using a FSI ICTD (s/n 1351) during the North Sea component of this cruise; see Figure 1.
Samples were collected for salinity analysis (using a Guildline salinometer) to derive a calibration for the instrument conductivity sensor and a single pair of digital reversing thermometers used to compare with the CTD temperature estimates. A fluorometer, a Seapoint turbidity meter and a photosynthetically active radiation sensor with a six decade log amplifier were fitted to the rosette. Chlorophyll samples were collected to calibrate the fluorometer and samples for suspended particulate matter analysis were used to calibrate the turbidity sensor.
CTD Sensor Calibration
(a) Pressure
The pressure sensor was calibrated using a dead-weight tester before the cruise on 17/6/98. This suggested that a correction of
-0.0014 * P(ctd) + 0.5 dbar
was required at an atmospheric pressure of 1020mb. During the cruise the 'on deck' CTD pressure was recorded and this consistently indicated that the sensor was reading too low by 0.5 dbar, in good agreement with the laboratory calibration, and the above equation was used to correct the pressure estimates.
(b) Temperature
The PRT temperature sensor fitted to the CTD was calibrated using PRT's on 17/6/1998 and this was used to correct the CTD temperature :
T(cor) = T(unc) + dT
dT = a*T(unc)*T(unc) + b*T(unc) + c
where a = 1.7855e-5 b = -5.0040e-4 c = 2.20e-4
These are equivalent to corrections of -0.001 at 4 degC and -0.003 at 14 degC.
Because of the slow response of the CTD PRT cf the conductivity sensor CTD salinity was computed using the thermistor temperature. The thermistor was calibrated with a PRT and corrected as above
where a = 7.7306e-5 b= -2.084e-3 c= 7.198e-3
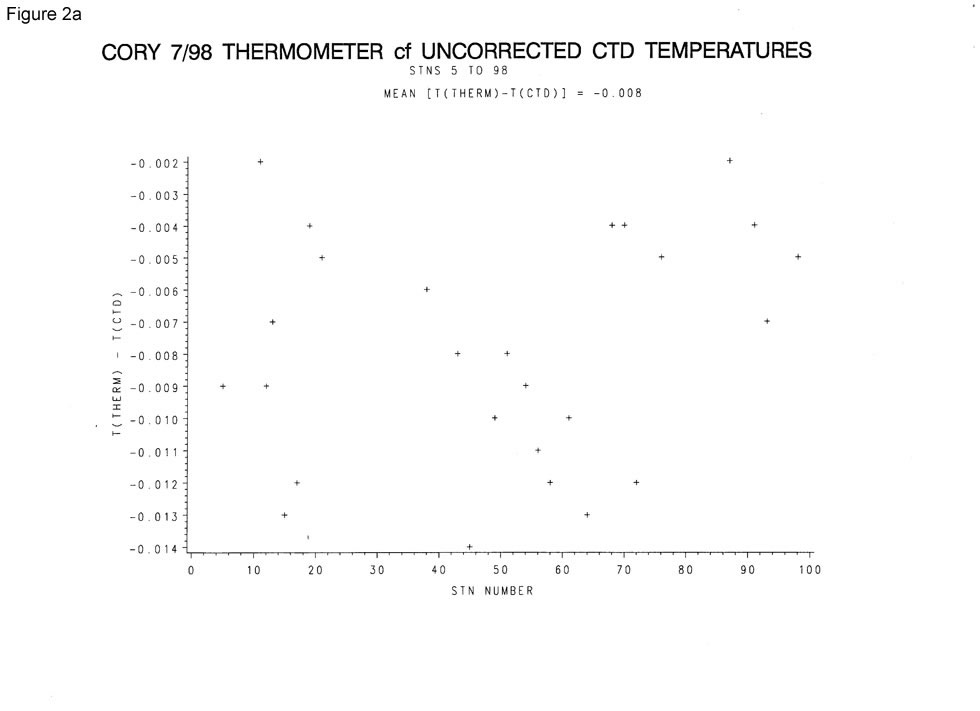
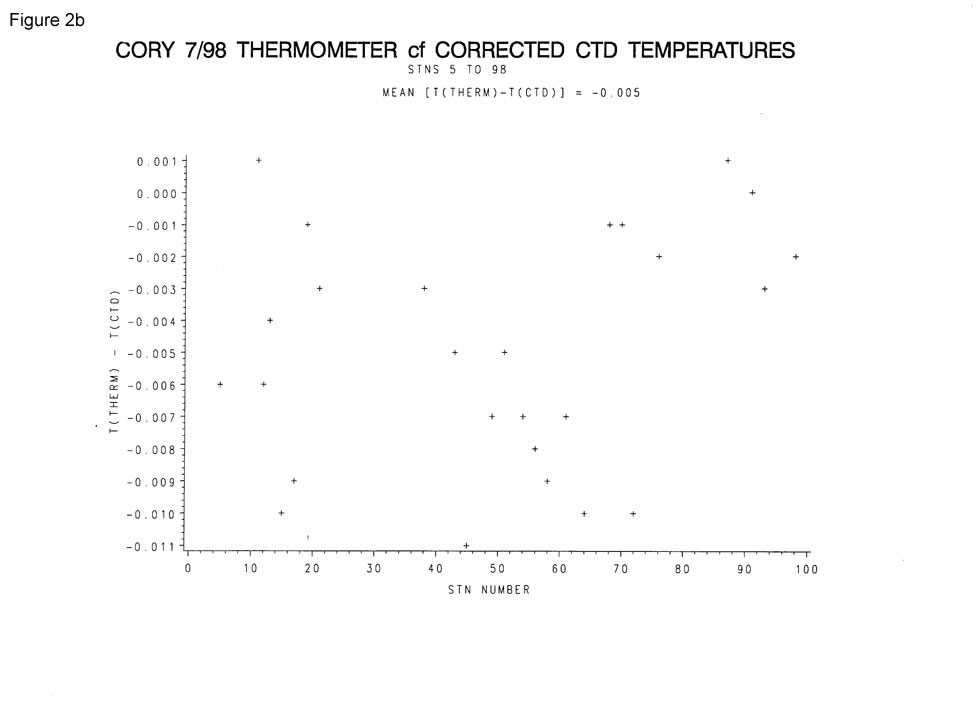
One pair of electronic thermometers was fitted to one Niskin bottle. The differences between the thermometers and CTD are plotted in Figures 2(a) and 2(b). The difference between thermometer and corrected CTD temperature is not significant, being within the tolerances of the two sensors (+/- 0.005 degC for the thermometers ).
(c) Conductivity
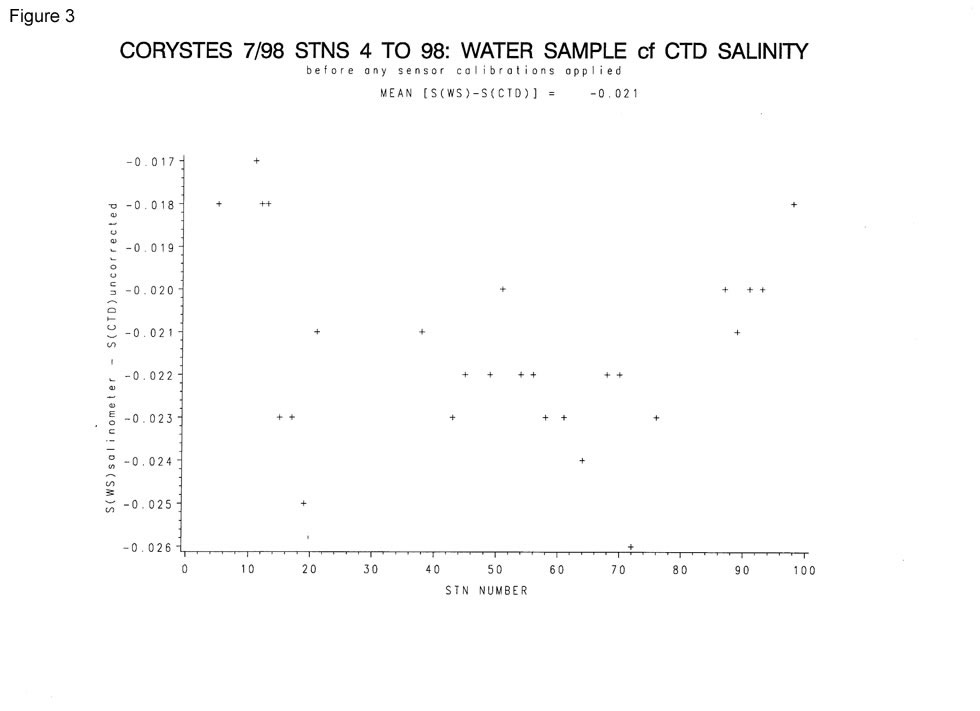
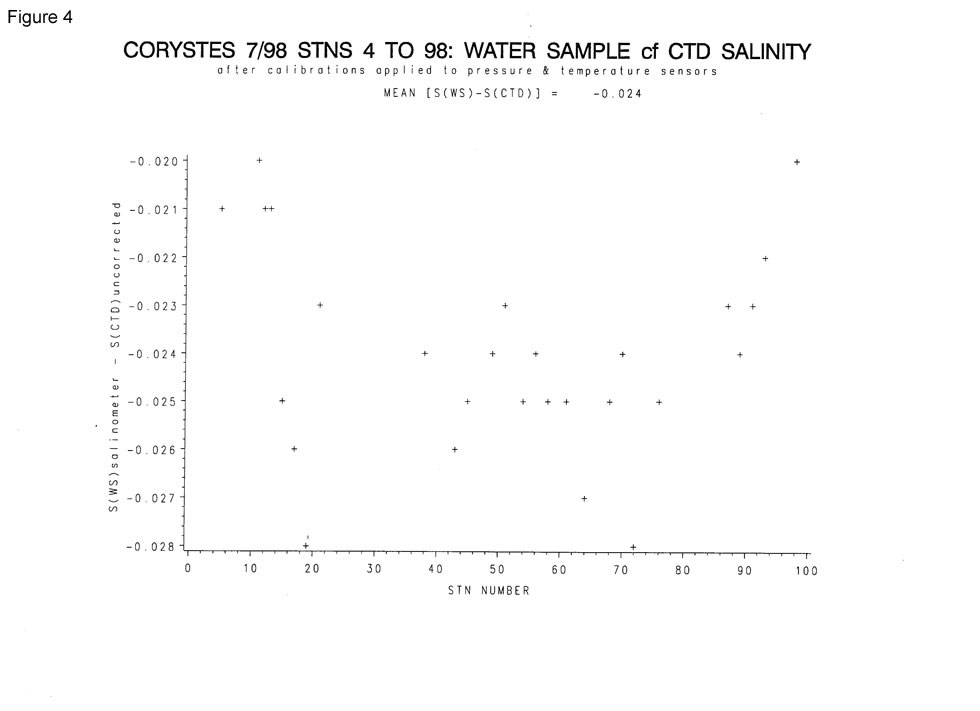
The difference between salinometer and CTD salinity before any corrections are applied to the sensors is plotted in Figure 3. The mean difference (-0.021) increases slightly to -0.024 after the pressure and temperature calibrations have been applied, standard deviation 0.002, as shown in Figure 4.
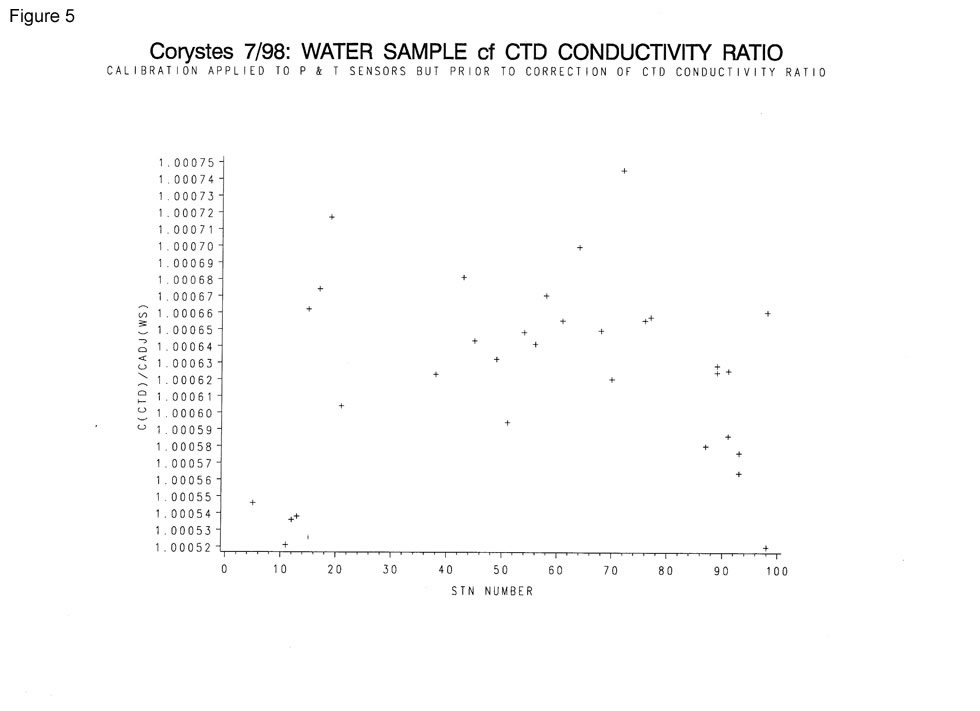
Figure 5 shows conductivity ratio(CTD): conductivity ratio(water samples), the water sample conductivity ratio being that from the salinometer salinity at the corrected pressure and temperature given by the CTD. The CTD conductivity is clearly being over-estimated.
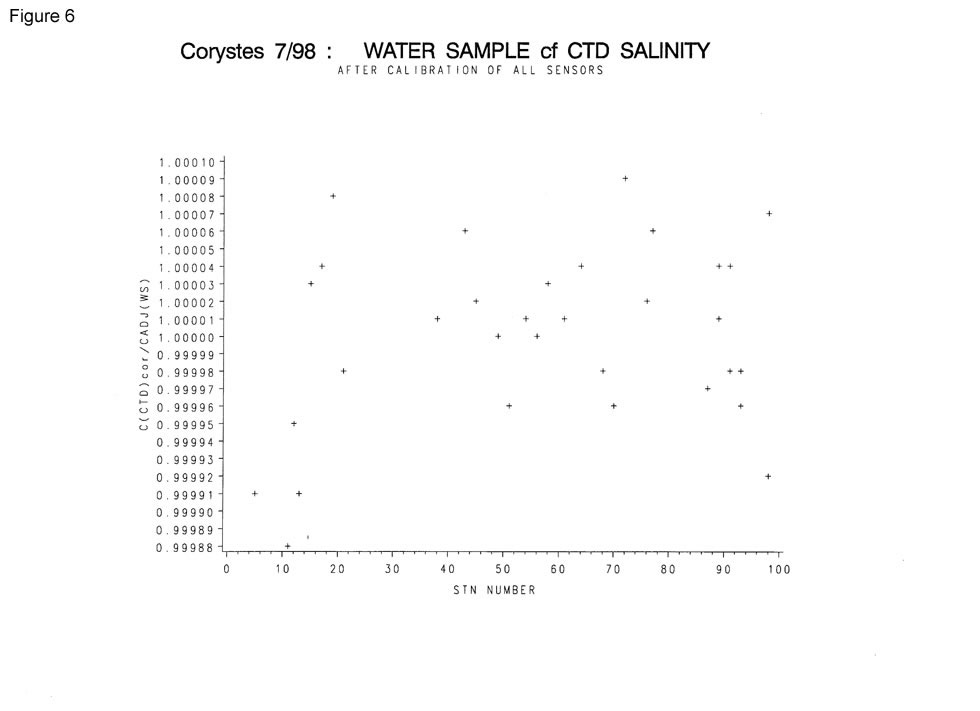
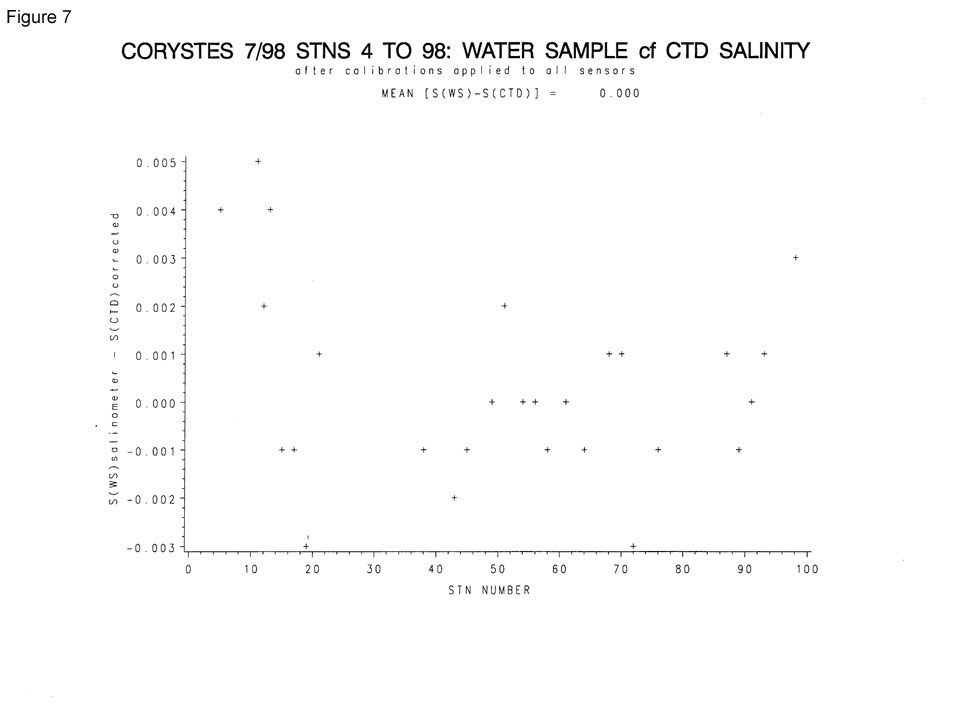
To compensate for this a least square fit was used to determine appropriate calibration coefficients:
CR(cor) = CR(ctd) [a*T(cor) + b*P(cor) + c]
where T(cor) and P(cor) are the corrected CTD temperature and pressure and
a = -1.9133367e-6, b = -9.487050e-7, c = 0.9994432
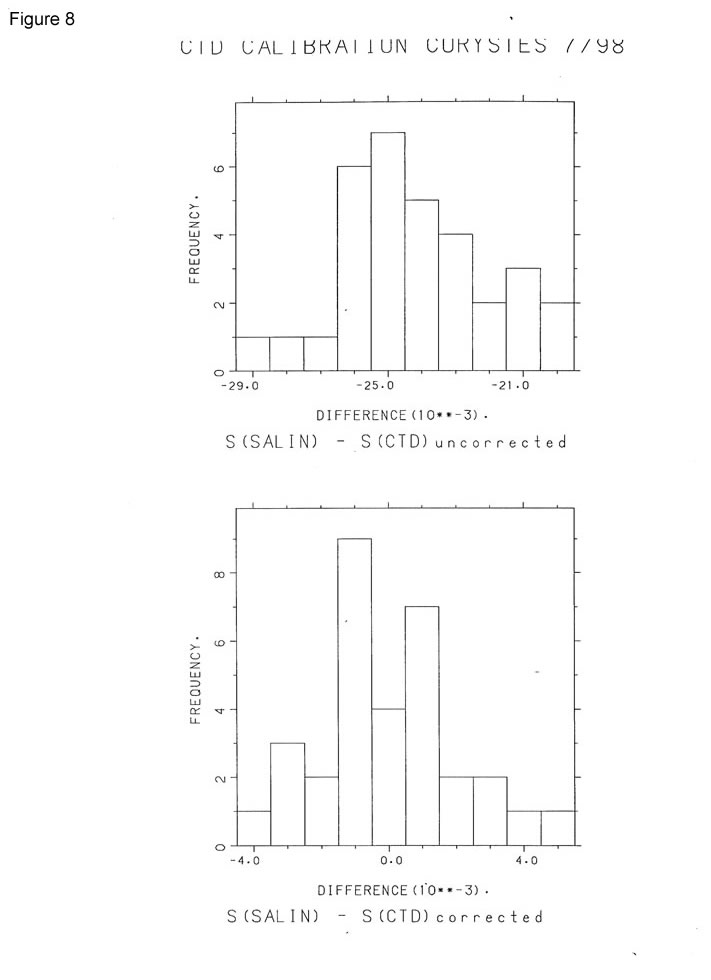
Using these coefficients the rms difference between water sample (salinometer) and corrected CTD salinity is 0.002 for 32 samples. Figures 6, 7 and 8 show how effective these coefficients are in correcting the CTD salinity. The histograms of Figure 8 show the differences before and after the application of the conductivity coefficients. The upper histogram shows the differences after temperature and pressure have been corrected; the bottom histogram after these and the conductivity calibration has been used. If it assumed that the CTD is accurate to 0.01 and the salinometer to 0.003 then differences of +/-0.013 are acceptable. In this instance all difference are well within +/-0.013 suggesting that these tolerances may be over-estimated.
Suspended Load Estimates
The Seapoint Turbidity Sensor was calibrated by comparing recorded voltages with samples collected (during ascent of the CTD) for suspended load analysis. At stations 1 to 25 the sensor gain was set to unity but with recorded values being so low this was re-set to 100 at station 38 for the remainder of the cruise.
suspended load (mg/l) = a * SPNT(volts) + b
where for stations 1 to 25:
a = 20.26, b = 0.54, N=22, R= 0.74
and for stations 38 to 98:
a = 4.870, b = 0.307, N= 47, R = 0.99
Fluorometer - Chlorophyll Calibration
A Dr Haart fluorometer was fitted to the rosette sampler and used to estimate chlorophyll levels. The sensor was calibrated by comparing recorded voltages when samples for chlorophyll analysis were collected. A least square fit of sample chlorophyll, Chl (ug/l), to fluorometer voltage, V, indicated that
Chl = 2.286 * V - 0.296 N=43, R= 0.81
Note that this calibration was not as well defined as for previous cruises. No explanation available for this but because the fluorometer failed during the cruise the samples were frozen and analysed later, during cruise Corystes 9a/98.
Photosynthetically Active Radiation
The LICOR light sensor (s/n 2944) used to measure photosynthetically active radiation was calibrated prior to the cruise using a standard lamp (ORL829). This gave an in-air current of 0.855microAmp per 217micromolesm-2s-1 which equates to 0.3350 micromolesm-2s-1 per nanoAmp in water.
Ken Medler
7/01/1999
General Data Screening carried out by BODC
BODC screen both the series header qualifying information and the parameter values in the data cycles themselves.
Header information is inspected for:
- Irregularities such as unfeasible values
- Inconsistencies between related information, for example:
- Times for instrument deployment and for start/end of data series
- Length of record and the number of data cycles/cycle interval
- Parameters expected and the parameters actually present in the data cycles
- Originator's comments on meter/mooring performance and data quality
Documents are written by BODC highlighting irregularities which cannot be resolved.
Data cycles are inspected using time or depth series plots of all parameters. Currents are additionally inspected using vector scatter plots and time series plots of North and East velocity components. These presentations undergo intrinsic and extrinsic screening to detect infeasible values within the data cycles themselves and inconsistencies as seen when comparing characteristics of adjacent data sets displaced with respect to depth, position or time. Values suspected of being of non-oceanographic origin may be tagged with the BODC flag denoting suspect value; the data values will not be altered.
The following types of irregularity, each relying on visual detection in the plot, are amongst those which may be flagged as suspect:
- Spurious data at the start or end of the record.
- Obvious spikes occurring in periods free from meteorological disturbance.
- A sequence of constant values in consecutive data cycles.
If a large percentage of the data is affected by irregularities then a Problem Report will be written rather than flagging the individual suspect values. Problem Reports are also used to highlight irregularities seen in the graphical data presentations.
Inconsistencies between the characteristics of the data set and those of its neighbours are sought and, where necessary, documented. This covers inconsistencies such as the following:
- Maximum and minimum values of parameters (spikes excluded).
- The occurrence of meteorological events.
This intrinsic and extrinsic screening of the parameter values seeks to confirm the qualifying information and the source laboratory's comments on the series. In screening and collating information, every care is taken to ensure that errors of BODC making are not introduced.
Project Information
No Project Information held for the Series
Data Activity or Cruise Information
Cruise
| Cruise Name | COR7/98 |
| Departure Date | 1998-07-03 |
| Arrival Date | 1998-07-24 |
| Principal Scientist(s) | Juan Brown (Centre for Environment, Fisheries and Aquaculture Science Lowestoft Laboratory) |
| Ship | RV Corystes |
Complete Cruise Metadata Report is available here
Fixed Station Information
No Fixed Station Information held for the Series
BODC Quality Control Flags
The following single character qualifying flags may be associated with one or more individual parameters with a data cycle:
| Flag | Description |
|---|---|
| Blank | Unqualified |
| < | Below detection limit |
| > | In excess of quoted value |
| A | Taxonomic flag for affinis (aff.) |
| B | Beginning of CTD Down/Up Cast |
| C | Taxonomic flag for confer (cf.) |
| D | Thermometric depth |
| E | End of CTD Down/Up Cast |
| G | Non-taxonomic biological characteristic uncertainty |
| H | Extrapolated value |
| I | Taxonomic flag for single species (sp.) |
| K | Improbable value - unknown quality control source |
| L | Improbable value - originator's quality control |
| M | Improbable value - BODC quality control |
| N | Null value |
| O | Improbable value - user quality control |
| P | Trace/calm |
| Q | Indeterminate |
| R | Replacement value |
| S | Estimated value |
| T | Interpolated value |
| U | Uncalibrated |
| W | Control value |
| X | Excessive difference |
SeaDataNet Quality Control Flags
The following single character qualifying flags may be associated with one or more individual parameters with a data cycle:
| Flag | Description |
|---|---|
| 0 | no quality control |
| 1 | good value |
| 2 | probably good value |
| 3 | probably bad value |
| 4 | bad value |
| 5 | changed value |
| 6 | value below detection |
| 7 | value in excess |
| 8 | interpolated value |
| 9 | missing value |
| A | value phenomenon uncertain |
| B | nominal value |
| Q | value below limit of quantification |
