Metadata Report for BODC Series Reference Number 599384
Metadata Summary
Problem Reports
Data Access Policy
Narrative Documents
Project Information
Data Activity or Cruise Information
Fixed Station Information
BODC Quality Flags
SeaDataNet Quality Flags
Metadata Summary
Data Description |
|||||||||||||||||||||||||
|
|||||||||||||||||||||||||
Data Identifiers |
|||||||||||||||||||||||||
|
|||||||||||||||||||||||||
Time Co-ordinates(UT) |
|||||||||||||||||||||||||
|
|||||||||||||||||||||||||
Spatial Co-ordinates | |||||||||||||||||||||||||
|
|||||||||||||||||||||||||
Parameters |
|||||||||||||||||||||||||
|
|||||||||||||||||||||||||
|
|||||||||||||||||||||||||
Problem Reports
No Problem Report Found in the Database
Data Access Policy
Open Data
These data have no specific confidentiality restrictions for users. However, users must acknowledge data sources as it is not ethical to publish data without proper attribution. Any publication or other output resulting from usage of the data should include an acknowledgment.
If the Information Provider does not provide a specific attribution statement, or if you are using Information from several Information Providers and multiple attributions are not practical in your product or application, you may consider using the following:
"Contains public sector information licensed under the Open Government Licence v1.0."
Narrative Documents
Guildline 8705 CTD
The 8705 CTD is a conductivity-temperature-pressure profiler designed for marine applications down to depths of 6000 m. The instrument includes an anodised aluminium tube with a steel cage to protect the temperature and conductivity sensors and a urethane cap to protect the pressure sensor.
Specifications
| Parameter | Range | Accuracy | Resolution | Stability | Response time |
|---|---|---|---|---|---|
| Pressure | 0 to 6000 dbar | ± 0.15% of full range | ± 0.01% of full range | - | < 50 ms |
| Temperature | -2 to 30 °C | ± 0.005 °C | ± 0.0005 °C | ± 0.002 °C over 30 days ± 0.0025°C over 6 months | < 50 ms |
| Conductivity * | 100 ppm to 40 ppt | ± 0.005 ppt | ± 0.001 ppt | ± 0.002 ppt over 6 months | < 50 ms |
* Conductivity specifications are given in terms of equivalent salinity
Further details can be found in the manufacturer's specification sheet.
RV Cirolana Cruise 4B/96 CTD Data Documentation
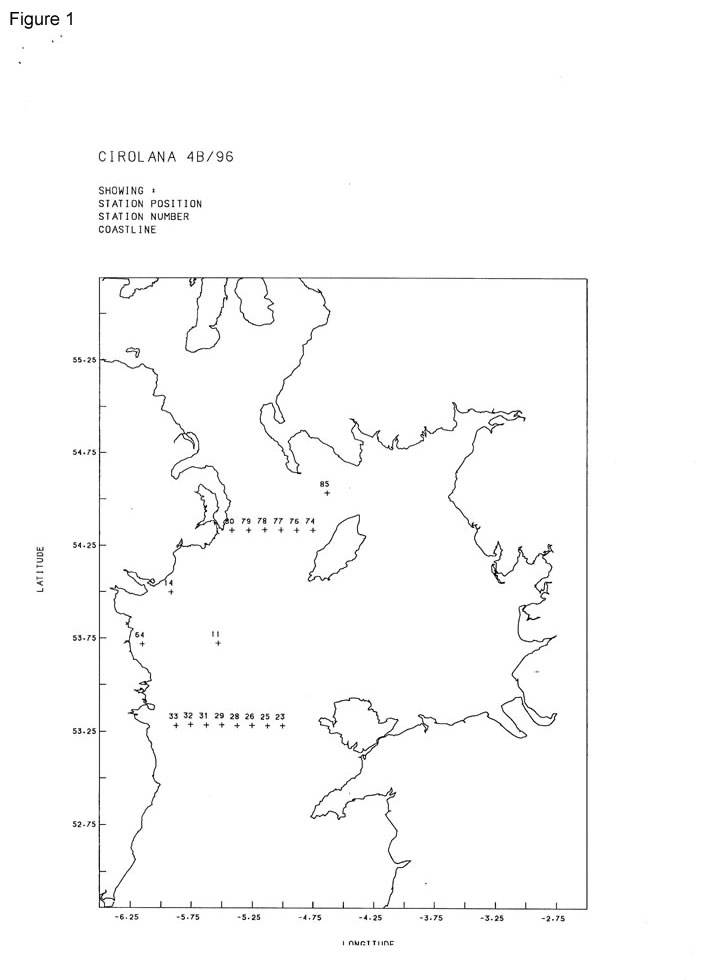
Eighteen CTD profiles were obtained using a Guildline 8705 CTD (s/n 45056) during this cruise to the Irish Sea; see Figure 1. A conductivity problem appears to exist at stations 64 and 74 when estimated salinity is too low and these two profiles should be used with caution.
Electronic reversing thermometers were used to compare with temperatures recorded by the CTD and samples were collected for salinity analysis to derive a calibration for the instrument conductivity sensor.
A 25cm path length transmissometer was fitted to the niskin rosette. Samples were collected for suspended load analysis for calibration of this sensor.
Thermometer data
Two pairs of digital reversing thermometers were used during the cruise and satisfactory measurements were made by both on 16 occasions. In all instances the difference between them were 0.01 degC.
Salinity
Samples for salinity analysis on the Laboratory's Guildline salinometer were collected at every station. Duplicate samples were drawn on four occasions and their differences were as follows:
| Difference | No. | Accumulative % |
|---|---|---|
| 0.000 | 3 | 75 |
| 0.001 | 1 | 100 |
CTD Sensor Calibration
(a) Pressure
The pressure sensor was calibrated using a dead-weight tester prior to the cruise on 22/03/1996 with the probe at a temperature of 21 degC. Given the sensitivity of this sensor to temperature this calibration was not ideal, but in the absence of 'on-deck' readings collected during the cruise this calibration was used to correct the recorded CTD pressure P(unc).
ie P(cor) =P(unc) + dP where dP = -1.3 dbar
(b) Temperature
The CTD temperature sensor was calibrated using PRT's on 22/03/1996 and correction factors derived:
T(cor) = T(unc) + dT
dT = aT(unc)T(unc) + bT(unc) + c
where a = 7.33E-5
b = -3.94E-4
c = 2.136E-2
This amounts to corrections of about 0.022 degC for temperatures encountered during the cruise.
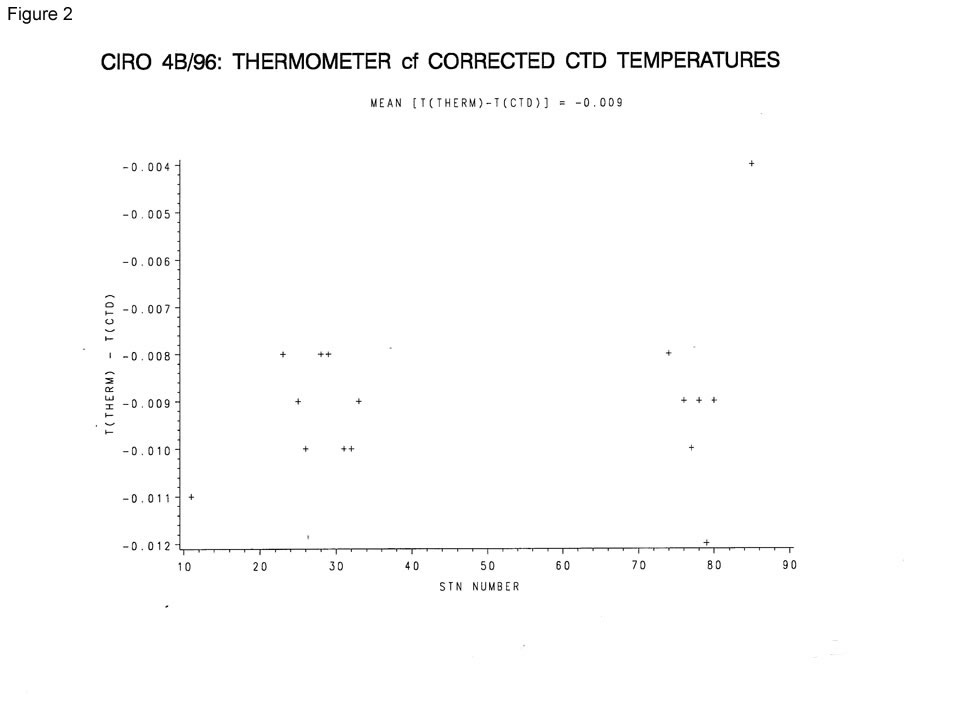
Figure 2 shows the difference between thermometer and corrected CTD temperatures. A mean difference of -0.009 degC is within the expected tolerance ( 0.005 degC for the thermometers alone).
(c) Conductivity
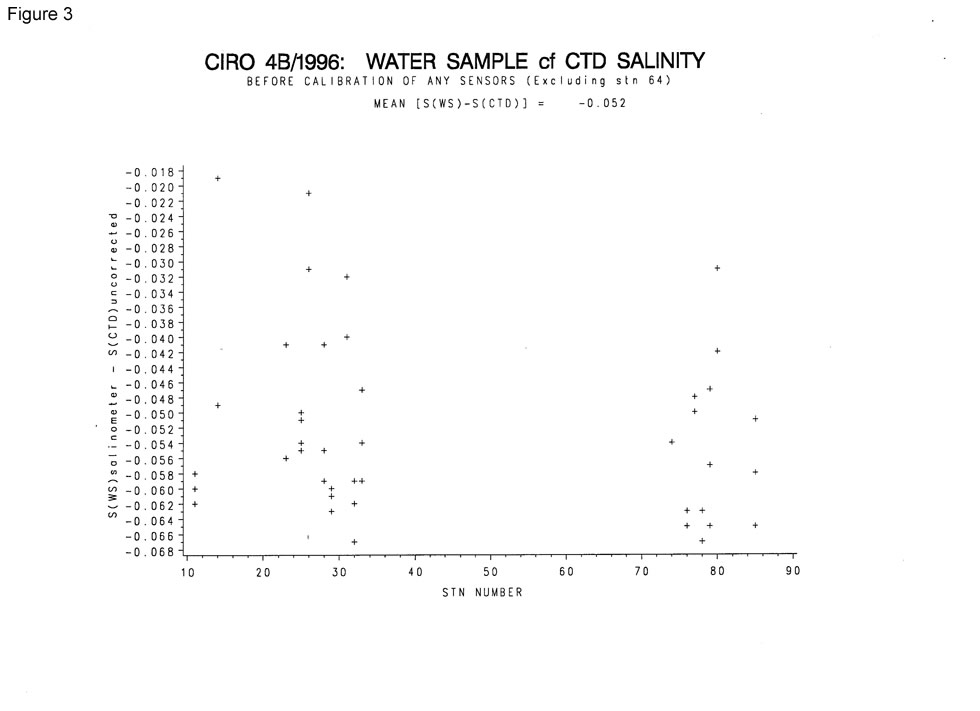
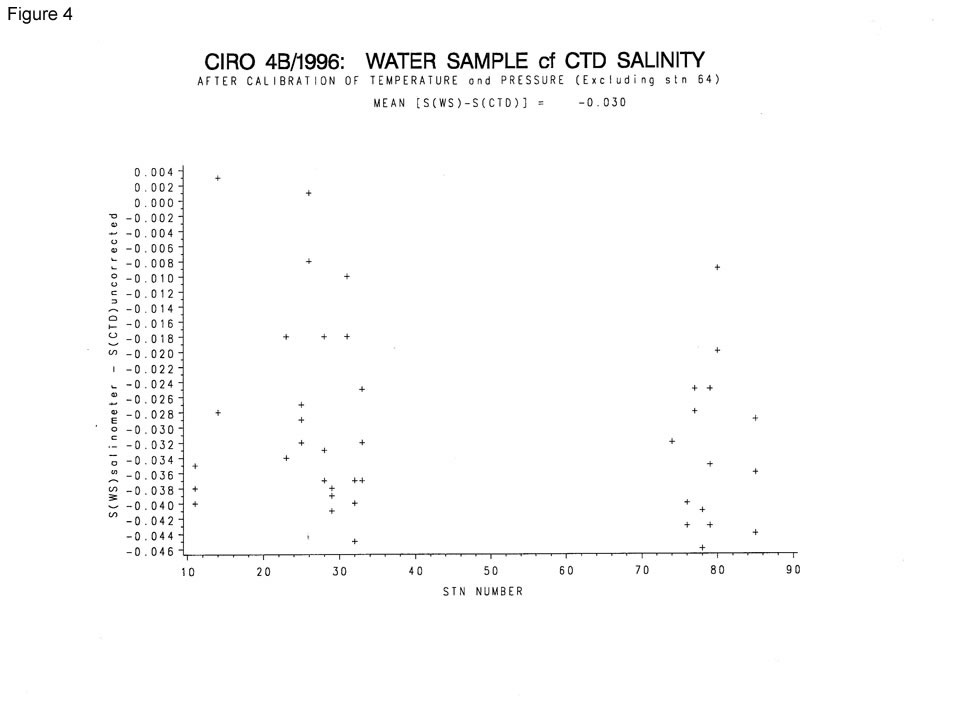
The difference between salinometer and CTD salinity before any corrections are applied to the sensors is plotted in Figure 3. The mean difference (-0.052) changes significantly ( to 0.030) after the pressure and temperature calibrations have been applied, see Fig 4.
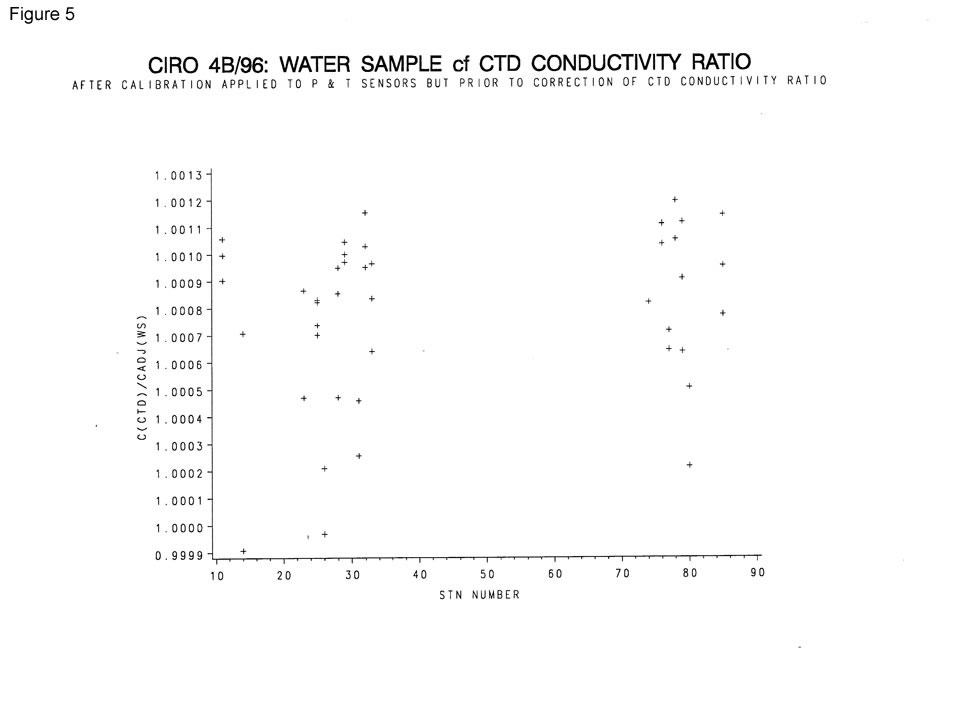
Figure 5 shows conductivity ratio(CTD): conductivity ratio(water samples), the water sample conductivity ratio being that from the salinometer salinity at the corrected pressure and temperature given by the CTD. The conductivity is clearly being over-estimated. To compensate for this a least square fit was used to determine appropriate calibration coefficients:
CR(cor) = CR(ctd) [a T(cor) + b P(cor) + c]
where T(cor) and P(cor) are the corrected CTD temperature and pressure and
a = 4.0488757e-4, b = 1.632750e-7, c = 0.9961096
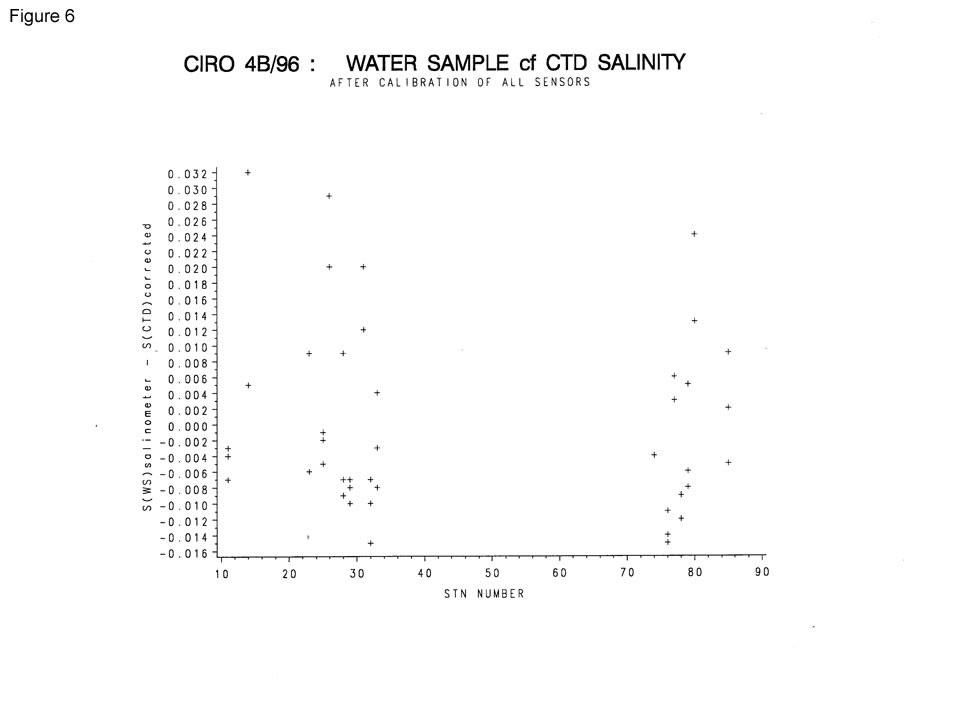
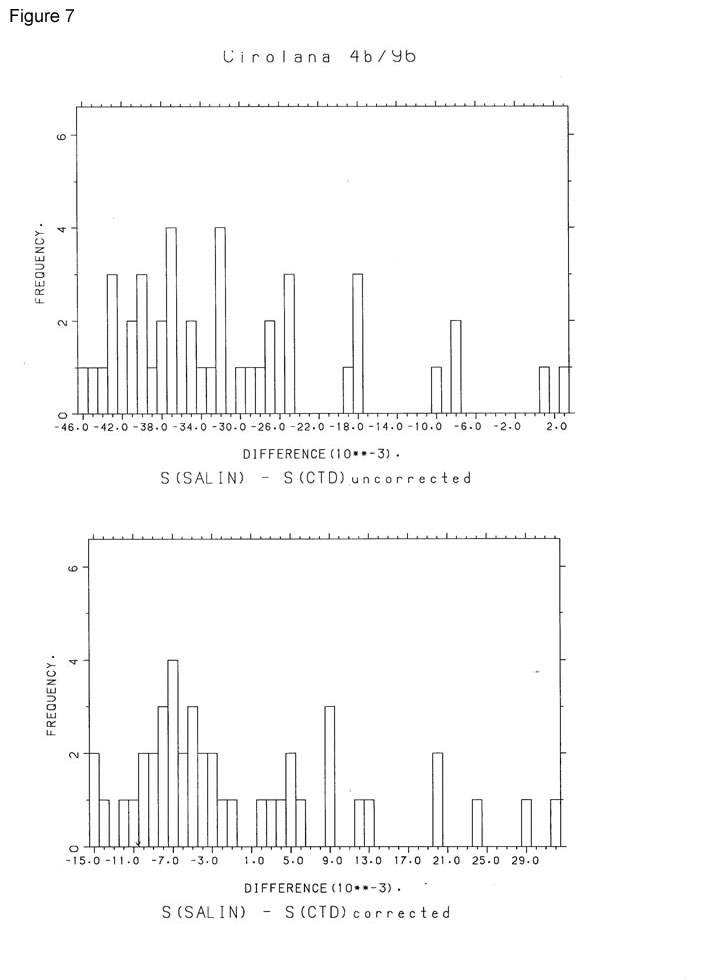
Using these coefficients the rms difference between water sample and corrected CTD salinity is 0.012 for 43 samples. Figures 6 and 7 show how effective these coefficients are correcting the CTD derived salinity. The histograms of Figure 7 show the differences before and after the application of these conductivity coefficients. The upper histogram shows the differences after temperature and pressure have been corrected; the bottom histogram after these and the conductivity calibration has been used. If it assumed that the CTD is accurate to 0.01 and the salinometer to 0.006 then differences of +/-0.016 are acceptable. In this instance only 5 of 43 samples are outside this range and 8 are outside +/-0.013. This is not as good as has been measured previously and in view of the rejection of the profiles at stations 64 and 74 may indicate that the instrument requires some attention.
Suspended Load
The transmissometer voltage was compared with measured suspended load for the samples and recorded voltage used to estimate suspended load:
suspended load (mg/l) = a*loge%transmission + b
where
a = -17.18, b = 65.77, (N= 44, R=0.93, rmse= 1.1)
K.Medler
13/11/96
General Data Screening carried out by BODC
BODC screen both the series header qualifying information and the parameter values in the data cycles themselves.
Header information is inspected for:
- Irregularities such as unfeasible values
- Inconsistencies between related information, for example:
- Times for instrument deployment and for start/end of data series
- Length of record and the number of data cycles/cycle interval
- Parameters expected and the parameters actually present in the data cycles
- Originator's comments on meter/mooring performance and data quality
Documents are written by BODC highlighting irregularities which cannot be resolved.
Data cycles are inspected using time or depth series plots of all parameters. Currents are additionally inspected using vector scatter plots and time series plots of North and East velocity components. These presentations undergo intrinsic and extrinsic screening to detect infeasible values within the data cycles themselves and inconsistencies as seen when comparing characteristics of adjacent data sets displaced with respect to depth, position or time. Values suspected of being of non-oceanographic origin may be tagged with the BODC flag denoting suspect value; the data values will not be altered.
The following types of irregularity, each relying on visual detection in the plot, are amongst those which may be flagged as suspect:
- Spurious data at the start or end of the record.
- Obvious spikes occurring in periods free from meteorological disturbance.
- A sequence of constant values in consecutive data cycles.
If a large percentage of the data is affected by irregularities then a Problem Report will be written rather than flagging the individual suspect values. Problem Reports are also used to highlight irregularities seen in the graphical data presentations.
Inconsistencies between the characteristics of the data set and those of its neighbours are sought and, where necessary, documented. This covers inconsistencies such as the following:
- Maximum and minimum values of parameters (spikes excluded).
- The occurrence of meteorological events.
This intrinsic and extrinsic screening of the parameter values seeks to confirm the qualifying information and the source laboratory's comments on the series. In screening and collating information, every care is taken to ensure that errors of BODC making are not introduced.
Project Information
No Project Information held for the Series
Data Activity or Cruise Information
Cruise
| Cruise Name | CIR4B/96 |
| Departure Date | 1996-04-12 |
| Arrival Date | 1996-04-26 |
| Principal Scientist(s) | Juan Brown (Ministry of Agriculture, Fisheries and Food Lowestoft Fisheries Laboratory) |
| Ship | RV Cirolana |
Complete Cruise Metadata Report is available here
Fixed Station Information
No Fixed Station Information held for the Series
BODC Quality Control Flags
The following single character qualifying flags may be associated with one or more individual parameters with a data cycle:
| Flag | Description |
|---|---|
| Blank | Unqualified |
| < | Below detection limit |
| > | In excess of quoted value |
| A | Taxonomic flag for affinis (aff.) |
| B | Beginning of CTD Down/Up Cast |
| C | Taxonomic flag for confer (cf.) |
| D | Thermometric depth |
| E | End of CTD Down/Up Cast |
| G | Non-taxonomic biological characteristic uncertainty |
| H | Extrapolated value |
| I | Taxonomic flag for single species (sp.) |
| K | Improbable value - unknown quality control source |
| L | Improbable value - originator's quality control |
| M | Improbable value - BODC quality control |
| N | Null value |
| O | Improbable value - user quality control |
| P | Trace/calm |
| Q | Indeterminate |
| R | Replacement value |
| S | Estimated value |
| T | Interpolated value |
| U | Uncalibrated |
| W | Control value |
| X | Excessive difference |
SeaDataNet Quality Control Flags
The following single character qualifying flags may be associated with one or more individual parameters with a data cycle:
| Flag | Description |
|---|---|
| 0 | no quality control |
| 1 | good value |
| 2 | probably good value |
| 3 | probably bad value |
| 4 | bad value |
| 5 | changed value |
| 6 | value below detection |
| 7 | value in excess |
| 8 | interpolated value |
| 9 | missing value |
| A | value phenomenon uncertain |
| B | nominal value |
| Q | value below limit of quantification |
