Metadata Report for BODC Series Reference Number 1079572
Metadata Summary
Problem Reports
Data Access Policy
Narrative Documents
Project Information
Data Activity or Cruise Information
Fixed Station Information
BODC Quality Flags
SeaDataNet Quality Flags
Metadata Summary
Data Description |
|||||||||||||||||||||||||||||||||||||||||||||||||||||
|
|||||||||||||||||||||||||||||||||||||||||||||||||||||
Data Identifiers |
|||||||||||||||||||||||||||||||||||||||||||||||||||||
|
|||||||||||||||||||||||||||||||||||||||||||||||||||||
Time Co-ordinates(UT) |
|||||||||||||||||||||||||||||||||||||||||||||||||||||
|
|||||||||||||||||||||||||||||||||||||||||||||||||||||
Spatial Co-ordinates | |||||||||||||||||||||||||||||||||||||||||||||||||||||
|
|||||||||||||||||||||||||||||||||||||||||||||||||||||
Parameters |
|||||||||||||||||||||||||||||||||||||||||||||||||||||
|
|||||||||||||||||||||||||||||||||||||||||||||||||||||
|
|||||||||||||||||||||||||||||||||||||||||||||||||||||
Problem Reports
No Problem Report Found in the Database
D352 CTD data quality
Beam transmission
Values of percentage beam transmission encountered during cruise D352 were found to be regularly in excess of 100%. This should not have occurred. The beam transmissometer on the CTD was not calibrated during D352 and before the cruise its most recent calibration was in 2005. As the calibration was approximately 4 - 5 years old at the time of D352, it is likely that the transmissometer sensors have deteriorated and that the 2005 calibration was not providing accurate absolute values of beam transmission.
BODC therefore recommend that CTD beam transmission data for cruise D352 be used for qualitative purposes only and that the data are used with caution.
Dissolved oxygen
For casts 23, 25 and 30, the source data used in the calculation of the oxygen concentration have been identified as inferior to those in the banked data. Therefore, the oxygen values in the banked data may be questionable and should be used with caution.
Data Access Policy
Open Data
These data have no specific confidentiality restrictions for users. However, users must acknowledge data sources as it is not ethical to publish data without proper attribution. Any publication or other output resulting from usage of the data should include an acknowledgment.
If the Information Provider does not provide a specific attribution statement, or if you are using Information from several Information Providers and multiple attributions are not practical in your product or application, you may consider using the following:
"Contains public sector information licensed under the Open Government Licence v1.0."
Narrative Documents
Sea-Bird Dissolved Oxygen Sensor SBE 43 and SBE 43F
The SBE 43 is a dissolved oxygen sensor designed for marine applications. It incorporates a high-performance Clark polarographic membrane with a pump that continuously plumbs water through it, preventing algal growth and the development of anoxic conditions when the sensor is taking measurements.
Two configurations are available: SBE 43 produces a voltage output and can be incorporated with any Sea-Bird CTD that accepts input from a 0-5 volt auxiliary sensor, while the SBE 43F produces a frequency output and can be integrated with an SBE 52-MP (Moored Profiler CTD) or used for OEM applications. The specifications below are common to both.
Specifications
| Housing | Plastic or titanium |
| Membrane | 0.5 mil- fast response, typical for profile applications 1 mil- slower response, typical for moored applications |
| Depth rating | 600 m (plastic) or 7000 m (titanium) 10500 m titanium housing available on request |
| Measurement range | 120% of surface saturation |
| Initial accuracy | 2% of saturation |
| Typical stability | 0.5% per 1000 h |
Further details can be found in the manufacturer's specification sheet.
Sea-Bird Electronics SBE 911 and SBE 917 series CTD profilers
The SBE 911 and SBE 917 series of conductivity-temperature-depth (CTD) units are used to collect hydrographic profiles, including temperature, conductivity and pressure as standard. Each profiler consists of an underwater unit and deck unit or SEARAM. Auxiliary sensors, such as fluorometers, dissolved oxygen sensors and transmissometers, and carousel water samplers are commonly added to the underwater unit.
Underwater unit
The CTD underwater unit (SBE 9 or SBE 9 plus) comprises a protective cage (usually with a carousel water sampler), including a main pressure housing containing power supplies, acquisition electronics, telemetry circuitry, and a suite of modular sensors. The original SBE 9 incorporated Sea-Bird's standard modular SBE 3 temperature sensor and SBE 4 conductivity sensor, and a Paroscientific Digiquartz pressure sensor. The conductivity cell was connected to a pump-fed plastic tubing circuit that could include auxiliary sensors. Each SBE 9 unit was custom built to individual specification. The SBE 9 was replaced in 1997 by an off-the-shelf version, termed the SBE 9 plus, that incorporated the SBE 3 plus (or SBE 3P) temperature sensor, SBE 4C conductivity sensor and a Paroscientific Digiquartz pressure sensor. Sensors could be connected to a pump-fed plastic tubing circuit or stand-alone.
Temperature, conductivity and pressure sensors
The conductivity, temperature, and pressure sensors supplied with Sea-Bird CTD systems have outputs in the form of variable frequencies, which are measured using high-speed parallel counters. The resulting count totals are converted to numeric representations of the original frequencies, which bear a direct relationship to temperature, conductivity or pressure. Sampling frequencies for these sensors are typically set at 24 Hz.
The temperature sensing element is a glass-coated thermistor bead, pressure-protected inside a stainless steel tube, while the conductivity sensing element is a cylindrical, flow-through, borosilicate glass cell with three internal platinum electrodes. Thermistor resistance or conductivity cell resistance, respectively, is the controlling element in an optimized Wien Bridge oscillator circuit, which produces a frequency output that can be converted to a temperature or conductivity reading. These sensors are available with depth ratings of 6800 m (aluminium housing) or 10500 m (titanium housing). The Paroscientific Digiquartz pressure sensor comprises a quartz crystal resonator that responds to pressure-induced stress, and temperature is measured for thermal compensation of the calculated pressure.
Additional sensors
Optional sensors for dissolved oxygen, pH, light transmission, fluorescence and others do not require the very high levels of resolution needed in the primary CTD channels, nor do these sensors generally offer variable frequency outputs. Accordingly, signals from the auxiliary sensors are acquired using a conventional voltage-input multiplexed A/D converter (optional). Some Sea-Bird CTDs use a strain gauge pressure sensor (Senso-Metrics) in which case their pressure output data is in the same form as that from the auxiliary sensors as described above.
Deck unit or SEARAM
Each underwater unit is connected to a power supply and data logging system: the SBE 11 (or SBE 11 plus) deck unit allows real-time interfacing between the deck and the underwater unit via a conductive wire, while the submersible SBE 17 (or SBE 17 plus) SEARAM plugs directly into the underwater unit and data are downloaded on recovery of the CTD. The combination of SBE 9 and SBE 17 or SBE 11 are termed SBE 917 or SBE 911, respectively, while the combinations of SBE 9 plus and SBE 17 plus or SBE 11 plus are termed SBE 917 plus or SBE 911 plus.
Specifications
Specifications for the SBE 9 plus underwater unit are listed below:
| Parameter | Range | Initial accuracy | Resolution at 24 Hz | Response time |
|---|---|---|---|---|
| Temperature | -5 to 35°C | 0.001°C | 0.0002°C | 0.065 sec |
| Conductivity | 0 to 7 S m-1 | 0.0003 S m-1 | 0.00004 S m-1 | 0.065 sec (pumped) |
| Pressure | 0 to full scale (1400, 2000, 4200, 6800 or 10500 m) | 0.015% of full scale | 0.001% of full scale | 0.015 sec |
Further details can be found in the manufacturer's specification sheet.
Chelsea Technologies Group Aquatracka MKIII fluorometer
The Chelsea Technologies Group Aquatracka MKIII is a logarithmic response fluorometer. Filters are available to enable the instrument to measure chlorophyll, rhodamine, fluorescein and turbidity.
It uses a pulsed (5.5 Hz) xenon light source discharging along two signal paths to eliminate variations in the flashlamp intensity. The reference path measures the intensity of the light source whilst the signal path measures the intensity of the light emitted from the specimen under test. The reference signal and the emitted light signals are then applied to a ratiometric circuit. In this circuit, the ratio of returned signal to reference signal is computed and scaled logarithmically to achieve a wide dynamic range. The logarithmic conversion accuracy is maintained at better than one percent of the reading over the full output range of the instrument.
Two variants of the instrument are available, both manufactured in titanium, capable of operating in depths from shallow water down to 2000 m and 6000 m respectively. The optical characteristics of the instrument in its different detection modes are visible below:
| Excitation | Chlorophyll a | Rhodamine | Fluorescein | Turbidity |
|---|---|---|---|---|
| Wavelength (nm) | 430 | 500 | 485 | 440* |
| Bandwidth (nm) | 105 | 70 | 22 | 80* |
| Emission | Chlorophyll a | Rhodamine | Fluorescein | Turbidity |
| Wavelength (nm) | 685 | 590 | 530 | 440* |
| Bandwidth (nm) | 30 | 45 | 30 | 80* |
* The wavelengths for the turbidity filters are customer selectable but must be in the range 400 to 700 nm. The same wavelength is used in the excitation path and the emission path.
The instrument measures chlorophyll a, rhodamine and fluorescein with a concentration range of 0.01 µg l-1 to 100 µg l-1. The concentration range for turbidity is 0.01 to 100 FTU (other wavelengths are available on request).
The instrument accuracy is ± 0.02 µg l-1 (or ± 3% of the reading, whichever is greater) for chlorophyll a, rhodamine and fluorescein. The accuracy for turbidity, over a 0 - 10 FTU range, is ± 0.02 FTU (or ± 3% of the reading, whichever is greater).
Further details are available from the Aquatracka MKIII specification sheet.
Chelsea Technologies Group ALPHAtracka and ALPHAtracka II transmissometers
The Chelsea Technologies Group ALPHAtracka (the Mark I) and its successor, the ALPHAtracka II (the Mark II), are both accurate (< 0.3 % fullscale) transmissometers that measure the beam attenuation coefficient at 660 nm. Green (565 nm), yellow (590 nm) and blue (470 nm) wavelength variants are available on special order.
The instrument consists of a Transmitter/Reference Assembly and a Detector Assembly aligned and spaced apart by an open support frame. The housing and frame are both manufactured in titanium and are pressure rated to 6000 m depth.
The Transmitter/Reference housing is sealed by an end cap. Inside the housing an LED light source emits a collimated beam through a sealed window. The Detector housing is also sealed by an end cap. A signal photodiode is placed behind a sealed window to receive the collimated beam from the Transmitter.
The primary difference between the ALPHAtracka and ALPHAtracka II is that the Alphatracka II is implemented with surface-mount technology; this has enabled a much smaller diameter pressure housing to be used while retaining exactly the same optical train as in the Mark I. Data from the Mark II version are thus fully compatible with that already obtained with the Mark I. The performance of the Mark II is further enhanced by two electronic developments from Chelsea Technologies Group - firstly, all items are locked in a signal nulling loop of near infinite gain and, secondly, the signal output linearity is inherently defined by digital circuitry only.
Among other advantages noted above, these features ensure that the optical intensity of the Mark II, indicated by the output voltage, is accurately represented by a straight line interpolation between a reading near full-scale under known conditions and a zero reading when blanked off.
For optimum measurements in a wide range of environmental conditions, the Mark I and Mark II are available in 5 cm, 10 cm and 25 cm path length versions. Output is default factory set to 2.5 volts but can be adjusted to 5 volts on request.
Further details about the Mark II instrument are available from the Chelsea Technologies Group ALPHAtrackaII specification sheet.
Chelsea Technologies Photosynthetically Active Radiation (PAR) Irradiance Sensor
This sensor was originally designed to assist the study of marine photosynthesis. With the use of logarithmic amplication, the sensor covers a range of 6 orders of magnitude, which avoids setting up the sensor range for the expected signal level for different ambient conditions.
The sensor consists of a hollow PTFE 2-pi collector supported by a clear acetal dome diverting light to a filter and photodiode from which a cosine response is obtained. The sensor can be used in moorings, profiling or deployed in towed vehicles and can measure both upwelling and downwelling light.
Specifications
| Operation depth | 1000 m |
| Range | 2000 to 0.002 µE m-2 s-1 |
| Angular Detection Range | ± 130° from normal incidence |
| Relative Spectral Sensitivity | flat to ± 3% from 450 to 700 nm down 8% of 400 nm and 36% at 350 nm |
Further details can be found in the manufacturer's specification sheet.
D352 CTD Series Originator Processing
Sampling Strategy
A total of 60 CTD profiles were performed during the cruise. One cast was carried out in the Firth of Clyde, four casts in the Irish Sea and the remainder in the Celtic Sea. Data were measured at 24 Hz and logged to a PC running SEASAVE-Win32, Sea-Bird's data acquisition software. Rosette bottles were fired throughout the water column on the upcast of the CTD profiles.
Data Processing
The raw CTD files were processed through the Sea-Bird SBE Data Processing software version 7.18c. Binary (.HEX) files were converted to engineering units and ASCII format (.CNV) using the DATCNV program. A hysteresis correction of 2 seconds was made to the oxygen data.
Sea-Bird bottle files (.BTL), with information on pressure and other logged readings at the time of bottle firing, were also generated during the data conversion process.
WILDEDIT was run on pressure. The casts were checked twice and values outside the standard deviations of a preset number of scans were bad-flagged. For pass one, the preset number of scans was 2 and for pass two, it was 20. FILTER was run on the pressure channel using the recommended time filter of 0.15 s.
Sea-Bird software program ALIGN CTD was run to advance conductivity by 0 s and oxygen by 7 s (within the typical range given in the Sea-Bird manual). No adjustment was made to the temperature channel as the fast sensor response time renders this unnecessary, according to the Sea-Bird literature.
To compensate for conductivity cell thermal mass effects, the data files were run through CELLTM, using alpha = 0.03, 1/beta = 7, typical values for this CTD model given in the Sea-Bird literature. LOOP EDIT was run to identify scans which were affected by ship heave. Surface soaks were removed from the LOOPEDIT runs, with the soak depths determined from visual inspection of the data. No soak was removed from cast11a as the data record started at 2.5 dbar, remained at this depth for 40 s and then began profiling immediately.
Salinity, density (kg m-3), sigma-theta (kg m-3), oxygen saturation (%) and oxygen concentration (ml l-1 and µmol kg-1) were then calculated and added to the output files using the DERIVE program. BINAVERAGE was used to bin the data (both upcasts and downcasts) to 1 and 2 dbar bins and remove cycles flagged by LOOP EDIT.
More detailed information on the CTD processing can be found in pages 19 - 23 of the D352 cruise report.
Reformatting
The data were converted from ASCII format into MATLAB format (.MAT) by the Data Originator. Some additional parameters were added after calibrations. The following table shows which variables were imported into MATLAB:
| Sea-Bird Parameter | Units | MATLAB variable name | Units | Comments |
|---|---|---|---|---|
| timeS: Time, Elapsed | seconds | time | seconds | - |
| prDM: Pressure, Digiquartz | dbar | pressure | dbar | - |
| t090C: Temperature | ITS-90 ° C | temp1 | ITS-90 ° C | Sensor linked to CTD in rosette interior |
| t190C: Temperature, 2 | ITS-90 ° C | temp2 | ITS-90 ° C | Sensor attached to stabilisation vane on rosette exterior |
| T2-T190C: Temperature Difference, 2 - 1 | ITS-90 ° C | temp_diff | ITS-90 ° C | - |
| c0S/m: Conductivity | S m-1 | cond1 | S m-1 | Sensor linked to CTD in rosette interior |
| c1S/m: Conductivity, 2 | S m-1 | cond2 | S m-1 | Sensor attached to stabilisation vane on rosette exterior |
| C2-C1S/m: Conductivity Difference, 2 - 1 | S m-1 | cond_diff | S m-1 | - |
| sbeox0V: Oxygen Voltage, SBE 43 | volts | - | - | Data not transferred to MATLAB file as concentration and saturation derived during processing. |
| sbeox0ML/L: Oxygen, SBE 43 | ml l-1 | - | - | Data not transferred to MATLAB as source parameters were not fully adjusted when these oxygen data were generated. |
| sbeox0Mm/Kg: Oxygen, SBE 43 | µmol kg-1 | - | - | Data not transferred to MATLAB as source parameters were not fully adjusted when these oxygen data were generated. |
| sbeox0PS: Oxygen, SBE 43 | % saturation | - | - | Data not transferred to MATLAB as source parameters were not fully adjusted when these oxygen data were generated. |
| bat: Beam Attenuation, Chelsea/Seatech/Wetlab CStar | m-1 | - | - | Data not transferred to MATLAB. |
| xmiss: Beam Transmission, Chelsea/Seatech/Wetlab CStar | % | beam_transmission | % | - |
| flC: Fluorescence, Chelsea Aqua 3 Chl Con | µg l-1 | chloro | µg l-1 | - |
| sal00: Salinity | PSU | - | - | Data not transferred to MATLAB as values not adjusted during CTD processing. |
| sal11: Salinity, 2 | PSU | - | - | Data not transferred to MATLAB as values not adjusted during CTD processing. |
| density00: Density [density] | kg m-3 | - | - | Data not transferred to MATLAB as source channels not adjusted during CTD processing. |
| sigma-é00: Density [sigma-theta] | kg m-3 | - | - | Data not transferred to MATLAB as source channels not adjusted during CTD processing. |
| v4: Voltage 4 | volts | PAR_up | volts | - |
| v5: Voltage 5 | volts | PAR_down | volts | - |
| sbeox0ML/L: Oxygen, SBE 43, WS = 2 | ml l-1 | O2_con_mll | ml l-1 | This version of concentration data transferred to MATLAB as source parameters adjusted during CTD processing. |
| sbeox0PS: Oxygen, SBE 43, WS = 2 | % saturation | O2_sat | % saturation | This version of saturation data transferred to MATLAB as source parameters adjusted during CTD processing. |
| sbeox0Mm/Kg: Oxygen, SBE 43, WS = 2 | µmol kg-1 | O2_con_umolkg | µmol kg-1 | This version of concentration data transferred to MATLAB as source parameters adjusted during CTD processing. |
| sal00: Salinity | PSU | salinity1 | - | Salinity from sensors on CTD body attached to interior of rosette. These transferred to MATLAB as they were derived from source parameters adjusted during CTD processing. |
| sal11: Salinity, 2 | PSU | salinity2 | - | Salinity from sensors on stabilisation vane on rosette exterior. These data transferred to MATLAB as they were derived from source parameters adjusted during CTD processing. |
| density00: Density [density] | kg m-3 | density | kg m-3 | These density data transferred to MATLAB as they were derived from source parameters adjusted during CTD processing. The source parameters are uncalibrated versions of the data. Source parameters are from CTD on interior of rosette. |
| sigma-é00: Density [sigma-theta] | kg m-3 | sigma_theta | kg m-3 | These sigma-theta data transferred to MATLAB as they were derived from source parameters adjusted during CTD processing. The source parameters are uncalibrated versions of the data. Source parameters are from CTD on interior of rosette. |
| - | - | O2_con_mll_calib | ml l-1 | Oxygen concentration data calibrated against field samples by Originator. Description of calibration in Field Calibrations below. |
| - | - | O2_con_umolkg_calib | µmol kg-1 | Oxygen concentration data calibrated against field samples by Originator. Description of calibration in Field Calibrations below. |
| - | - | salinity1_calib | - | Salinity data from CTD on interior of rosette, calibrated against field samples by Originator. Description of calibration in Field Calibrations below. |
| - | - | salinity2_calib | - | Salinity data from sensors on external stabilisation vane, calibrated against field samples by Originator. Description of calibration in Field Calibrations below. |
| - | - | chloro_calib | µg l-1 | Chlorophyll data calibrated against field samples by Originator. Description of calibration in Field Calibrations below |
Field Calibrations
-
Salinity
107 salinity samples were collected from the CTD rosette throughout the cruise by National Marine Facilities (NMF) staff. These samples were used by the Originator to calibrate the CTD. 10 data points were excluded from the calibration dataset as they were identified as outliers (> half one standard deviation above or below the mean residuals [bottle salinity - CTD salinity]).
Calibration equations were derived for the salinity measured within the rosette interior, and on the stabilisation vane, from the mean residuals for the 97 remaining data points as follows:
Calibrated salinity for CTD within rosette interior = raw interior CTD salinity + 0.0062
Calibrated salinity for sensors on stabilisation vane = raw stabilisation vane salinity + 0.021.More information on the salinity calibration process is available on pages 27 and 28 of the cruise report.
-
Chlorophyll
Chlorophyll samples were taken from the CTD rosette bottles throughout the cruise. Two different chlorophyll calibrations were generated for the CTD fluorometer; one for the shelf edge (casts 53 - 56) and one for the Celtic Sea shelf water. Samples at all depths from pre-dawn CTD casts were used in the calibration. For casts during daylight hours, only samples from > 50 m were used.
Linear regression analysis was used to identify the relationships between the fluorometer chlorophyll readings and the bottle sample chlorophyll concentrations. The regressions resulted in the following calibrations:
For the Celtic Sea:
Calibrated chlorophyll concentration = 2.5 x CTD chlorophyll + 0.06 µg l-1
n = 98, rms error = 0.099327.For the Shelf edge:
Calibrated chlorophyll concentration = 1.3 x CTD chlorophyll + 0.03 µg l-1
n = 24, rms error = 0.038042.More information on the chlorophyll calibration process is available on pages 28 and 29 of the cruise report.
-
Oxygen
Dissolved oxygen samples were taken from the CTD rosette bottles throughout the cruise. 78 samples were used in the calibration dataset. These were compared to values taken from the Sea-Bird SBE 43 oxygen sensor linked to the CTD at the time of the bottle firings on the upcast. In order for the calibration to be carried out, the SBE 43 and bottle oxygen concentrations underwent conversions to the same units.
Upcast oxygen concentrations were measured by the SBE 43 in µmol kg-1 and ml l-1. The Data Originator chose the ml l-1 values for the calibration and converted them to µmol kg-1 using the following equation:
CTDoxy (µmol kg-1) = (44660/(sigma-theta + 1000)) * CTDoxy (ml l-1)The bottle oxygen concentrations were converted by the Data Originator from µmol l-1 to µmol kg-1 using the following equation:
bottle oxygen(µmol kg-1) = (1000 * bottle oxygen (µmol l-1) ) / (sw_dens0(salinity , botoxytemp))where
sw_dens0 = a MATLAB software routine that calculates density at atmospheric pressure using variables 'salinity' and 'botoxyptemp'
botoxytemp = the oxygen fixation temperature of the sample
salinity = the salinity recorded at the time of the bottle firing
Once the SBE 43 and bottle data were in the same units, they were compared using a linear regression. A significant relationship was found between the data, which led to a calibration based on 78 points as follows:
OXYcalib = 1.0873 * CTDoxy - 19.8039 µmol kg-1
This calibration was applied to the µmol kg-1 data transferred to MATLAB by the Data Originator. The calibrated oxygen data in ml l-1 were calculated from the calibrated oxygen data in µmol kg-1 by inverting the conversion mentioned above.
Further details on the calibration are available on pages 29 and 30 of the cruise report
D352 CTD Series: Processing undertaken by BODC
The data arrived at BODC in 120 MATLAB binary format .MAT files. The files were for 60 separate CTD casts. One set of 60 files contained profiles in 1 dbar bins and the other set of 60 files contained the profiles in 2 dbar bins. Each .MAT file contained both downcast and upcast data for an individual cast. On the recommendation of the Data Originator, BODC processed up the 1 dbar binned data and not the 2 dbar binned data.
The supplied 1 dbar casts were re-formatted to the BODC internal format using transfer function 476. During the re-formatting process, the upcast data were excluded, so the BODC files only contain downcast data.
The table below shows how the variables in the .MAT files were mapped to the appropriate BODC parameter codes. The table also provides detail on any data manipulation carried out by BODC, any derivation of variables and the reasons for any exclusion of data supplied by the Originator.
| Originator's Parameter Identifier | Units of Originator's Parameter | Description | BODC Parameter Code | Units of BODC Parameter | Comments (including any conversions/derivations done) |
|---|---|---|---|---|---|
| starttime | MMM DD YYYY hh24:mi:ss | Time that CTD started logging at beginning of cast (UTC) | - | - | Value extracted during re-formatting and stored as metadata |
| lon | degrees, minutes, seconds | Cast position longitude | - | - | Value extracted during re-formatting and stored as metadata |
| lat | degrees, minutes, seconds | Cast position latitude | - | - | Value extracted during re-formatting and stored as metadata |
| depth | m | Uncorrected depth of water column at cast location, as measured by echosounder | - | - | Value extracted during re-formatting and stored as metadata |
| time | s | Elapsed time since CTD began logging the cast | AADYAA01, AAFDZZ01 | Days | Conversion of elapsed time to date and time carried out during re-formatting |
| pressure | dbar | pressure bin | PRESPR01 | dbar | - |
| temp1 | ° C [ITS-90] | temperature from channel 1 | TEMPST01 | ° | temperature from temperature sensor on CTD mounted inside rosette |
| temp2 | ° C [ITS-90] | temperature from channel 2 | TEMPST02 | ° | temperature from CTD temperature sensor mounted on vane outside rosette |
| O2_con_mll_calib | ml l-1 | oxygen concentration calibrated against field samples | DOXYSC01 | µmol l-1 | Converted from ml l-1 to µmol l-1 by multiplication by 44.66 during re-formatting |
| salinity1_calib | - | Salinity from CTD temperature and conductivity sensors inside rosette calibrated against field samples | PSALCC01 | - | - |
| salinity2_calib | - | Salinity from CTD temperature and conductivity sensors outside rosette calibrated against field samples | PSALCC02 | - | - |
| chloro_calib | µg l-1 | chlorophyll concentration calibrated against field samples | CPHLPS01 | mg m-3 | No unit conversion as µg l-1 = mg m-3 |
| beam_transmission | % | beam transmission by a red light transmissometer | POPTSR01 | % | - |
| PAR_up | volts | upwelling irradiance in the water column | LVLTLU01 | volts | No PAR voltages supplied for CAST056* |
| PAR_down | volts | downwelling irradiance in the water column | LVLTLD01 | volts | No PAR voltages supplied for CAST056* |
| - | - | - | OXYSSC01 | % | Derived by BODC from DOXYSC01, PSALCC01 and TEMPST01 during re-formatting, following Benson and Krause (1984) |
| - | - | - | SIGTPR01 | kg m-3 | Derived by BODC from PSALCC01, PRESPR01 and TEMPST01 during re-formatting, following Fofonoff and Millard (1983) |
| - | - | - | SIGTPR02 | kg m-3 | Derived by BODC from PSALCC02, PRESPR01 and TEMPST02 during re-formatting, following Fofonoff and Millard (1983) |
| - | - | - | POTMCV01 | kg m-3 | Derived by BODC from PSALCC01, PRESPR01 and TEMPST01 during re-formatting, following Fofonoff and Millard (1983) |
| - | - | - | POTMCV02 | kg m-3 | Derived by BODC from PSALCC02, PRESPR01 and TEMPST02 during re-formatting, following Fofonoff and Millard (1983) |
| temp_diff | ° C [ITS-90] | Temperature Difference, 2 - 1 | - | - | Not included in re-formatted data as these values are not measured data |
| cond1 | S m-1 | conductivity channel 1 | - | - | Not included in re-formatted data as calibrated salinity data are also provided. BODC protocols are to accept calibrated salinity over conductivity if both supplied. |
| cond2 | S m-1 | conductivity channel 2 | - | - | Not included in re-formatted data as calibrated salinity data are also provided. BODC protocols are to accept calibrated salinity over conductivity if both supplied. |
| cond_diff | S m-1 | conductivity difference, 2 - 1 | - | - | Not included in re-formatted data as these values are not measured data |
| O2_con_mll | ml l-1 | oxygen concentration ml-1 | - | - | Not included in re-formatted data as these values are not calibrated and a calibrated version of the data are available |
| O2_con_umolkg | µmol kg-1 | oxygen concentration µmol kg-1 | - | - | Not included in re-formatted data as these values are not calibrated and a calibrated version of the data are available |
| O2_con_umolkg_calib | µmol kg-1 | calibrated oxygen concentration µmol kg-1 | - | - | Not included in re-formatted data. Converted calibrated oxygen data with original units of ml l-1 were chosen to be included in re-formatted data instead |
| O2_sat | % | oxygen saturation | - | - | Not included in re-formatted data as saturation calculations were based on un-calibrated temperature and salinity |
| salinity1 | - | un-calibrated salinity from CTD temperature and conductivity sensors inside rosette | - | - | Not included in re-formatted data as values are not calibrated and a calibrated alternative is available |
| salinity2 | - | un-calibrated salinity from CTD temperature and conductivity sensors outside rosette | - | - | Not included in re-formatted data as values are not calibrated and a calibrated alternative is available |
| density | kg m-3 | density of the water column | - | - | Not included in re-formatted data as source channels used in density calculation were not calibrated |
| sigma_theta | kg m-3 | sigma_theta of the water column | - | - | Not included in re-formatted data as source channels used in calculation of sigma-theta were not calibrated |
| chloro | µg l-1 | chlorophyll concentration | - | - | Not included in re-formatted data as values are not calibrated and a calibrated alternative is available |
| mpi | - | maximum pressure index within each data file | - | - | Not included in re-formatted data as this is not a data channel |
* The voltage values recorded for upwelling and downwelling PAR during cast 056 were zero. The Data Originator was queried as to the cause of these zero values but could provide no explanation. Therefore, for cast 056 no PAR data have been provided.
The reformatted data were visualised using the in-house EDSERPLO software. Suspect data were marked by adding any appropriate quality control flag, absent data were assigned the absent data value and flagged accordingly.
References
Benson, BB. and Krause, DK. Jr., 1984. The concentration and isotopic fractionation of oxygen dissolved in freshwater and seawater in equilibrium with the atmosphere. Limnol. Oceanogr., 29(3), 620-632
Fofonoff, NP. and Millard, RC. Jr., 1983. Algorithms for computations of fundamental properties of seawater. UNESCO Technical Papers in Marine Science No 44, 53pp.
D352 CTD Series: Processing undertaken by BODC - flushing of CTD package and data selection
The CTD processing section of the D352 cruise report highlighted that the Originator had identified problems with the quality of temperature and salinity data, with spikes present as the CTD rosette passed through the thermocline. This affected both the temperature and conductivity sensors on the external vane of the rosette package, and the sensors in the rosette interior. The Originator was of the opinion that the spiking was due to inefficient flushing of the CTD package. This is where the mass of the sensor package, combined with variations in the descent rate of the CTD, causes water to be pushed back past the sensors on the rosette and thus re-sampled.
BODC performed visual screening on the external (vane-mounted outside the rosette frame) and internal CTD (mounted inside the rosette frame) temperature, conductivity and salinity data. This was to assess the susceptibility of both sets of temperature and conductivity sensors to flushing. The screening showed that the influence of the flushing varied between internal and external sensors on a cast-by-cast basis.
In the majority of casts, there was little difference between the quality of the channels from both the internal CTD and the external sensors. Therefore, for these profiles, the channels from the internal CTD have been selected as the preferred channels, since these were used to derive oxygen values.
Casts where the external vane sensor data were preferred over the internal CTD sensors include casts 23, 25 and 30.
The preferred channels were retained in the series for banking and the non-preferred channels were dropped from the series. Note that the channels that were dropped can be made available on request.
Implications for dissolved oxygen
During cruise D352, only one oxygen instrument was available - a Sea-Bird SBE 43 Dissolved Oxygen Sensor attached to the CTD on the interior of the rosette frame. This SBE 43 used the temperature and salinity sensors attached to the main CTD body in the rosette interior as inputs for its derivation of oxygen concentration. For casts where the banked temperature and salinity were from the sensors on the exterior vane, this has the following implications:
- The oxygen data will have been generated by temperature and salinity from the main CTD in the interior of the rosette.
- The interior sensor temperature and salinity data were not stored in these circumstances.
- Therefore, the oxygen concentration does not relate to the stored environmental variables.
- Finally, as the source data used in calculation of the oxygen concentration have been identified as inferior to those in the banked data, the oxygen values in the banked data may be questionable and should be used with caution.
D352 CTD instrumentation
A Sea-Bird Electronics 911plus CTD (SBE 9 profiling instrument, 11plus deck unit) was attached to a rosette with 24 x 10 litre water sample bottles and deployed throughout the cruise.
The CTD system comprised of the following equipment: Sea-Bird 911plus CTD with dual pumped temperature and conductivity sensor pairs; a Sea-Bird SBE 43 dissolved oxygen sensor; Sea-Bird SBE 32 stainless steel carousel (s/n 32-37898-0518) with twenty-four Ocean Test Equipment (OTE), externally sprung, ten litre water bottles; transmissometer and fluorometer; upward and downward looking 2-pi PAR light sensors. The secondary pair of temperature\conductivity sensors were mounted on the stabilisation vane on the exterior of the rosette with the other pair, with the oxygen sensor, mounted conventionally onto the CTD body.
The table below lists more detailed information about the various sensors included on the CTD unit.
| Sensor | Model | Serial Number | Calibration (YYYY-MM-DD) | Comments |
|---|---|---|---|---|
| Profiling unit | SBE 09 | 09P-31240-0720 | - | - |
| Deck recording unit | SBE 11plus | 11P24680-0587 | - | - |
| Pressure transducer | Paroscientific Digiquartz 410K | 90573 | 2008-10-20 | - |
| Conductivity sensor | SBE 4C | 3272 | 2010-02-25 | Attached to CTD body |
| Conductivity sensor | SBE 4C | 3258 | 2010-03-31 | Attached to exterior stabilisation vane |
| Temperature sensor | SBE 3P | 4151 | 2010-02-27 | Attached to CTD body |
| Temperature sensor | SBE 3P | 4872 | 2010-03-31 | Attached to exterior stabilisation vane |
| Dissolved oxygen | SBE 43 | 43-1624 | 2010-04-09 | - |
| Transmissometer | Chelsea Instruments Alphatracka II | 161050 | 2005-11-07 | 660 nm wavelength, 0.1 m path length |
| Fluorometer | Chelsea Instruments Aquatracka III | 88-2050-095 | 2009-01-19 | - |
| PAR, Upwelling | Plymouth Marine Laboratory/Chelsea Instruments | 07 | 2007-10-11 | 2-pi sensor |
| PAR, Downwelling | Plymouth Marine Laboratory/Chelsea Instruments | 06 | 2007-11-26 | 2-pi sensor |
Change of sensors during cruise: None reported.
General Data Screening carried out by BODC
BODC screen both the series header qualifying information and the parameter values in the data cycles themselves.
Header information is inspected for:
- Irregularities such as unfeasible values
- Inconsistencies between related information, for example:
- Times for instrument deployment and for start/end of data series
- Length of record and the number of data cycles/cycle interval
- Parameters expected and the parameters actually present in the data cycles
- Originator's comments on meter/mooring performance and data quality
Documents are written by BODC highlighting irregularities which cannot be resolved.
Data cycles are inspected using time or depth series plots of all parameters. Currents are additionally inspected using vector scatter plots and time series plots of North and East velocity components. These presentations undergo intrinsic and extrinsic screening to detect infeasible values within the data cycles themselves and inconsistencies as seen when comparing characteristics of adjacent data sets displaced with respect to depth, position or time. Values suspected of being of non-oceanographic origin may be tagged with the BODC flag denoting suspect value; the data values will not be altered.
The following types of irregularity, each relying on visual detection in the plot, are amongst those which may be flagged as suspect:
- Spurious data at the start or end of the record.
- Obvious spikes occurring in periods free from meteorological disturbance.
- A sequence of constant values in consecutive data cycles.
If a large percentage of the data is affected by irregularities then a Problem Report will be written rather than flagging the individual suspect values. Problem Reports are also used to highlight irregularities seen in the graphical data presentations.
Inconsistencies between the characteristics of the data set and those of its neighbours are sought and, where necessary, documented. This covers inconsistencies such as the following:
- Maximum and minimum values of parameters (spikes excluded).
- The occurrence of meteorological events.
This intrinsic and extrinsic screening of the parameter values seeks to confirm the qualifying information and the source laboratory's comments on the series. In screening and collating information, every care is taken to ensure that errors of BODC making are not introduced.
Project Information
NERC Responsive Mode Project: A Thermocline Nutrient Pump
Project Partners and Duration
NERC Responsive Mode research project NE/F002432/1 ("A Thermocline Nutrient Pump") was jointly awarded to Bangor University (Principal Investigator: Dr. Tom Rippeth) and the Proudman Oceanographic Laboratory [since April 2010, part of the National Oceanography Centre] (Principal Scientist: Prof. Jonathan Sharples, since January 2010 based at the University of Liverpool). The project runs from 2008 to 2013.
Background
The seasonal thermocline in temperate shelf seas acts as a critical interface in the shelf sea system. It is a physical barrier to vertical exchange, controlling biological growth through the summer and enabling the sequestration of atmospheric CO2.
Once the spring bloom is over, the seasonal thermocline separates the sun drenched but nutrient depleted surface waters from the dark nutrient rich deep water. The vertical mixing of nutrients across the seasonal thermocline acts to couple this well-lit surface zone with the deep water nutrient supply, leading to the formation of a layer of phytoplankton within the thermocline (the subsurface chlorophyll maxima). This phenomenon is estimated to account for about half of the annual carbon fixation in seasonally stratified shelf seas, and yet the controlling physics is only just being unravelled. The identification and parameterisation of the physical processes which are responsible for the vertical mixing of nutrients across the thermocline is a vital prerequisite to the understanding of shelf sea ecosystems.
Project Aim
This project aim is to investigate the role of wind driven inertial oscillations in driving vertical mixing across the seasonal thermocline, identifying the mechanisms and processes responsible for their generation and dissipation on both special and temporal scales. This is to be achieved through an observational campaign closely integrated with numerical model predictions using both 1D and 3D numerical models.
Specific Hypotheses to be tested:
-
A significant fraction of the total turbulent mixing at the thermocline is the result of episodic spikes in inertial shear.
-
Inertial shear events are sensitive to local stratification and tidal conditions.
-
Inertial mixing events have significant horizontal variability.
Project Objectives
1. Acquisition of long time series of well-resolved current and temperature profiles to quantify the episodic nature of the shear events and investigate their relationship with surface winds, tides and stratification. This objective contributes to testing of Hypothesis 1.
2. Investigate spatial variability of the generation/dissipation of inertial shear events caused by horizontal variations in wind forcing, tidal characteristics and horizontal patchiness in density structure. This contributes to testing of Hypothesis 2.
3. Determination of the spatial connectivity of inertial shear events as a mechanism for non-local generation, transfer and dissipation of intertial energy. This contributes to testing of Hypotheses 2 and 3.
4. Determination of consistent discrepancies between modelled sequences of intertial events and direct observations and identification of possible causes. This will identify deficiencies in the current modelling physics.
5. Investigate the link between inertial mixing and vertical nitrate fluxes into the thermocline and the consequences of incorrect modelling of the episodic nature of this mixing process.
Fieldwork Schedule
| Cruise | Location | Dates | Main Activities |
|---|---|---|---|
| RV Prince Madog cruise PD20_09 | Western Irish Sea | 2009-05-18 to 2009-05-22 |
|
| RV Prince Madog cruise PD27_09 | Western Irish Sea | 2009-07-06 to 2009-07-10 |
|
| RV Prince Madog cruise (ID not available at this time) | Western Irish Sea | May 2010 (exact dates not available at present) |
|
| RRS Discovery cruise D352 | Firth of Clyde, Irish Sea and Celtic Sea | 2010-06-02 to 2010-06-26 |
|
| RV Prince Madog cruise (ID not available at this time) | Western Irish Sea | July 2010 (exact dates not available at present) |
|
| RV Prince Madog cruise (ID not available at this time) | Western Irish Sea | September 2010 (exact dates not available at present) |
|
Key:
VMP: Vertical Microstructure Profiler
CTD: Conductivity, temperature and depth sensor
ADCP: Acoustic Doppler Current Profiler
SAPS: Stand-alone Pump Sampling
VMADCP: Vessel Mounted ADCP
LADCP: Lowered ADCP
RAS: Remote Access Sampler
Data Activity or Cruise Information
Cruise
| Cruise Name | D352 |
| Departure Date | 2010-06-02 |
| Arrival Date | 2010-06-26 |
| Principal Scientist(s) | Jonathan Sharples (National Oceanography Centre, Liverpool) |
| Ship | RRS Discovery |
Complete Cruise Metadata Report is available here
Fixed Station Information
Fixed Station Information
| Station Name | IM1 Fixed Station for Project 'A Thermocline Nutrient Pump' |
| Category | Offshore area |
| Latitude | 49° 25.66' N |
| Longitude | 8° 59.78' W |
| Water depth below MSL | 135.0 m |
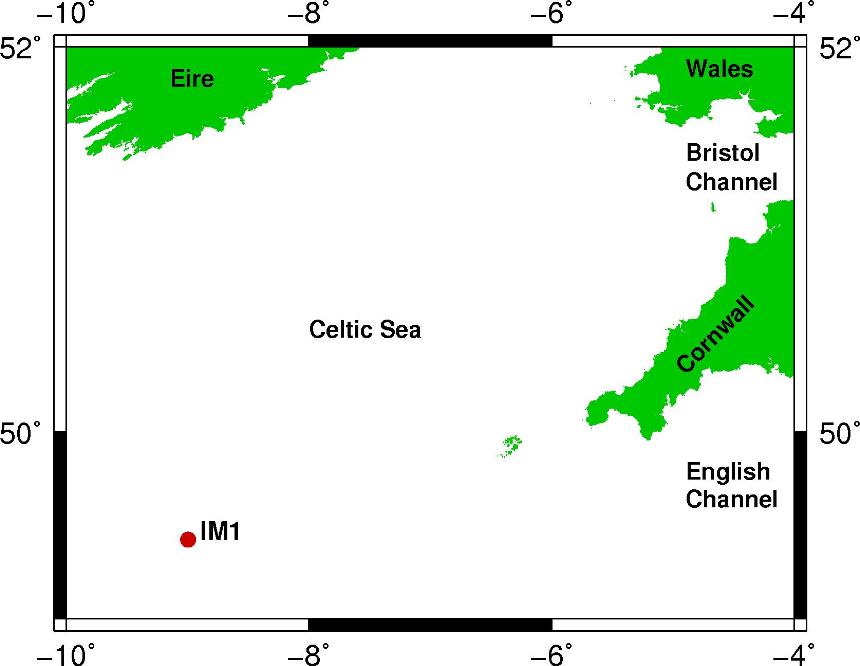
A thermocline nutrient pump: station IM1
Station IM1 is located in the Celtic Sea. It is a box, 6 km on each side, centred at 49.42758° N, 08.99642° W with a mean water depth of 135 m. This station was visited as part of the fieldwork carried out for research programme 'A thermocline nutrient pump'. Activities were carried out at site IM1 during cruiseD352 from 04 to 19 June 2010. The centre position is visible below, with the coordinates of the corners visible in the following table.
| Corner | Latitude (decimal ° (+N)) | Longitude (decimal ° (+E)) |
|---|---|---|
| North-western corner | 49.45517 | -9.037 |
| South-western corner | 49.4 | -9.037 |
| North-eastern corner | 49.45517 | -8.95583 |
| South-eastern corner | 49.4 | -8.95583 |
Location of station IM1
Sampling history for IM1
| Activities | Dates (YYYY-MM-DD) | Comments |
|---|---|---|
| CTD casts | 2010-06-04 (cast CTD005) 2010-06-05 (cast CTD006) 2010-06-06 (casts CTD007 - CTD011) 2010-06-07 (casts CTD012 - CTD014) 2010-06-08 (casts CTD015 and CTD016) 2010-06-09 (casts CTD017 - CTD019) 2010-06-10 (casts CTD020 - CTD023) 2010-06-11 (casts CTD024 and CTD025) 2010-06-12 (casts CTD026 - CTD028) 2010-06-16 (casts CTD038 and CTD039) 2010-06-17 (cast CTD046) 2010-06-18 (cast CTD047) 2010-06-19 (casts CTD048 and CTD049) | Beam transmission calibration is suspect so beam transmission data should be used for qualitative purposes only |
| ADCP lander | Lander deployed on 2010-06-04 Lander recovered on 2010-06-19 | - |
| Sub-surface ADCP | Deployed on 2010-06-05 Instrument swapped over on 2010-06-09 Recovery on 2010-06-19 | - |
| VMP | Bangor University School of Ocean Sciences unit deployed throughout following dates: 2010-06-06 to 2010-06-08 2010-06-09 to 2010-06-10 National Oceanography Centre (NOC) VMP unit deployed throughout following dates: 2010-06-11 to 2010-06-12 | Bangor University VMP failed on 2010-06-10 NOC VMP failed after 2010-06-12 due to housing failure on deployment off-station |
| SAPS, grabs and bongo nets | Sampling carried out on 2010-06-05 and 2010-06-09 | - |
| Pump sampling | 2010-06-17 | Sample hose returned to vessel during sampling, allowing sample collection at every metre from 50 m to surface |
Related Fixed Station activities are detailed in Appendix 1
BODC Quality Control Flags
The following single character qualifying flags may be associated with one or more individual parameters with a data cycle:
| Flag | Description |
|---|---|
| Blank | Unqualified |
| < | Below detection limit |
| > | In excess of quoted value |
| A | Taxonomic flag for affinis (aff.) |
| B | Beginning of CTD Down/Up Cast |
| C | Taxonomic flag for confer (cf.) |
| D | Thermometric depth |
| E | End of CTD Down/Up Cast |
| G | Non-taxonomic biological characteristic uncertainty |
| H | Extrapolated value |
| I | Taxonomic flag for single species (sp.) |
| K | Improbable value - unknown quality control source |
| L | Improbable value - originator's quality control |
| M | Improbable value - BODC quality control |
| N | Null value |
| O | Improbable value - user quality control |
| P | Trace/calm |
| Q | Indeterminate |
| R | Replacement value |
| S | Estimated value |
| T | Interpolated value |
| U | Uncalibrated |
| W | Control value |
| X | Excessive difference |
SeaDataNet Quality Control Flags
The following single character qualifying flags may be associated with one or more individual parameters with a data cycle:
| Flag | Description |
|---|---|
| 0 | no quality control |
| 1 | good value |
| 2 | probably good value |
| 3 | probably bad value |
| 4 | bad value |
| 5 | changed value |
| 6 | value below detection |
| 7 | value in excess |
| 8 | interpolated value |
| 9 | missing value |
| A | value phenomenon uncertain |
| B | nominal value |
| Q | value below limit of quantification |
Appendix 1: IM1 Fixed Station for Project 'A Thermocline Nutrient Pump'
Related series for this Fixed Station are presented in the table below. Further information can be found by following the appropriate links.
If you are interested in these series, please be aware we offer a multiple file download service. Should your credentials be insufficient for automatic download, the service also offers a referral to our Enquiries Officer who may be able to negotiate access.
| Series Identifier | Data Category | Start date/time | Start position | Cruise |
|---|---|---|---|---|
| 1079479 | CTD or STD cast | 2010-06-04 16:40:45 | 49.42633 N, 8.9745 W | RRS Discovery D352 |
| 1079480 | CTD or STD cast | 2010-06-05 02:46:13 | 49.4185 N, 8.99117 W | RRS Discovery D352 |
| 1079492 | CTD or STD cast | 2010-06-06 02:44:13 | 49.41867 N, 8.96933 W | RRS Discovery D352 |
| 1079511 | CTD or STD cast | 2010-06-06 04:46:25 | 49.4045 N, 8.986 W | RRS Discovery D352 |
| 1079523 | CTD or STD cast | 2010-06-06 06:23:40 | 49.4 N, 9.00567 W | RRS Discovery D352 |
| 1079535 | CTD or STD cast | 2010-06-06 08:52:23 | 49.41167 N, 9.00717 W | RRS Discovery D352 |
| 1079547 | CTD or STD cast | 2010-06-06 09:48:12 | 49.41667 N, 9.0105 W | RRS Discovery D352 |
| 1079559 | CTD or STD cast | 2010-06-06 09:59:11 | 49.41817 N, 9.01117 W | RRS Discovery D352 |
| 1079560 | CTD or STD cast | 2010-06-07 05:01:27 | 49.45517 N, 8.974 W | RRS Discovery D352 |
| 1079584 | CTD or STD cast | 2010-06-07 22:26:17 | 49.439 N, 8.9785 W | RRS Discovery D352 |
| 1079596 | CTD or STD cast | 2010-06-08 04:18:29 | 49.44667 N, 8.96917 W | RRS Discovery D352 |
| 1079603 | CTD or STD cast | 2010-06-08 20:37:57 | 49.40833 N, 9.00683 W | RRS Discovery D352 |
| 1079615 | CTD or STD cast | 2010-06-09 02:44:52 | 49.42583 N, 8.9955 W | RRS Discovery D352 |
| 1079627 | CTD or STD cast | 2010-06-09 11:35:44 | 49.41783 N, 8.99533 W | RRS Discovery D352 |
| 1079639 | CTD or STD cast | 2010-06-09 16:00:17 | 49.42617 N, 9.00533 W | RRS Discovery D352 |
| 1079640 | CTD or STD cast | 2010-06-10 01:15:19 | 49.407 N, 8.98767 W | RRS Discovery D352 |
| 1079652 | CTD or STD cast | 2010-06-10 04:29:31 | 49.43417 N, 8.95583 W | RRS Discovery D352 |
| 1079664 | CTD or STD cast | 2010-06-10 12:21:11 | 49.4305 N, 8.99467 W | RRS Discovery D352 |
| 1079676 | CTD or STD cast | 2010-06-10 22:12:21 | 49.4255 N, 9.01467 W | RRS Discovery D352 |
| 1079688 | CTD or STD cast | 2010-06-11 10:03:49 | 49.41067 N, 8.97217 W | RRS Discovery D352 |
| 1079707 | CTD or STD cast | 2010-06-11 20:11:03 | 49.43133 N, 9.00067 W | RRS Discovery D352 |
| 1079719 | CTD or STD cast | 2010-06-12 02:33:01 | 49.40983 N, 8.98583 W | RRS Discovery D352 |
| 1079720 | CTD or STD cast | 2010-06-12 04:35:11 | 49.41517 N, 8.964 W | RRS Discovery D352 |
| 1079732 | CTD or STD cast | 2010-06-12 06:03:10 | 49.4055 N, 8.96033 W | RRS Discovery D352 |
| 1079848 | CTD or STD cast | 2010-06-16 02:33:31 | 49.412 N, 8.99933 W | RRS Discovery D352 |
| 1079861 | CTD or STD cast | 2010-06-16 04:29:32 | 49.433 N, 9.03433 W | RRS Discovery D352 |
| 1079941 | CTD or STD cast | 2010-06-17 04:01:01 | 49.41933 N, 9.00817 W | RRS Discovery D352 |
| 1079953 | CTD or STD cast | 2010-06-18 07:02:24 | 49.42533 N, 9.00867 W | RRS Discovery D352 |
| 1079965 | CTD or STD cast | 2010-06-19 05:06:25 | 49.42217 N, 9.0115 W | RRS Discovery D352 |
| 1079977 | CTD or STD cast | 2010-06-19 06:38:59 | 49.43417 N, 9.037 W | RRS Discovery D352 |
