Metadata Report for BODC Series Reference Number 1107323
Metadata Summary
Problem Reports
Data Access Policy
Narrative Documents
Project Information
Data Activity or Cruise Information
Fixed Station Information
BODC Quality Flags
SeaDataNet Quality Flags
Metadata Summary
Data Description |
|||||||||||||||||||||||||||||||||||||||||||||
|
|||||||||||||||||||||||||||||||||||||||||||||
Data Identifiers |
|||||||||||||||||||||||||||||||||||||||||||||
|
|||||||||||||||||||||||||||||||||||||||||||||
Time Co-ordinates(UT) |
|||||||||||||||||||||||||||||||||||||||||||||
|
|||||||||||||||||||||||||||||||||||||||||||||
Spatial Co-ordinates | |||||||||||||||||||||||||||||||||||||||||||||
|
|||||||||||||||||||||||||||||||||||||||||||||
Parameters |
|||||||||||||||||||||||||||||||||||||||||||||
|
|||||||||||||||||||||||||||||||||||||||||||||
|
|||||||||||||||||||||||||||||||||||||||||||||
Problem Reports
No Problem Report Found in the Database
Data quality comments for JR98
Surface soak
The surface soak has been included in the binned data in the casts mentioned below. This is an issue which especially affects the salinity and oxygen channels, as well as any parameters that are derived from these. For salinity, oxygen and their derived parameters the top 10-15 m of the downcast have been flagged in most casts which are affected by this issue (the salinity channel for casts 129, 130 and 132 did not show substantial deviation and thus was not flagged).
Casts which have had the surface soak included in the binned data:
- Cast 001
- Cast 025
- Cast 085
- Cast 125
- Cast 129
- Cast 130
- Cast 131
- Cast 132
- Cast 133
- Cast 159
Temperature and salinity
The data originator performed a quality check on the data, by comparing the RMS difference between primary and secondary salinity measurements for each downcast. Most casts showed an RMS difference of < 0.01. Casts 025, 048, 107, 125, 133 and 139 showed RMS differences between 0.01 and 0.02. For these casts the errors associated with salinity measurements will be at worst ± 0.02. Casts 002, 085 and 159 showed RMS differences > 0.05 and the data originator recommended these should be regarded as unreliable. The errors for cast 002 and cast 085 were caused by discrepancies between the two conductivity sensors, while for cast 159 the discrepancy was between the temperature sensors. It is not known which sensor was responsible for these discrepancies, and which was providing correct measurements.
The salinity profile for the downcast of cast 002 is irregular with values that are much higher than those experienced in either the upcast or in subsequent casts at the same location. BODC recommend therefore that all data from cast 002 for the following channels be treated with caution:
- Salinity
- Dissolved oxygen concentration
- Dissolved oxygen saturation
- Sigma-theta
- Potential temperature
Other comments
- During casts 037, 041 and 043 there was lots of noise observed as the CTD moved through the thermocline. This problem affects all variables for these casts
- The downcast for cast 048 was much shallower than the other casts at this station, and there was only an upcast record of approximately ten metres.
- All chlorophyll bins for the profiles which were taken using the CTD mounted on the titanium frame (casts 125-133 and 159) have been flagged, as the wrong calibration has been applied. For more information see the chlorophyll section of the originator's processing document.
Data Access Policy
Open Data
These data have no specific confidentiality restrictions for users. However, users must acknowledge data sources as it is not ethical to publish data without proper attribution. Any publication or other output resulting from usage of the data should include an acknowledgment.
If the Information Provider does not provide a specific attribution statement, or if you are using Information from several Information Providers and multiple attributions are not practical in your product or application, you may consider using the following:
"Contains public sector information licensed under the Open Government Licence v1.0."
Narrative Documents
Sea-Bird Dissolved Oxygen Sensor SBE 43 and SBE 43F
The SBE 43 is a dissolved oxygen sensor designed for marine applications. It incorporates a high-performance Clark polarographic membrane with a pump that continuously plumbs water through it, preventing algal growth and the development of anoxic conditions when the sensor is taking measurements.
Two configurations are available: SBE 43 produces a voltage output and can be incorporated with any Sea-Bird CTD that accepts input from a 0-5 volt auxiliary sensor, while the SBE 43F produces a frequency output and can be integrated with an SBE 52-MP (Moored Profiler CTD) or used for OEM applications. The specifications below are common to both.
Specifications
| Housing | Plastic or titanium |
| Membrane | 0.5 mil- fast response, typical for profile applications 1 mil- slower response, typical for moored applications |
| Depth rating | 600 m (plastic) or 7000 m (titanium) 10500 m titanium housing available on request |
| Measurement range | 120% of surface saturation |
| Initial accuracy | 2% of saturation |
| Typical stability | 0.5% per 1000 h |
Further details can be found in the manufacturer's specification sheet.
Instrument description for JR98 stainless steel CTD
CTD Unit and Auxiliary Sensors
The CTD mounted on a 24 bottle stainless steel rosette, comprised of a Sea-Bird Electronics 9plus system, with accompanying Sea-Bird Electronics 11plus deck unit. This unit was deployed for casts 1-124, 134-158 and 160-172. The CTD frame was fitted with a digiquartz pressure sensor, two temperature sensors, two conductivity sensors, one dissolved oxygen sensor, one chlorophyll fluorometer (Chelsea Instruments AQUAtracka MKIII) and one transmissometer (Chelsea MKII Alphatracka). For the first 30 casts there was also a Sea-tech LS6000 backscatter sensor attached to the CTD, which was replaced by a SUV-6 nitrate spectrophotometer for casts 31 onwards.
In addition to the sensors mentioned previously, there were also two Chelsea Instrument FastTracka FRRFs with PAR sensors and one LISST 100C laser diffraction in situ particle size analyser attached to the CTD frame. These were stand-alone instruments, powered by their own batteries, which recorded their data internally. This means that their data are not available in the CTD data files and their specifications have not been included in the table below.
| |||||||||||||||||||||||||||||||||||||||||||||||||||||||||||||||||||||||||
Sea-Bird Electronics SBE 911 and SBE 917 series CTD profilers
The SBE 911 and SBE 917 series of conductivity-temperature-depth (CTD) units are used to collect hydrographic profiles, including temperature, conductivity and pressure as standard. Each profiler consists of an underwater unit and deck unit or SEARAM. Auxiliary sensors, such as fluorometers, dissolved oxygen sensors and transmissometers, and carousel water samplers are commonly added to the underwater unit.
Underwater unit
The CTD underwater unit (SBE 9 or SBE 9 plus) comprises a protective cage (usually with a carousel water sampler), including a main pressure housing containing power supplies, acquisition electronics, telemetry circuitry, and a suite of modular sensors. The original SBE 9 incorporated Sea-Bird's standard modular SBE 3 temperature sensor and SBE 4 conductivity sensor, and a Paroscientific Digiquartz pressure sensor. The conductivity cell was connected to a pump-fed plastic tubing circuit that could include auxiliary sensors. Each SBE 9 unit was custom built to individual specification. The SBE 9 was replaced in 1997 by an off-the-shelf version, termed the SBE 9 plus, that incorporated the SBE 3 plus (or SBE 3P) temperature sensor, SBE 4C conductivity sensor and a Paroscientific Digiquartz pressure sensor. Sensors could be connected to a pump-fed plastic tubing circuit or stand-alone.
Temperature, conductivity and pressure sensors
The conductivity, temperature, and pressure sensors supplied with Sea-Bird CTD systems have outputs in the form of variable frequencies, which are measured using high-speed parallel counters. The resulting count totals are converted to numeric representations of the original frequencies, which bear a direct relationship to temperature, conductivity or pressure. Sampling frequencies for these sensors are typically set at 24 Hz.
The temperature sensing element is a glass-coated thermistor bead, pressure-protected inside a stainless steel tube, while the conductivity sensing element is a cylindrical, flow-through, borosilicate glass cell with three internal platinum electrodes. Thermistor resistance or conductivity cell resistance, respectively, is the controlling element in an optimized Wien Bridge oscillator circuit, which produces a frequency output that can be converted to a temperature or conductivity reading. These sensors are available with depth ratings of 6800 m (aluminium housing) or 10500 m (titanium housing). The Paroscientific Digiquartz pressure sensor comprises a quartz crystal resonator that responds to pressure-induced stress, and temperature is measured for thermal compensation of the calculated pressure.
Additional sensors
Optional sensors for dissolved oxygen, pH, light transmission, fluorescence and others do not require the very high levels of resolution needed in the primary CTD channels, nor do these sensors generally offer variable frequency outputs. Accordingly, signals from the auxiliary sensors are acquired using a conventional voltage-input multiplexed A/D converter (optional). Some Sea-Bird CTDs use a strain gauge pressure sensor (Senso-Metrics) in which case their pressure output data is in the same form as that from the auxiliary sensors as described above.
Deck unit or SEARAM
Each underwater unit is connected to a power supply and data logging system: the SBE 11 (or SBE 11 plus) deck unit allows real-time interfacing between the deck and the underwater unit via a conductive wire, while the submersible SBE 17 (or SBE 17 plus) SEARAM plugs directly into the underwater unit and data are downloaded on recovery of the CTD. The combination of SBE 9 and SBE 17 or SBE 11 are termed SBE 917 or SBE 911, respectively, while the combinations of SBE 9 plus and SBE 17 plus or SBE 11 plus are termed SBE 917 plus or SBE 911 plus.
Specifications
Specifications for the SBE 9 plus underwater unit are listed below:
| Parameter | Range | Initial accuracy | Resolution at 24 Hz | Response time |
|---|---|---|---|---|
| Temperature | -5 to 35°C | 0.001°C | 0.0002°C | 0.065 sec |
| Conductivity | 0 to 7 S m-1 | 0.0003 S m-1 | 0.00004 S m-1 | 0.065 sec (pumped) |
| Pressure | 0 to full scale (1400, 2000, 4200, 6800 or 10500 m) | 0.015% of full scale | 0.001% of full scale | 0.015 sec |
Further details can be found in the manufacturer's specification sheet.
Chelsea Technologies Group Aquatracka MKIII fluorometer
The Chelsea Technologies Group Aquatracka MKIII is a logarithmic response fluorometer. Filters are available to enable the instrument to measure chlorophyll, rhodamine, fluorescein and turbidity.
It uses a pulsed (5.5 Hz) xenon light source discharging along two signal paths to eliminate variations in the flashlamp intensity. The reference path measures the intensity of the light source whilst the signal path measures the intensity of the light emitted from the specimen under test. The reference signal and the emitted light signals are then applied to a ratiometric circuit. In this circuit, the ratio of returned signal to reference signal is computed and scaled logarithmically to achieve a wide dynamic range. The logarithmic conversion accuracy is maintained at better than one percent of the reading over the full output range of the instrument.
Two variants of the instrument are available, both manufactured in titanium, capable of operating in depths from shallow water down to 2000 m and 6000 m respectively. The optical characteristics of the instrument in its different detection modes are visible below:
| Excitation | Chlorophyll a | Rhodamine | Fluorescein | Turbidity |
|---|---|---|---|---|
| Wavelength (nm) | 430 | 500 | 485 | 440* |
| Bandwidth (nm) | 105 | 70 | 22 | 80* |
| Emission | Chlorophyll a | Rhodamine | Fluorescein | Turbidity |
| Wavelength (nm) | 685 | 590 | 530 | 440* |
| Bandwidth (nm) | 30 | 45 | 30 | 80* |
* The wavelengths for the turbidity filters are customer selectable but must be in the range 400 to 700 nm. The same wavelength is used in the excitation path and the emission path.
The instrument measures chlorophyll a, rhodamine and fluorescein with a concentration range of 0.01 µg l-1 to 100 µg l-1. The concentration range for turbidity is 0.01 to 100 FTU (other wavelengths are available on request).
The instrument accuracy is ± 0.02 µg l-1 (or ± 3% of the reading, whichever is greater) for chlorophyll a, rhodamine and fluorescein. The accuracy for turbidity, over a 0 - 10 FTU range, is ± 0.02 FTU (or ± 3% of the reading, whichever is greater).
Further details are available from the Aquatracka MKIII specification sheet.
Chelsea Technologies Group ALPHAtracka and ALPHAtracka II transmissometers
The Chelsea Technologies Group ALPHAtracka (the Mark I) and its successor, the ALPHAtracka II (the Mark II), are both accurate (< 0.3 % fullscale) transmissometers that measure the beam attenuation coefficient at 660 nm. Green (565 nm), yellow (590 nm) and blue (470 nm) wavelength variants are available on special order.
The instrument consists of a Transmitter/Reference Assembly and a Detector Assembly aligned and spaced apart by an open support frame. The housing and frame are both manufactured in titanium and are pressure rated to 6000 m depth.
The Transmitter/Reference housing is sealed by an end cap. Inside the housing an LED light source emits a collimated beam through a sealed window. The Detector housing is also sealed by an end cap. A signal photodiode is placed behind a sealed window to receive the collimated beam from the Transmitter.
The primary difference between the ALPHAtracka and ALPHAtracka II is that the Alphatracka II is implemented with surface-mount technology; this has enabled a much smaller diameter pressure housing to be used while retaining exactly the same optical train as in the Mark I. Data from the Mark II version are thus fully compatible with that already obtained with the Mark I. The performance of the Mark II is further enhanced by two electronic developments from Chelsea Technologies Group - firstly, all items are locked in a signal nulling loop of near infinite gain and, secondly, the signal output linearity is inherently defined by digital circuitry only.
Among other advantages noted above, these features ensure that the optical intensity of the Mark II, indicated by the output voltage, is accurately represented by a straight line interpolation between a reading near full-scale under known conditions and a zero reading when blanked off.
For optimum measurements in a wide range of environmental conditions, the Mark I and Mark II are available in 5 cm, 10 cm and 25 cm path length versions. Output is default factory set to 2.5 volts but can be adjusted to 5 volts on request.
Further details about the Mark II instrument are available from the Chelsea Technologies Group ALPHAtrackaII specification sheet.
Originator's data processing for JR98 CTD casts
Sampling strategy
A total of 172 CTD casts were performed during RRS James Clark Ross (JR) cruise JR98, which took place from July 25th to August 14th 2003, around the Celtic Sea (for more information, see the JR 98 cruise report). Casts 001-124 were performed using a CTD mounted on a stainless steel frame with a rosette of 24 ten litre water bottles. Casts 125-133 and 159 were performed using a CTD mounted on a titanium frame with a rosette of 24 ten litre Teflon coated water bottles. Cast 159 was used to collect a full set of salinity samples for the calibration of the titanium frame CTD. Cast 123 was abandoned as the rosette was not responding, while cast 172 was a fixed depth time series.
Water bottle samples were collected at depths of between two and 200 m in order to calibrate dissolved oxygen, chlorophyll and salinity measurements made by the CTDs. Bottle samples were taken and analysed for nitrates and compared to the SUV-6 nitrate spectrophotometer. Further water samples taken were taken to measure primary production by the Universidad de Vigo and algal photophysiology by the University of Essex. The Southampton Oceanography Centre (known as the National Oceanography Centre, Southampton, since 2005) used water samples to analyse photosynthesis irradiance response, ammonium concentration, phytoplankton production and dissolved iron and trace metal concentrations. A titanium frame CTD was intended to be used to collect samples for the iron analysis, in order to minimise potential contamination. However, due to problems with the titanium rosette, approximately half the samples were collected using the stainless steel unit.
Data Processing
The raw CTD files were processed through the Sea-Bird Electronics SeaSoft data processing software (version 5.26f). The binary (.DAT) files were converted to engineering units and ASCII (.CNV) files using the DATCNV program. The originator then split the data into upcast and downcast files and averaged the data into 0.5 m vertical bins. Before the data were binned spikes present in the pressure, fluorescence, transmittance, and salinity data were removed (i.e. the whole CTD data line with the spike was removed). Casts 123 and 172 were not provided as binned data files, as cast 123 was aborted and cast 172 was a fixed depth time series. Prior to sending the binned CTD data to BODC the data originator removed all data points recorded while the CTD was sat at the surface or undergoing a surface soak and applied the relevant calibrations to chlorophyll, salinity and depth.
The following table describes how the variables in the binned data relate to the variables present in the raw data file header:
Field CalibrationsCalibrations for pressure, salinity and chlorophyll have been applied to the processed CTD data by the data originator. The calibration equation for dissolved oxygen was calculated by the data originator, but was applied during BODC processing. The chlorophyll calibration equation was calculated using water samples taken from the stainless steel frame CTD. Be aware that the same calibration equation was also applied to fluorometer readings from the titanium frame CTD, so these data should be regarded as uncalibrated. PressureThe pressure sensors on the two CTDs were calibrated for the offset associated with changes in atmospheric pressure. The offset was calculated for each cast by using the average depth recorded by the CTD for a period of 10 seconds prior to being lowered into the sea.SalinitySalinity calculated from the two temperature and conductivity sensors was calibrated against water bottle samples for both the stainless steel and titanium frame CTDs by the data originator. The bottle samples were analysed at the Southampton Oceanography Centre relative to standard seawater. The number of bottle samples taken for calibration purposes were limited because of a lack of bottle seals aboard the RRS James Clark Ross. This reduced the accuracy of the calibrated salinities, however the data originator believes that it is still adequate. Calibration of the two salinity measurements was calculated by the data originator as a simple mean offset between bottle and corresponding CTD salinities. The standard deviation of this mean offset provides the error in salinity measurements from the CTDs. For the CTD mounted on the stainless steel frame: Calibrated salinity (primary sensor) = (CTD (primary) salinity - 0.002) ± 0.004 Calibrated salinity (secondary sensor) = (CTD (secondary) salinity + 0.006) ± 0.005 For the CTD on the titanium frame (casts 125 - 133 inclusive and 159): Calibrated salinity (primary sensor) = (CTD (primary) salinity - 0.004) ± 0.003 Calibrated salinity (secondary sensor) = (CTD (secondary) salinity - 0.003) ± 0.005 ChlorophyllInitially, a calibration equation was calculated by conducting a laboratory fluorometric analysis, using filtered water samples taken from niskin bottles. This analysis was used to calculate the fluorometric calibration equations provided below. The relationship observed between chlorophyll concentration and CTD fluorescence was found to be significantly different at the shelf edge compared to sites located on the open shelf. Therefore, two separate calibration equations were calculated, one for stations at the shelf edge and one for stations away from the shelf edge. Fluorometric calibration equations: Calibrated chlorophyll concentration = 3.15 x CTD chl concentration (mg m-3) - away from shelf edge. R2 = 0.82, n =367, p <0.001. Calibrated chlorophyll concentration = 1.24 x CTD chl conc. (mg m-3) - stations at shelf edge, CTD casts 002 - 030 and 170 - 172 inclusive. R2 = 0.65, n =78, p <0.001 The data originator then obtained chlorophyll concentrations using High-Performance Liquid Chromatography (HPLC) analysis and the results were compared with the fluorometric analysis. This found a relationship of HPLC derived chl = 0.77 x fluorometric analysis derived chl (R2 = 0.90 p <0.001). The initial calibration equations were then revised using this offset, to provide chlorophyll calibrations compatible with the HPLC analysis. The revised and final calibration equations are provided below: Revised calibration equations: Calibrated chlorophyll concentration = 2.43 x CTD chl concentration (mg m-3) - away from shelf edge. Calibrated chlorophyll concentration = 0.95 x CTD chl conc. (mg m-3) - stations at shelf edge, CTD casts 002 - 030 and 170 - 172 inclusive. The revised calibration equations were then applied to the raw CTD fluorometer data by the data originator. Chlorophyll samples for calibration were only taken using the CTD mounted on the stainless steel frame. However, the same calibration has been applied to raw CTD fluorometer data taken using both CTD units. Therefore, the chlorophyll data for casts performed using the CTD mounted on the titanium frame should be regarded as uncalibrated. Dissolved oxygenThe calibration equation for dissolved oxygen was calculated using water samples taken during CTD casts 34, 46, 124, 139, 145, and 171. The originator performed a linear regression, comparing CTD dissolved oxygen against bottle dissolved oxygen. The calibration was derived from the regression as follows, based on 106 observations: Calibrated dissolved oxygen = 1.112 x CTD dissolved oxygen + 0.072 ± 0.08 mg l-1 (R2 = 0.975) This calibration equation was then applied to the uncalibrated data by BODC. According to the data originator replicated bottle samples showed errors less than 0.5%, so the error in CTD dissolved oxygen measurements was dominated by sensor error. The calibration was stable, showing very little drift during the cruise (Bottle/CTD dissolved oxygen = -0.00015 x sample number + 1.13188). R2 = 0.155 | ||||||||||||||||||||||||||||||||||||||||||||||||||||||||||||||||||||||||||||||||||||||||||||||||
Processing of JR98 CTD data by BODC
BODC received 0.5 m binned downcast and upcast files for 170 CTD casts from the data originator (see Originator's Data Processing for JR98 CTD casts for further information). Following standard BODC procedure, the downcast files were chosen for processing and reformatted to BODC internal format using transfer function 479. The table below shows how the variables within the processed data files were mapped to appropriate BODC parameter codes.
Variables common to all casts
Additional variables only related to casts 1-30
| |||||||||||||||||||||||||||||||||||||||||||||||||||||||||||||||||||||||||||||||||||||||||||||||||||||||||||||||||||||||||||||||||||||||||||
General Data Screening carried out by BODC
BODC screen both the series header qualifying information and the parameter values in the data cycles themselves.
Header information is inspected for:
- Irregularities such as unfeasible values
- Inconsistencies between related information, for example:
- Times for instrument deployment and for start/end of data series
- Length of record and the number of data cycles/cycle interval
- Parameters expected and the parameters actually present in the data cycles
- Originator's comments on meter/mooring performance and data quality
Documents are written by BODC highlighting irregularities which cannot be resolved.
Data cycles are inspected using time or depth series plots of all parameters. Currents are additionally inspected using vector scatter plots and time series plots of North and East velocity components. These presentations undergo intrinsic and extrinsic screening to detect infeasible values within the data cycles themselves and inconsistencies as seen when comparing characteristics of adjacent data sets displaced with respect to depth, position or time. Values suspected of being of non-oceanographic origin may be tagged with the BODC flag denoting suspect value; the data values will not be altered.
The following types of irregularity, each relying on visual detection in the plot, are amongst those which may be flagged as suspect:
- Spurious data at the start or end of the record.
- Obvious spikes occurring in periods free from meteorological disturbance.
- A sequence of constant values in consecutive data cycles.
If a large percentage of the data is affected by irregularities then a Problem Report will be written rather than flagging the individual suspect values. Problem Reports are also used to highlight irregularities seen in the graphical data presentations.
Inconsistencies between the characteristics of the data set and those of its neighbours are sought and, where necessary, documented. This covers inconsistencies such as the following:
- Maximum and minimum values of parameters (spikes excluded).
- The occurrence of meteorological events.
This intrinsic and extrinsic screening of the parameter values seeks to confirm the qualifying information and the source laboratory's comments on the series. In screening and collating information, every care is taken to ensure that errors of BODC making are not introduced.
Project Information
Physical-Biological Control of New Production within the Seasonal Thermocline
This project was a NERC responsive-mode project which was co-funded by the Defence Science and Technology Laboratory and ran from 2003 to 2006. The key institutes and scientists involved were:
| Institute | Scientific personnel |
|---|---|
| Proudman Oceanographic Laboratory (POL) | Jonathan Sharples |
| National Oceanography Centre, Southampton (NOCS) | Patrick Holligan Mark Moore |
| University of Wales, Bangor (UWB) | John Simpson Tom Rippeth |
Research Aim
The main aim of this research was to investigate the generation and dissipation of turbulence in the thermocline, and to quantify how the resulting mixing (supplying nutrients and controlling the light experienced by the algae) affected the growth of phytoplankton within the sub-surface chlorophyll maximum (SCM).
Research Objectives
The objective of the research was to test the general hypothesis that, in seasonally-stratified shelf waters, temporal and spatial variability of the rate of 'new' production is determined by the degree of coupling between physical and biological processes within the seasonal thermocline. In particular it has been suggested that physiological adaptation by phytoplankton making up the subsurface chlorophyll maximum drives a biological pump for extracting nitrate from the bottom mixed layer that is sensitive to internal mixing and to external climatological factors.
Research Approach
The sampling and experimental strategy was based on established methods for obtaining compatible, high-resolution vertical profiles (alternate CTD and FLY) and sections (SeaSoar) of physical, chemical, and biological parameters, allowing quantification of vertical fluxes and primary production on tidal and internal wave time scales. The cruise schedule (with associated mooring deployments) for the project is below.
Cruise Schedule
| Cruise ID | Ship | Sampling Region | Cruise Dates | Main measurements |
|---|---|---|---|---|
| JR98 | RRS James Clark Ross | St Georges Channel, Celtic Sea and shelf edge | 25/07/03 - 14/08/03 | CTD casts, SeaSoar transects (CTD, chlorophyll, fluorescence), FRRF, ship ADCP, primary productivity, nutrients, trace metals, phytoplankton uptake rates, algal photophysiology, oxygen concentration, particle size, optics, mooring deployments |
| PD32_03 | RV Prince Madog | Celtic Sea and shelf edge | 27/07/03 - 13/08/03 | 5 x FLY 25 hour tidal cycle stations, particle size analysis, particle settling velocity, CTD casts, mooring deployments |
| CD173 | RRS Charles Darwin | Celtic Sea and shelf edge | 15/07/05 - 06/08/05 | CTD casts, chlorophyll, oxygen concentration, FLY profiles, SeaSoar tows (CTD, chlorophyll, FRRF), phytoplankton pigments, nutrients, primary productivity, phytoplankton uptake rates, FRRF profiles, optics, particle size analysis, mooring deployments |
| PD27_05 | RV Prince Madog | Celtic Sea and shelf edge | 22/07/05 - 06/08/05 | FLY profiles, mooring deployments |
Moorings
| Station ID | Latitude | Longitude | Depth (m) | Mooring | Deployment date | Recovery date | Deployment vessel |
|---|---|---|---|---|---|---|---|
| CS3 | 51.471 | -6.428 | 95 | Seabed frame 300 kHz ADCP | 01/08/03 | 11/08/03 | RV Prince Madog |
| CS3 | 51.471 | -6.428 | 95 | Seabed frame 1200 kHz ADCP | 01/08/03 | 11/08/03 | RV Prince Madog |
| CS3 | 51.474 | -6.437 | 95 | Mid-water subsurface 300 kHz ADCP | 01/08/03 | 11/08/03 | RV Prince Madog |
| CS3 | 51.469 | -6.437 | 95 | Thermistor chain from 5 - 45 m depth | 01/08/03 | 11/08/03 | RV Prince Madog |
| ACW | 51.266 | -5.741 | 85 | Seabed frame 300 kHz ADCP | 06/08/03 | 08/08/03 | RV Prince Madog |
| CS2 | 48.532 | -9.463 | 200 | Surface temperature toroid | 28/07/03 | 12/08/03 | RRS James Clark Ross |
| CS2 | 48.532 | -9.463 | 200 | Thermistor chain throughout water column | 28/07/03 | 12/08/03 | RRS James Clark Ross |
| CS2 | 48.532 | -9.463 | 200 | Sub-suface 600 kHz ADCP (90 m) | 28/07/03 | 12/08/03 | RRS James Clark Ross |
| CS2 | 48.532 | -9.463 | 200 | Aanderaa RCM7 current meter/CTD (12 mab)* | 28/07/03 | 12/08/03 | RRS James Clark Ross |
| CS2 | 48.532 | -9.463 | 200 | Seabed frame 150 kHz ADCP | 28/07/03 | 12/08/03 | RRS James Clark Ross |
| CS2 | 48.532 | -9.463 | 200 | Seabed frame 300 kHz ADCP | 28/07/03 | 12/08/03 | RRS James Clark Ross |
| U2 | 49.236 | -6.166 | 121 | Sub-suface 300 kHz ADCP (5 mab)* | 15/07/05 | 03/08/05 | RRS Charles Darwin |
| U2 | 49.233 | -6.167 | 120 | Thermistor chain throughout water column | 19/07/05 | Mooring lost | RRS Charles Darwin |
| CS2 | 48.571 | -9.509 | 200 | Thermistor chain throughout water column | 17/07/05 | 24/07/05 | RRS Charles Darwin |
| CS2 | 48.573 | -9.51 | 194 | Sub-suface 300 kHz ADCP (100 m) | 17/07/05 | 24/07/05 | RRS Charles Darwin |
| CS2 | 48.572 | -9.508 | 196 | Seabed frame 300 kHz ADCP | 17/07/05 | 24/07/05 | RRS Charles Darwin |
| CS2 | 48.571 | -9.507 | 202 | Seabed frame 150 kHz ADCP | 17/07/05 | 24/07/05 | RRS Charles Darwin |
| Bank 1 | 49.938 | -7.792 | 118 | Thermistor chain throughout water column | 26/07/05 | Mooring lost | RRS Charles Darwin |
| Bank 1 | 49.936 | -7.792 | 118 | Seabed frame 300 kHz ADCP | 27/07/05 | Recovered by trawler 29/07/05 | RRS Charles Darwin |
| Bank 2 | 49.895 | -7.872 | 114 | Thermistor chain throughout water column | 20/07/05 | 04/08/05 | RRS Charles Darwin |
| Bank 2 | 49.876 | -7.897 | 112 | Sub-surface 600 kHz ADCP (56 m) | 26/07/05 | 04/08/05 | RRS Charles Darwin |
| Bank 2 | 49.894 | -7.873 | 110 | Seabed frame 300 kHz ADCP | 26/07/05 | 04/08/05 | RRS Charles Darwin |
| Bank 3 | 49.851 | -7.952 | 78 | Thermistor chain throughout water column | 26/07/05 | 03/08/05 | RV Prince Madog |
| Bank 3 | 49.854 | -7.948 | 78 | Seabed frame 300 kHz ADCP | 26/07/05 | Mooring lost | RV Prince Madog |
* = metres above seabed
Project Outcomes
The main products of the research were:
- The first large scale interdisciplinary study of the dynamic processes that determine the properties of the SCM in NW European shelf waters.
- Substantive advances in quantifying internal mixing in NW European shelf seas, and in understanding how primary production is controlled by this small-scale turbulence.
- New parameterisations for internal vertical mixing, and the response of primary production, for use in coupled numerical models.
- Improved capability for estimating primary productivity in stratified waters by satellite remote sensing (ocean colour, sea surface temperature, wind mixing etc.)
- An overall development of our understanding of the dynamics of ecosystems that support important fisheries, and of our abilities in predicting ecological and biogeochemical responses to variations and changes in the climate of the marine environment.
Data Activity or Cruise Information
Cruise
| Cruise Name | JR20030725 (JR98) |
| Departure Date | 2003-07-25 |
| Arrival Date | 2003-08-13 |
| Principal Scientist(s) | Jonathan Sharples (Proudman Oceanographic Laboratory) |
| Ship | RRS James Clark Ross |
Complete Cruise Metadata Report is available here
Fixed Station Information
Fixed Station Information
| Station Name | IS1b |
| Category | Offshore location |
| Latitude | 52° 34.02' N |
| Longitude | 5° 28.02' W |
| Water depth below MSL | 77.0 m |
Physical-Biological Control of New Production within the Seasonal Thermocline: Fixed Station IS1b
This station is in the Irish Sea, 50 km off the Irish coast (see figure below). It was first visited by the RRS James Clark Ross (JR98) in 2003.
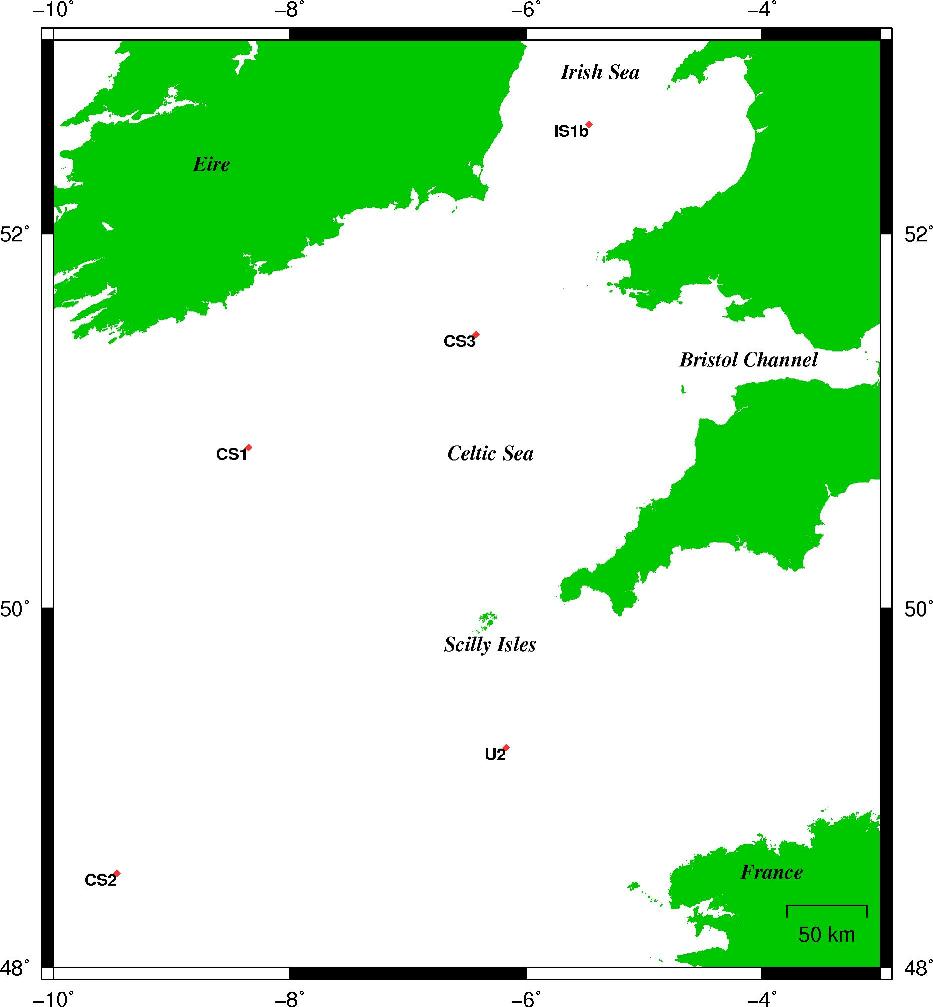
All activities that have occurred here lie within a box bounded by co-ordinates 52.5693° N, 5.4725° W at the northwest corner and 52.5617° N, 5.4627° W at the southeast corner. The mean depth within this box is 77 m.
The deployment and sampling history, to date, for this station is summarised below:
Key
CTD = Conductivity, temperature, depth sensor
CTD Casts
| Latitude | Longitude | Depth (m) | Visit dates | Research Vessel |
|---|---|---|---|---|
| 52.567° N | 5.467° W | 71 | 2003-08-02 to 2003-08-03 (25 hour tide cycle station) | RRS James Clark Ross (JR98) |
Optics casts
| Latitude | Longitude | Visit dates | Instruments deployed | Research vessel |
|---|---|---|---|---|
| 52.567° N | 5.467° W | 2003-08-02 - 5 casts | Optics logger WET Labs ac-9 in-situ spectrophotometer An optical volume scattering function (VSF) sensor HOBI Labs HydroScat-6 (Bb6) backscatter sensor | RRS James Clark Ross (JR98) |
Related Fixed Station activities are detailed in Appendix 1
BODC Quality Control Flags
The following single character qualifying flags may be associated with one or more individual parameters with a data cycle:
| Flag | Description |
|---|---|
| Blank | Unqualified |
| < | Below detection limit |
| > | In excess of quoted value |
| A | Taxonomic flag for affinis (aff.) |
| B | Beginning of CTD Down/Up Cast |
| C | Taxonomic flag for confer (cf.) |
| D | Thermometric depth |
| E | End of CTD Down/Up Cast |
| G | Non-taxonomic biological characteristic uncertainty |
| H | Extrapolated value |
| I | Taxonomic flag for single species (sp.) |
| K | Improbable value - unknown quality control source |
| L | Improbable value - originator's quality control |
| M | Improbable value - BODC quality control |
| N | Null value |
| O | Improbable value - user quality control |
| P | Trace/calm |
| Q | Indeterminate |
| R | Replacement value |
| S | Estimated value |
| T | Interpolated value |
| U | Uncalibrated |
| W | Control value |
| X | Excessive difference |
SeaDataNet Quality Control Flags
The following single character qualifying flags may be associated with one or more individual parameters with a data cycle:
| Flag | Description |
|---|---|
| 0 | no quality control |
| 1 | good value |
| 2 | probably good value |
| 3 | probably bad value |
| 4 | bad value |
| 5 | changed value |
| 6 | value below detection |
| 7 | value in excess |
| 8 | interpolated value |
| 9 | missing value |
| A | value phenomenon uncertain |
| B | nominal value |
| Q | value below limit of quantification |
Appendix 1: IS1b
Related series for this Fixed Station are presented in the table below. Further information can be found by following the appropriate links.
If you are interested in these series, please be aware we offer a multiple file download service. Should your credentials be insufficient for automatic download, the service also offers a referral to our Enquiries Officer who may be able to negotiate access.
| Series Identifier | Data Category | Start date/time | Start position | Cruise |
|---|---|---|---|---|
| 1107083 | CTD or STD cast | 2003-08-02 02:56:59 | 52.56667 N, 5.46683 W | RRS James Clark Ross JR20030725 (JR98) |
| 1107095 | CTD or STD cast | 2003-08-02 03:58:02 | 52.56667 N, 5.46683 W | RRS James Clark Ross JR20030725 (JR98) |
| 1107102 | CTD or STD cast | 2003-08-02 04:57:04 | 52.56667 N, 5.46683 W | RRS James Clark Ross JR20030725 (JR98) |
| 1107114 | CTD or STD cast | 2003-08-02 05:59:00 | 52.56233 N, 5.47017 W | RRS James Clark Ross JR20030725 (JR98) |
| 1107126 | CTD or STD cast | 2003-08-02 07:02:04 | 52.56667 N, 5.46683 W | RRS James Clark Ross JR20030725 (JR98) |
| 1107138 | CTD or STD cast | 2003-08-02 08:01:58 | 52.56683 N, 5.46683 W | RRS James Clark Ross JR20030725 (JR98) |
| 1107151 | CTD or STD cast | 2003-08-02 09:01:00 | 52.56683 N, 5.46683 W | RRS James Clark Ross JR20030725 (JR98) |
| 1107163 | CTD or STD cast | 2003-08-02 10:11:00 | 52.56683 N, 5.4665 W | RRS James Clark Ross JR20030725 (JR98) |
| 1107175 | CTD or STD cast | 2003-08-02 11:02:59 | 52.5665 N, 5.46667 W | RRS James Clark Ross JR20030725 (JR98) |
| 1107187 | CTD or STD cast | 2003-08-02 12:09:56 | 52.56783 N, 5.46583 W | RRS James Clark Ross JR20030725 (JR98) |
| 1107199 | CTD or STD cast | 2003-08-02 13:08:59 | 52.56633 N, 5.46667 W | RRS James Clark Ross JR20030725 (JR98) |
| 1107206 | CTD or STD cast | 2003-08-02 14:02:59 | 52.56633 N, 5.46667 W | RRS James Clark Ross JR20030725 (JR98) |
| 1107218 | CTD or STD cast | 2003-08-02 15:01:00 | 52.56633 N, 5.46667 W | RRS James Clark Ross JR20030725 (JR98) |
| 1107231 | CTD or STD cast | 2003-08-02 16:02:56 | 52.56567 N, 5.46717 W | RRS James Clark Ross JR20030725 (JR98) |
| 1107243 | CTD or STD cast | 2003-08-02 17:06:00 | 52.56683 N, 5.46683 W | RRS James Clark Ross JR20030725 (JR98) |
| 1107255 | CTD or STD cast | 2003-08-02 18:02:01 | 52.56667 N, 5.46667 W | RRS James Clark Ross JR20030725 (JR98) |
| 1107267 | CTD or STD cast | 2003-08-02 19:00:03 | 52.56683 N, 5.46683 W | RRS James Clark Ross JR20030725 (JR98) |
| 1107279 | CTD or STD cast | 2003-08-02 19:58:57 | 52.5665 N, 5.467 W | RRS James Clark Ross JR20030725 (JR98) |
| 1107280 | CTD or STD cast | 2003-08-02 20:59:00 | 52.5665 N, 5.46683 W | RRS James Clark Ross JR20030725 (JR98) |
| 1107292 | CTD or STD cast | 2003-08-02 22:00:03 | 52.5665 N, 5.467 W | RRS James Clark Ross JR20030725 (JR98) |
| 1107311 | CTD or STD cast | 2003-08-02 22:58:57 | 52.56667 N, 5.467 W | RRS James Clark Ross JR20030725 (JR98) |
| 1107335 | CTD or STD cast | 2003-08-03 00:57:01 | 52.56633 N, 5.46667 W | RRS James Clark Ross JR20030725 (JR98) |
| 1107347 | CTD or STD cast | 2003-08-03 01:56:04 | 52.56633 N, 5.46667 W | RRS James Clark Ross JR20030725 (JR98) |
| 1107359 | CTD or STD cast | 2003-08-03 02:56:59 | 52.56667 N, 5.46683 W | RRS James Clark Ross JR20030725 (JR98) |
| 1107360 | CTD or STD cast | 2003-08-03 03:57:01 | 52.56667 N, 5.46683 W | RRS James Clark Ross JR20030725 (JR98) |
