Metadata Report for BODC Series Reference Number 1127650
Metadata Summary
Problem Reports
Data Access Policy
Narrative Documents
Project Information
Data Activity or Cruise Information
Fixed Station Information
BODC Quality Flags
SeaDataNet Quality Flags
Metadata Summary
Data Description |
|||||||||||||||||||||||||||||
|
|||||||||||||||||||||||||||||
Data Identifiers |
|||||||||||||||||||||||||||||
|
|||||||||||||||||||||||||||||
Time Co-ordinates(UT) |
|||||||||||||||||||||||||||||
|
|||||||||||||||||||||||||||||
Spatial Co-ordinates | |||||||||||||||||||||||||||||
|
|||||||||||||||||||||||||||||
Parameters |
|||||||||||||||||||||||||||||
|
|||||||||||||||||||||||||||||
|
|||||||||||||||||||||||||||||
Problem Reports
No Problem Report Found in the Database
JCO25 towed temperature logger data quality document
Pressure sensors deployed on towed lines from cruise JC025 indicate that at times there was variation (of up to 15 m) in the depth of sensors around the nominal depth. This variation in depth would also have been experienced by instruments without pressure sensors as they were deployed on the same lines. The depth of the instruments should therefore only be considered as a nominal depth and users should be aware that the actual depth of the instrument may have varied in places.
Data Access Policy
Open Data
These data have no specific confidentiality restrictions for users. However, users must acknowledge data sources as it is not ethical to publish data without proper attribution. Any publication or other output resulting from usage of the data should include an acknowledgment.
If the Information Provider does not provide a specific attribution statement, or if you are using Information from several Information Providers and multiple attributions are not practical in your product or application, you may consider using the following:
"Contains public sector information licensed under the Open Government Licence v1.0."
Narrative Documents
Star-Oddi Starmon mini Temperature Recorder
Description
The Star-Oddi Starmon mini is a compact microprocessor-controlled temperature recorder with electronics and probe housed in a strong waterproof cylinder made of either plastic or titanium.
Specifications
| Memory | 350000 measurements, although memory size can optionally be increased to 524000 or 699000 measurements. Temperature readings are stored in non-volatile Electrically Erasable Programmable Read Only Memory (EEPROM). |
|---|---|
| Data Retention | 20 years. |
| Temperature Range | -2 °C to +40 °C with outside ranges available at request. The average resolution is 0.013 °C, and the measuring accuracy is +/-0.05 °C. |
| Maximum Depth | Plastic version: 400 m (40 bar), titanium version: 11000 m (1100 bar) |
| Communication Link | Downloaded via PC interface box. Connects to a computer via a RS-232C standard serial interface. |
| Battery | A 3.6 V lithium battery with a life of 5 years for a sampling interval of 10 minutes or greater. |
For more information please see the manufacturers specification sheet.
Originator's Processing for towed temperature loggers used during cruise JC025
Sampling Strategy
Star-Oddi DST centi-TD temperature and depth recorders and Starmon temperature loggers were attached by Proudman Oceanographic Laboratory (POL) technical staff to fixed positions along the first 65 m of a 10 mm diameter galvanised steel wire of 68 m length. The wire was deployed from the RRS James Cook during cruiseJC025 in the Celtic Sea, acting as a platform allowing the loggers to provide simultaneous hydrographic measurements throughout the water column. This wire was designed to be towed through the water at speeds up to 4 knots. A 380 kg lead sphere shackled to the bottom end of the wire, 3 m below the lowest logger, acted as a depressor to prevent the line of instruments from streaming out behind the ship.
Six deployments were carried out during the cruise. All but the second deployment were in conjunction with turbulence profiles, when the ship was making headway at approximately 0.5 knots. For the second deployment the wire was towed along Jones Bank at a nominal speed of 3.5 knots.
Towed wire deployments
| Deployment | Recovery | Region of study |
|---|---|---|
| 2008-07-06 | 2008-07-07 | Station MS2 |
| 2008-07-10 | 2008-07-11 | Transect along Jones Bank |
| 2008-07-12 | 2008-07-13 | Station MS4 |
| 2008-07-14 | 2008-07-15 | Station MS2 |
| 2008-07-21 | 2008-07-22 | Station MS2 |
| 2008-07-22 | 2008-07-23 | Station MS4 |
Data Processing
Prior to each deployment, POL technical staff set the internal clock and the start time to UTC. Each instrument (see table below for full details) was set up using the factory calibration stored in its internal memory. No adjustments were made to the data, which were supplied to BODC in ASCII format exactly as downloaded from each sensor.
Instrument logger details
| Instrument | Calibration date | Serial number(s) |
|---|---|---|
| Star-Oddi DST centi-TD temperature and depth recorder | 2007-11-06 | 683 |
| 2007-06-29 | 3268, 3269, 3270, 3271, 3272, 3273, 3275, 3276, 3278 | |
| Star-Oddi Starmon temperature logger | 2007-05-30 | 2604, 2605, 2606, 2608, 2610, 2611, 2612, 2613, 2614 |
| 2007-06-29 | 2617, 2618, 2619, 2621, 2622, 2624 |
Processing by BODC: towed temperature logger data from JC025
BODC received the temperature logger data as ASCII files from the Data Originator. The files were copied and then edited by BODC to remove periods at the start and end of the data record that the Data Originator had indicated to be of no use. Pages 49 - 53 of the JC025 cruise report show the times for each logger that the Originator considers useful.
The data were then converted from ASCII into BODC internal format using transfer function 463. No navigation data were recorded by the loggers, but BODC require this information to store the data. BODC resolved this issue by adding latitude and longitude to each BODC format logger file using an in-house program.
The in-house software used the underway navigation data from the JC025 as its position source and merged that with the logger data using sample time as the common field. As the latitude and longitude data were derived from external sources and not directly measured by the temperature loggers, they have been flagged as estimated values.
The following table shows how all variables within the files were mapped to appropriate BODC parameter codes:
| Originator's Variable | Units | Description | BODC Parameter Code | Units | Comments |
|---|---|---|---|---|---|
| Temperature | °C | Temperature of the water body | TEMPPR01 | °C | - |
| Depth | m | Depth below surface of the water body | ADEPZZ01 | m | Some of the temperature loggers deployed on this cruise also recorded depth data. When these data were received by BODC, they were mapped as shown here |
| Roll | Degrees | Orientation (roll angle) of measurement platform by inclinometer | ROLLEI01 | Degrees | Some of the temperature loggers deployed on this cruise also recorded instrument orientation data. When these data were received by BODC, they were mapped as shown here. |
| Pitch | Degrees | Orientation (pitch) of measurement platform by inclinometer | PTCHEI01 | Degrees | |
| - | - | Latitude north (WGS84) by unspecified GPS system | ALATGP01 | ° | Latitude source is JC025 underway data. Inserted using in-house software |
| - | - | Longitude east (WGS84) by unspecified GPS system | ALONGP01 | ° | Longitude source is JC025 underway data. Inserted using in-house software |
The reformatted data were visualised using the in-house EDSERPLO software. Suspect and missing data were marked by adding appropriate quality control flags.
General Data Screening carried out by BODC
BODC screen both the series header qualifying information and the parameter values in the data cycles themselves.
Header information is inspected for:
- Irregularities such as unfeasible values
- Inconsistencies between related information, for example:
- Times for instrument deployment and for start/end of data series
- Length of record and the number of data cycles/cycle interval
- Parameters expected and the parameters actually present in the data cycles
- Originator's comments on meter/mooring performance and data quality
Documents are written by BODC highlighting irregularities which cannot be resolved.
Data cycles are inspected using time or depth series plots of all parameters. Currents are additionally inspected using vector scatter plots and time series plots of North and East velocity components. These presentations undergo intrinsic and extrinsic screening to detect infeasible values within the data cycles themselves and inconsistencies as seen when comparing characteristics of adjacent data sets displaced with respect to depth, position or time. Values suspected of being of non-oceanographic origin may be tagged with the BODC flag denoting suspect value; the data values will not be altered.
The following types of irregularity, each relying on visual detection in the plot, are amongst those which may be flagged as suspect:
- Spurious data at the start or end of the record.
- Obvious spikes occurring in periods free from meteorological disturbance.
- A sequence of constant values in consecutive data cycles.
If a large percentage of the data is affected by irregularities then a Problem Report will be written rather than flagging the individual suspect values. Problem Reports are also used to highlight irregularities seen in the graphical data presentations.
Inconsistencies between the characteristics of the data set and those of its neighbours are sought and, where necessary, documented. This covers inconsistencies such as the following:
- Maximum and minimum values of parameters (spikes excluded).
- The occurrence of meteorological events.
This intrinsic and extrinsic screening of the parameter values seeks to confirm the qualifying information and the source laboratory's comments on the series. In screening and collating information, every care is taken to ensure that errors of BODC making are not introduced.
Project Information
Oceans 2025 - The NERC Marine Centres' Strategic Research Programme 2007-2012
Who funds the programme?
The Natural Environment Research Council (NERC) funds the Oceans 2025 programme, which was originally planned in the context of NERC's 2002-2007 strategy and later realigned to NERC's subsequent strategy (Next Generation Science for Planet Earth; NERC 2007).
Who is involved in the programme?
The Oceans 2025 programme was designed by and is to be implemented through seven leading UK marine centres. The marine centres work together in coordination and are also supported by cooperation and input from government bodies, universities and other partners. The seven marine centres are:
- National Oceanography Centre, Southampton (NOCS)
- Plymouth Marine Laboratory (PML)
- Marine Biological Association (MBA)
- Sir Alister Hardy Foundation for Marine Science (SAHFOS)
- Proudman Oceanographic Laboratory (POL)
- Scottish Association for Marine Science (SAMS)
- Sea Mammal Research Unit (SMRU)
Oceans2025 provides funding to three national marine facilities, which provide services to the wider UK marine community, in addition to the Oceans 2025 community. These facilities are:
- British Oceanographic Data Centre (BODC), hosted at POL
- Permanent Service for Mean Sea Level (PSMSL), hosted at POL
- Culture Collection of Algae and Protozoa (CCAP), hosted at SAMS
The NERC-run Strategic Ocean Funding Initiative (SOFI) provides additional support to the programme by funding additional research projects and studentships that closely complement the Oceans 2025 programme, primarily through universities.
What is the programme about?
Oceans 2025 sets out to address some key challenges that face the UK as a result of a changing marine environment. The research funded through the programme sets out to increase understanding of the size, nature and impacts of these changes, with the aim to:
- improve knowledge of how the seas behave, not just now but in the future;
- help assess what that might mean for the Earth system and for society;
- assist in developing sustainable solutions for the management of marine resources for future generations;
- enhance the research capabilities and facilities available for UK marine science.
In order to address these aims there are nine science themes supported by the Oceans 2025 programme:
- Climate, circulation and sea level (Theme 1)
- Marine biogeochemical cycles (Theme 2)
- Shelf and coastal processes (Theme 3)
- Biodiversity and ecosystem functioning (Theme 4)
- Continental margins and deep ocean (Theme 5)
- Sustainable marine resources (Theme 6)
- Technology development (Theme 8)
- Next generation ocean prediction (Theme 9)
- Integration of sustained observations in the marine environment (Theme 10)
In the original programme proposal there was a theme on health and human impacts (Theme 7). The elements of this Theme have subsequently been included in Themes 3 and 9.
When is the programme active?
The programme started in April 2007 with funding for 5 years.
Brief summary of the programme fieldwork/data
Programme fieldwork and data collection are to be achieved through:
- physical, biological and chemical parameters sampling throughout the North and South Atlantic during collaborative research cruises aboard NERC's research vessels RRS Discovery, RRS James Cook and RRS James Clark Ross;
- the Continuous Plankton Recorder being deployed by SAHFOS in the North Atlantic and North Pacific on 'ships of opportunity';
- physical parameters measured and relayed in near real-time by fixed moorings and ARGO floats;
- coastal and shelf sea observatory data (Liverpool Bay Coastal Observatory (LBCO) and Western Channel Observatory (WCO)) using the RV Prince Madog and RV Quest.
The data is to be fed into models for validation and future projections. Greater detail can be found in the Theme documents.
Oceans 2025 Theme 3: Shelf and Coastal Processes
Over the next 20 years, UK local marine environments are predicted to experience ever-increasing rates of change - including increased temperature and seawater acidity, changing freshwater run-off, changes in sea level, and a likely increase in flooding events - causing great concern for those charged with their management and protection. The future quality, health and sustainability of UK marine waters require improved appreciation of the complex interactions that occur not only within the coastal and shelf environment, but also between the environment and human actions. This knowledge must primarily be provided by whole-system operational numerical models, able to provide reliable predictions of short and long-term system responses to change.
However, such tools are only viable if scientists understand the underlying processes they are attempting to model and can interpret the resulting data. Many fundamental processes in shelf edge, shelf, coastal and estuarine systems, particularly across key interfaces in the environment, are not fully understood.
Theme 3 addresses the following broad questions:
- How do biological, physical and chemical processes interact within shelf, coastal and estuarine systems, particularly at key environmental interfaces (e.g. coastline, sediment-water interface, thermocline, fronts and the shelf edge)?
- What are the consequences of these interactions on the functioning of the whole coastal system, including its sensitivity and/or resilience to change?
- Ultimately, what changes should be expected to be seen in the UK coastal environment over the next 50 years and beyond and how might these changes be transmitted into the open ocean?
Within Oceans 2025, Theme 3 will develop the necessary understanding of interacting processes to enable the consequences of environmental and anthropogenic change on UK shelf seas, coasts and estuaries to be predicted. Theme 3 will also provide knowledge that can improve the forecasting capability of models being used for the operational management of human activities in the coastal marine environment. Theme 3 is therefore directly relevant to all three of NERC's current strategic priorities; Earth's Life-Support Systems, Climate Change, and Sustainable Economies
The official Oceans 2025 documentation for this Theme is available from the following link: Oceans 2025 Theme 3
Weblink: http://www.oceans2025.org/
Oceans 2025 Theme 3, Work Package 3.2: Horizontal Patchiness in Vertical Mixing in Stratified Shelf Seas
In this Work Package, the Proudman Oceanographic Laboratory (POL) aim to address vertical mixing processes at the thermocline that are either poorly understood or have inadequate parameterisations in models. This is important because, as a boundary to vertical mixing, the thermocline affects much of the ecology and biochemistry of seasonally-stratifying shelf seas. Horizontal patchiness of vertical mixing is now known to be driven by varying seabed topography, indicating a need for a non-hydrostatic approach. This work is an expansion of the research carried out by POL during project Physical-Biological Control of New Production within the Seasonal Thermocline.
The specific objectives of Work Package 3.2 are:
- Quantify discrepancies between the Proudman Oceanographic Laboratory Coastal Ocean Modelling System (POLCOMS) numerical model and observations of thermocline depths/strengths and diapycnal fluxes.
- Determine the causes of these discrepancies in terms of modelled and observed responses to meteorological forcing and in terms of the potential for patchy internal mixing.
- Quantify the importance of non-hydrostatic processes at the thermocline over typical shelf topographies.
- Carry out ship-based process studies focusing on the patchiness of mixing through the shelf thermocline.
- Quantify the consequences of thermocline patchiness over a whole shelf sea, alongside recommendations for process, bathymetry, and model resolution required to simulate the more important consequences.
More detailed information on this Work Package is available at pages 7 - 8 of the official Oceans 2025 Theme 3 document: Oceans 2025 Theme 3
Weblink: http://www.oceans2025.org/
Cruise Schedule
| Ship | Sampling Region | Cruise | Dates | Main measurements |
|---|---|---|---|---|
| RRS James Cook | Celtic Sea and shelf edge | JC025 | 2008-07-02 to 2008-07-27 | Turbulence profiles, biochemistry sampling, dye release studies, scanfish surveys (CTD and fluorescence), seabed grabs, core sampling, seabird and mammal observations, fisheries echosounder studies, CTD profiles, temperature-fluorometer chain tows, zooplankton net hauls, baited underwater camera studies, cetacean acoustics, mooring deployments |
Moorings
| Station ID | Latitude | Longitude | Water depth(m) | Mooring description | Deployed on | Recovered on |
|---|---|---|---|---|---|---|
| MS1 | 49° 51.21' | -7° 56.94' | 78 | Temperature chain, surface and bottom CTD | 15:45 UTC 2008-07-05 | 18:48 UTC 2008-07-24 |
| MS1 | 49° 51.21' | -7° 56.82' | 78 | Lander-mounted sea-bed ADCP | 13:39 UTC 2008-07-05 | 17:50 UTC 2008-07-24 |
| MS2 | 49° 53.90' | -7° 52.57' | 114 | Temperature chain, surface and bottom CTD | 02:23 UTC 2008-07-05 | 13:25 UTC 2008-07-23 |
| MS2 | 49° 53.85' | -7° 52.48' | 114 | Lander-mounted sea-bed ADCP | 03:07 UTC 2008-07-05 | 15:40 UTC 2008-07-24 |
| MS3 | 49° 56.40' | -7° 49.00' | 122 | Temperature chain, surface and bottom CTD | 21:47 UTC 2008-07-04 | 11:40 UTC 2008-07-23 |
| MS3 | 49° 56.30' | -7° 48.90' | 122 | Lander-mounted sea-bed ADCP | 22:28 UTC 2008-07-04 | 12:24 UTC 2008-07-22 |
| MS4 | 49° 44.99' | -7° 40.05' | 110 | Sea-bed ADCP | 18:29 UTC 2008-07-05 | 07:59 UTC 2008-07-23 |
Data Activity or Cruise Information
Data Activity
| Start Date (yyyy-mm-dd) | 2008-07-14 |
| End Date (yyyy-mm-dd) | 2008-07-15 |
| Organization Undertaking Activity | Proudman Oceanographic Laboratory (now National Oceanography Centre, Liverpool) |
| Country of Organization | United Kingdom |
| Originator's Data Activity Identifier | JC025_MS2_TC_chain_tow_14_15_July_2008 |
| Platform Category | towed unmanned submersible |
JC025 temperature-chlorophyll chain tow at site MS2 from 14 to 15 July 2008
The temperature-chlorophyll chain towed by the RV James Cook during cruise JC025 consisted of a series of self-contained internally-recording fluorometers and temperature loggers attached to a 10 mm diameter galvanised steel wire of 200 m length. A 380 kg lead sphere shackled to the bottom end of the wire acted as a depressor to prevent the line of instruments from streaming out behind the ship. Copper ferrules were crimped onto the wire at 1 m intervals, starting 3 m above the depressor sphere, and were used as mounting points to attach the instruments. Specially designed clamps allow for quick attachment and release of instruments at these mounting points.
The chain was designed to be towed through the water at speeds up to 4 knots. This deployment was made from the vessel stern gantry while the ship was making headway through mooring stationMS2 from 14 to 15 July 2008 at approximately 0.5 knots.
The temperature-chlorophyll chain was configured as follows for this deployment:
| Mounting Point a | Nominal depth (m) | Instrument type | Serial number | Calibration | Record start time (UTC) | Record end time (UTC) |
|---|---|---|---|---|---|---|
| 1 | 65 | Wetlabs FLB chlorophyll fluorometer | 775 | 2007-06-28 | 2008-07-14 08:00:00 | 2008-07-15 08:42:25 |
| Star-Oddi Centi-TD temperature and pressure logger | 3270 | 2007-06-29 | 2008-07-14 07:00:00 | 2008-07-15 10:56:06 | ||
| 5 | 61 | Star-Oddi Starmon-mini temperature logger | 2619 | 2007-06-29 | 2008-07-14 07:00:00 | 2008-07-15 09:31:26 |
| 8 | 58 | Star-Oddi Starmon-mini temperature logger | 2618 | 2007-06-29 | 2008-07-14 07:00:00 | 2008-07-15 09:02:48 |
| 11 | 55 | Star-Oddi Starmon-mini temperature logger | 2612 | 2007-05-30 | 2008-07-14 07:00:00 | 2008-07-15 10:21:40 |
| 14 | 52 | Star-Oddi Starmon-mini temperature logger | 2610 | 2007-05-30 | 2008-07-14 07:00:00 | 2008-07-15 10:13:06 |
| 16 | 50 | Wetlabs FLB chlorophyll fluorometer | 937 | 2007-02-14 | 2008-07-14 07:55:00 | 2008-07-15 08:14:10 |
| Star-Oddi Centi-TD temperature and pressure logger | 3278 | 2007-06-29 | 2008-07-14 07:00:00 | 2008-07-15 10:46:33 | ||
| 18 | 48 | Star-Oddi Starmon-mini temperature logger | 2606 | 2007-05-30 | 2008-07-14 07:00:00 | 2008-07-15 09:05:09 |
| 20 | 46 | Wetlabs FLB chlorophyll fluorometer | 776 | 2007-06-28 | 2008-07-14 07:51:00 | 2008-07-15 07:14:10 |
| Star-Oddi Centi-TD temperature and pressure logger | 3268 | 2007-06-29 | 2008-07-14 07:00:00 | 2008-07-15 10:44:00 | ||
| 22 | 44 | Star-Oddi Starmon-mini temperature logger | 2624 | 2007-06-29 | 2008-07-14 07:00:00 | 2008-07-15 10:19:33 |
| 24 | 42 | Wetlabs FLB chlorophyll fluorometer | 906 | 2008-02-14 | 2008-07-14 07:21:00 | 2008-07-15 08:35:40 |
| Star-Oddi Centi-TD temperature and pressure logger | 3271 | 2007-06-29 | 2008-07-14 07:00:00 | 2008-07-15 10:53:34 | ||
| 26 | 40 | Star-Oddi Starmon-mini temperature logger | 2621 | 2007-06-29 | 2008-07-14 07:00:00 | 2008-07-15 08:57:25 |
| 28 | 38 | Wetlabs FLB chlorophyll fluorometer | 780 | 2007-07-09 | 2008-07-14 07:47:00 | 2008-07-15 08:21:50 |
| Star-Oddi Centi-TD temperature and pressure logger | 3275 | 2007-06-29 | 2008-07-14 07:00:00 | 2008-07-15 10:48:55 | ||
| 30 | 36 | Star-Oddi Starmon-mini temperature logger | 2605 | 2007-05-30 | 2008-07-14 07:00:00 | 2008-07-15 10:24:03 |
| 32 | 34 | Wetlabs FLB chlorophyll fluorometer | 938 | 2008-02-14 | 2008-07-14 07:43:00 | 2008-07-15 06:07:10 |
| Star-Oddi Centi-TD temperature and pressure logger | 3269 | 2007-06-29 | 2008-07-14 07:00:00 | 2008-07-15 10:35:30 | ||
| 34 | 32 | Star-Oddi Starmon-mini temperature logger | 2604 | 2007-05-30 | 2008-07-14 07:00:00 | 2008-07-15 09:33:42 |
| 36 | 30 | Wetlabs FLB chlorophyll fluorometer | 779 | 2007-06-28 | 2008-07-14 07:39:00 | 2008-07-15 07:06:10 |
| Star-Oddi Centi-TD temperature and pressure logger | 3272 | 2007-06-29 | 2008-07-14 07:00:00 | 2008-07-15 10:41:18 | ||
| 38 | 28 | Star-Oddi Starmon-mini temperature logger | 2611 | 2007-05-30 | 2008-07-14 07:00:00 | 2008-07-15 10:17:12 |
| 40 | 26 | Wetlabs FLB chlorophyll fluorometer | 777 | 2007-06-28 | 2008-07-14 07:35:00 | 2008-07-15 06:58:00 |
| Star-Oddi Centi-TD temperature and pressure logger | 3273 | 2007-06-29 | 2008-07-14 07:00:00 | 2008-07-15 10:38:23 | ||
| 42 | 24 | Star-Oddi Starmon-mini temperature logger | 2613 | 2007-05-30 | 2008-07-14 07:00:00 | 2008-07-15 09:17:26 |
| 44 | 22 | Star-Oddi Starmon-mini temperature logger | 2617 | 2007-06-29 | 2008-07-14 07:00:00 | 2008-07-15 10:26:21 |
| 46 | 20 | Wetlabs FLB chlorophyll fluorometer | 907 | 2008-02-14 | 2008-07-14 07:31:00 | 2008-07-15 08:29:10 |
| Star-Oddi Centi-TD temperature and pressure logger | 3276 | 2007-06-29 | 2008-07-14 07:00:00 | 2008-07-15 10:51:13 | ||
| 48 | 18 | Star-Oddi Starmon-mini temperature logger | 2608 | 2007-05-30 | 2008-07-14 07:00:00 | 2008-07-15 09:20:58 |
| 51 | 15 | Wetlabs FLB chlorophyll fluorometer | 778 | 2007-06-28 | 2008-07-14 07:26:00 | 2008-07-15 05:55:14 |
| Star-Oddi Centi-TD temperature and pressure logger | 683 b | 2007-11-06 | 2008-07-14 07:00:00 | 2008-07-15 10:30:52 | ||
| 55 | 11 | Star-Oddi Starmon-mini temperature logger | 2614 | 2007-05-30 | 2008-07-14 07:00:00 | 2008-07-15 10:10:13 |
| 59 | 7 | Star-Oddi Starmon-mini temperature logger | 2622 | 2007-06-29 | 2008-07-14 07:00:00 | 2008-07-15 10:07:25 |
Key:
a: Mounting point number refers to the position of the copper ferrules used to attach the instruments. The sequence runs with the first position closest to the lead sphere used as a drag weight, so as mounting point number increases, instrument depth decreases.
b: Star-Oddi Centi-TD temperature and pressure logger s/n 683 also contains pitch and roll sensors, unlike the other deployed Centi-TD sensors which record temperature and pressure only
Comments
The data originator stated that useful data were recorded on towed array instruments from 11:41:00 UTC 14 July 2008 to 03:57:30 UTC 15 July 2008.
Related Data Activity activities are detailed in Appendix 1
Cruise
| Cruise Name | JC025 |
| Departure Date | 2008-07-02 |
| Arrival Date | 2008-07-27 |
| Principal Scientist(s) | Jonathan Sharples (Proudman Oceanographic Laboratory) |
| Ship | RRS James Cook |
Complete Cruise Metadata Report is available here
Fixed Station Information
Fixed Station Information
| Station Name | Oceans 2025 WP3.2: Fixed Station MS2 |
| Category | Offshore location |
| Latitude | 49° 53.82' N |
| Longitude | 7° 52.58' W |
| Water depth below MSL | 114.0 m |
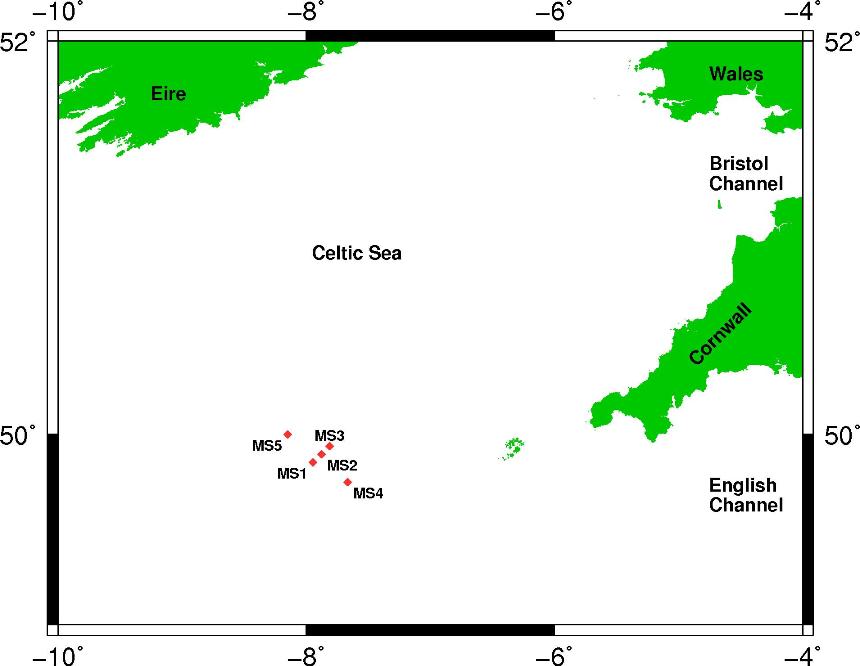
Oceans 2025 WP3.2: Fixed Station MS2
Station MS2 is located at 49° 53.82'N, 7° 52.58'W in the Celtic Sea and has a water depth of 114 m. This station was visited as part of the fieldwork carried out for Oceans 2025 Theme 3, Work Package 3.2: Hoizontal Patchiness in Vertical Mixing in Stratified Shelf Seas. Activities were carried out at site MS2 during cruise JC025 from 05 July 2008 to 22 July 2008. The exact position is visible below.
Position of Fixed Stations sampled during JC025
Sampling History for MS2
| Date | Activities |
|---|---|
| 2008-07-05 | Deployed mooring line of Star-Oddi temperature loggers throughout water column with surface and bed Sea-Bird MicroCAT CTDs. Deployed ADCP s/n 1903 attached to sea-bed lander frame. Cetacean acoustics using C-POD porpoise detectors attached to lander frame (s/n 50). |
| 2008-07-06 | CTD profiles with rosette bottle samples taken for nutrients, primary production, chlorophyll, nitrogen uptake and phytoplankton concentration. Zooplankton net hauls. Benthic grab samples. Fisheries acoustics. Benthic core and grab sampling. Turbulence probe profiles. |
| 2008-07-06 to 2008-07-07 | Deployment of towed array consisting of Wetlabs FLB fluorometers, Starmon and Star-Oddi temperature loggers. |
| 2008-07-07 | CTD profiles with rosette bottle samples taken for nutrients, primary production, chlorophyll, nitrogen uptake and phytoplankton concentration. |
| 2008-07-07 to 2008-07-09 | Baited underwater camera deployment. Cetacean acoustics using C-POD porpoise detector attached to underwater camera lander frame (s/n 78). |
| 2008-07-14 | CTD profiles with rosette bottle samples taken for nutrients. Zooplankton net hauls. Benthic core samples. Turbulence probe profiles. |
| 2008-07-14 to 2008-07-15 | Deployment of towed array consisting of Wetlabs FLB fluorometers, Starmon and Star-Oddi temperature loggers. |
| 2008-07-15 | Turbulence probe profiles. |
| 2008-07-21 | CTD profiles with rosette bottle samples taken for nutrients. Turbulence probe profiles. |
| 2008-07-21 to 2008-07-22 | Deployment of towed array consisting of Wetlabs FLB fluorometers, Starmon and Star-Oddi temperature loggers. |
| 2008-07-22 | CTD profiles with rosette bottle samples taken for nutrients. Turbulence probe profiles. Fisheries acoustics. |
Related Fixed Station activities are detailed in Appendix 2
BODC Quality Control Flags
The following single character qualifying flags may be associated with one or more individual parameters with a data cycle:
| Flag | Description |
|---|---|
| Blank | Unqualified |
| < | Below detection limit |
| > | In excess of quoted value |
| A | Taxonomic flag for affinis (aff.) |
| B | Beginning of CTD Down/Up Cast |
| C | Taxonomic flag for confer (cf.) |
| D | Thermometric depth |
| E | End of CTD Down/Up Cast |
| G | Non-taxonomic biological characteristic uncertainty |
| H | Extrapolated value |
| I | Taxonomic flag for single species (sp.) |
| K | Improbable value - unknown quality control source |
| L | Improbable value - originator's quality control |
| M | Improbable value - BODC quality control |
| N | Null value |
| O | Improbable value - user quality control |
| P | Trace/calm |
| Q | Indeterminate |
| R | Replacement value |
| S | Estimated value |
| T | Interpolated value |
| U | Uncalibrated |
| W | Control value |
| X | Excessive difference |
SeaDataNet Quality Control Flags
The following single character qualifying flags may be associated with one or more individual parameters with a data cycle:
| Flag | Description |
|---|---|
| 0 | no quality control |
| 1 | good value |
| 2 | probably good value |
| 3 | probably bad value |
| 4 | bad value |
| 5 | changed value |
| 6 | value below detection |
| 7 | value in excess |
| 8 | interpolated value |
| 9 | missing value |
| A | value phenomenon uncertain |
| B | nominal value |
| Q | value below limit of quantification |
Appendix 1: JC025_MS2_TC_chain_tow_14_15_July_2008
Related series for this Data Activity are presented in the table below. Further information can be found by following the appropriate links.
If you are interested in these series, please be aware we offer a multiple file download service. Should your credentials be insufficient for automatic download, the service also offers a referral to our Enquiries Officer who may be able to negotiate access.
| Series Identifier | Data Category | Start date/time | Start position | Cruise |
|---|---|---|---|---|
| 1029305 | Hydrography time series at depth | 2008-07-14 11:41:00 | 49.89776 N, 7.86417 W | RRS James Cook JC025 |
| 1029330 | Hydrography time series at depth | 2008-07-14 11:41:00 | 49.89776 N, 7.86417 W | RRS James Cook JC025 |
| 1029366 | Hydrography time series at depth | 2008-07-14 11:41:00 | 49.89776 N, 7.86417 W | RRS James Cook JC025 |
| 1029409 | Hydrography time series at depth | 2008-07-14 11:41:00 | 49.89776 N, 7.86417 W | RRS James Cook JC025 |
| 1029434 | Hydrography time series at depth | 2008-07-14 11:41:00 | 49.89776 N, 7.86417 W | RRS James Cook JC025 |
| 1029471 | Hydrography time series at depth | 2008-07-14 11:41:00 | 49.89776 N, 7.86417 W | RRS James Cook JC025 |
| 1029502 | Hydrography time series at depth | 2008-07-14 11:41:00 | 49.89776 N, 7.86417 W | RRS James Cook JC025 |
| 1029538 | Hydrography time series at depth | 2008-07-14 11:41:00 | 49.89776 N, 7.86417 W | RRS James Cook JC025 |
| 1029575 | Hydrography time series at depth | 2008-07-14 11:41:00 | 49.89776 N, 7.86417 W | RRS James Cook JC025 |
| 1088194 | Hydrography time series at depth | 2008-07-14 11:41:00 | 49.8978 N, 7.8642 W | RRS James Cook JC025 |
| 1127613 | Hydrography time series at depth | 2008-07-14 11:41:00 | 49.8978 N, 7.8642 W | RRS James Cook JC025 |
| 1127625 | Hydrography time series at depth | 2008-07-14 11:41:00 | 49.8978 N, 7.8642 W | RRS James Cook JC025 |
| 1127637 | Hydrography time series at depth | 2008-07-14 11:41:00 | 49.8978 N, 7.8642 W | RRS James Cook JC025 |
| 1127649 | Hydrography time series at depth | 2008-07-14 11:41:00 | 49.8978 N, 7.8642 W | RRS James Cook JC025 |
| 1127662 | Hydrography time series at depth | 2008-07-14 11:41:00 | 49.8978 N, 7.8642 W | RRS James Cook JC025 |
| 1127674 | Hydrography time series at depth | 2008-07-14 11:41:00 | 49.8978 N, 7.8642 W | RRS James Cook JC025 |
| 1127686 | Hydrography time series at depth | 2008-07-14 11:41:00 | 49.8978 N, 7.8642 W | RRS James Cook JC025 |
| 1127698 | Hydrography time series at depth | 2008-07-14 11:41:00 | 49.8978 N, 7.8642 W | RRS James Cook JC025 |
| 1127705 | Hydrography time series at depth | 2008-07-14 11:41:00 | 49.8978 N, 7.8642 W | RRS James Cook JC025 |
| 1127717 | Hydrography time series at depth | 2008-07-14 11:41:00 | 49.8978 N, 7.8642 W | RRS James Cook JC025 |
| 1127729 | Hydrography time series at depth | 2008-07-14 11:41:00 | 49.8978 N, 7.8642 W | RRS James Cook JC025 |
| 1127730 | Hydrography time series at depth | 2008-07-14 11:41:00 | 49.8978 N, 7.8642 W | RRS James Cook JC025 |
| 1127742 | Hydrography time series at depth | 2008-07-14 11:41:00 | 49.8978 N, 7.8642 W | RRS James Cook JC025 |
| 1127754 | Hydrography time series at depth | 2008-07-14 11:41:00 | 49.8978 N, 7.8642 W | RRS James Cook JC025 |
Appendix 2: Oceans 2025 WP3.2: Fixed Station MS2
Related series for this Fixed Station are presented in the table below. Further information can be found by following the appropriate links.
If you are interested in these series, please be aware we offer a multiple file download service. Should your credentials be insufficient for automatic download, the service also offers a referral to our Enquiries Officer who may be able to negotiate access.
| Series Identifier | Data Category | Start date/time | Start position | Cruise |
|---|---|---|---|---|
| 1169646 | Hydrography time series at depth | 2008-07-05 02:23:00 | 49.898 N, 7.876 W | RRS James Cook JC025 |
| 1169658 | Hydrography time series at depth | 2008-07-05 02:23:00 | 49.898 N, 7.876 W | RRS James Cook JC025 |
| 1169671 | Hydrography time series at depth | 2008-07-05 02:23:00 | 49.898 N, 7.876 W | RRS James Cook JC025 |
| 1169683 | Hydrography time series at depth | 2008-07-05 02:23:00 | 49.898 N, 7.876 W | RRS James Cook JC025 |
| 1169695 | Hydrography time series at depth | 2008-07-05 02:23:00 | 49.898 N, 7.876 W | RRS James Cook JC025 |
| 1169702 | Hydrography time series at depth | 2008-07-05 02:23:00 | 49.898 N, 7.876 W | RRS James Cook JC025 |
| 1169714 | Hydrography time series at depth | 2008-07-05 02:23:00 | 49.898 N, 7.876 W | RRS James Cook JC025 |
| 1169726 | Hydrography time series at depth | 2008-07-05 02:23:00 | 49.898 N, 7.876 W | RRS James Cook JC025 |
| 1169738 | Hydrography time series at depth | 2008-07-05 02:23:00 | 49.898 N, 7.876 W | RRS James Cook JC025 |
| 1169751 | Hydrography time series at depth | 2008-07-05 02:23:00 | 49.898 N, 7.876 W | RRS James Cook JC025 |
| 1169763 | Hydrography time series at depth | 2008-07-05 02:23:00 | 49.898 N, 7.876 W | RRS James Cook JC025 |
| 1169775 | Hydrography time series at depth | 2008-07-05 02:23:00 | 49.898 N, 7.876 W | RRS James Cook JC025 |
| 1169787 | Hydrography time series at depth | 2008-07-05 02:23:00 | 49.898 N, 7.876 W | RRS James Cook JC025 |
| 1169799 | Hydrography time series at depth | 2008-07-05 02:23:00 | 49.898 N, 7.876 W | RRS James Cook JC025 |
| 1169806 | Hydrography time series at depth | 2008-07-05 02:23:00 | 49.898 N, 7.876 W | RRS James Cook JC025 |
| 1169818 | Hydrography time series at depth | 2008-07-05 02:23:00 | 49.898 N, 7.876 W | RRS James Cook JC025 |
| 1169855 | Hydrography time series at depth | 2008-07-05 02:23:00 | 49.898 N, 7.876 W | RRS James Cook JC025 |
| 1170094 | Hydrography time series at depth | 2008-07-05 02:23:00 | 49.898 N, 7.876 W | RRS James Cook JC025 |
| 1170101 | Hydrography time series at depth | 2008-07-05 02:23:00 | 49.898 N, 7.876 W | RRS James Cook JC025 |
| 1170125 | Hydrography time series at depth | 2008-07-05 02:23:00 | 49.898 N, 7.876 W | RRS James Cook JC025 |
| 1170137 | Hydrography time series at depth | 2008-07-05 02:23:00 | 49.898 N, 7.876 W | RRS James Cook JC025 |
| 1170149 | Hydrography time series at depth | 2008-07-05 02:23:00 | 49.898 N, 7.876 W | RRS James Cook JC025 |
| 1170150 | Hydrography time series at depth | 2008-07-05 02:23:00 | 49.898 N, 7.876 W | RRS James Cook JC025 |
| 1170162 | Hydrography time series at depth | 2008-07-05 02:23:00 | 49.898 N, 7.876 W | RRS James Cook JC025 |
| 1170174 | Hydrography time series at depth | 2008-07-05 02:23:00 | 49.898 N, 7.876 W | RRS James Cook JC025 |
| 1170186 | Hydrography time series at depth | 2008-07-05 02:23:00 | 49.898 N, 7.876 W | RRS James Cook JC025 |
| 1170198 | Hydrography time series at depth | 2008-07-05 02:23:00 | 49.898 N, 7.876 W | RRS James Cook JC025 |
| 1170205 | Hydrography time series at depth | 2008-07-05 02:23:00 | 49.898 N, 7.876 W | RRS James Cook JC025 |
| 1170217 | Hydrography time series at depth | 2008-07-05 02:23:00 | 49.898 N, 7.876 W | RRS James Cook JC025 |
| 1170229 | Hydrography time series at depth | 2008-07-05 02:23:00 | 49.898 N, 7.876 W | RRS James Cook JC025 |
| 1170230 | Hydrography time series at depth | 2008-07-05 02:23:00 | 49.898 N, 7.876 W | RRS James Cook JC025 |
| 1170242 | Hydrography time series at depth | 2008-07-05 02:23:00 | 49.898 N, 7.876 W | RRS James Cook JC025 |
| 1170254 | Hydrography time series at depth | 2008-07-05 02:23:00 | 49.898 N, 7.876 W | RRS James Cook JC025 |
| 1170266 | Hydrography time series at depth | 2008-07-05 02:23:00 | 49.898 N, 7.876 W | RRS James Cook JC025 |
| 1112466 | Hydrography time series at depth | 2008-07-05 07:00:01 | 49.898 N, 7.876 W | RRS James Cook JC025 |
| 1112478 | Hydrography time series at depth | 2008-07-05 07:00:01 | 49.898 N, 7.876 W | RRS James Cook JC025 |
| 1112454 | Surface temp/sal | 2008-07-05 07:00:01 | 49.898 N, 7.876 W | RRS James Cook JC025 |
| 1103150 | CTD or STD cast | 2008-07-06 03:41:09 | 49.89833 N, 7.86917 W | RRS James Cook JC025 |
| 1103162 | CTD or STD cast | 2008-07-06 11:34:56 | 49.8975 N, 7.86433 W | RRS James Cook JC025 |
| 1103174 | CTD or STD cast | 2008-07-06 13:30:05 | 49.89783 N, 7.86567 W | RRS James Cook JC025 |
| 1029298 | Hydrography time series at depth | 2008-07-06 13:50:00 | 49.89804 N, 7.8655 W | RRS James Cook JC025 |
| 1029329 | Hydrography time series at depth | 2008-07-06 13:50:00 | 49.89804 N, 7.8655 W | RRS James Cook JC025 |
| 1029354 | Hydrography time series at depth | 2008-07-06 13:50:00 | 49.89804 N, 7.8655 W | RRS James Cook JC025 |
| 1029391 | Hydrography time series at depth | 2008-07-06 13:50:00 | 49.89804 N, 7.8655 W | RRS James Cook JC025 |
| 1029422 | Hydrography time series at depth | 2008-07-06 13:50:00 | 49.89804 N, 7.8655 W | RRS James Cook JC025 |
| 1029458 | Hydrography time series at depth | 2008-07-06 13:50:00 | 49.89804 N, 7.8655 W | RRS James Cook JC025 |
| 1029495 | Hydrography time series at depth | 2008-07-06 13:50:00 | 49.89804 N, 7.8655 W | RRS James Cook JC025 |
| 1029526 | Hydrography time series at depth | 2008-07-06 13:50:00 | 49.89804 N, 7.8655 W | RRS James Cook JC025 |
| 1029563 | Hydrography time series at depth | 2008-07-06 13:50:00 | 49.89804 N, 7.8655 W | RRS James Cook JC025 |
| 1088169 | Hydrography time series at depth | 2008-07-06 13:50:00 | 49.898 N, 7.8655 W | RRS James Cook JC025 |
| 1127453 | Hydrography time series at depth | 2008-07-06 13:50:00 | 49.898 N, 7.8655 W | RRS James Cook JC025 |
| 1127465 | Hydrography time series at depth | 2008-07-06 13:50:00 | 49.898 N, 7.8655 W | RRS James Cook JC025 |
| 1127477 | Hydrography time series at depth | 2008-07-06 13:50:00 | 49.898 N, 7.8655 W | RRS James Cook JC025 |
| 1127489 | Hydrography time series at depth | 2008-07-06 13:50:00 | 49.898 N, 7.8655 W | RRS James Cook JC025 |
| 1127490 | Hydrography time series at depth | 2008-07-06 13:50:00 | 49.898 N, 7.8655 W | RRS James Cook JC025 |
| 1127508 | Hydrography time series at depth | 2008-07-06 13:50:00 | 49.898 N, 7.8655 W | RRS James Cook JC025 |
| 1127521 | Hydrography time series at depth | 2008-07-06 13:50:00 | 49.898 N, 7.8655 W | RRS James Cook JC025 |
| 1127533 | Hydrography time series at depth | 2008-07-06 13:50:00 | 49.898 N, 7.8655 W | RRS James Cook JC025 |
| 1127545 | Hydrography time series at depth | 2008-07-06 13:50:00 | 49.898 N, 7.8655 W | RRS James Cook JC025 |
| 1127557 | Hydrography time series at depth | 2008-07-06 13:50:00 | 49.898 N, 7.8655 W | RRS James Cook JC025 |
| 1127569 | Hydrography time series at depth | 2008-07-06 13:50:00 | 49.898 N, 7.8655 W | RRS James Cook JC025 |
| 1127570 | Hydrography time series at depth | 2008-07-06 13:50:00 | 49.898 N, 7.8655 W | RRS James Cook JC025 |
| 1127582 | Hydrography time series at depth | 2008-07-06 13:50:00 | 49.898 N, 7.8655 W | RRS James Cook JC025 |
| 1127594 | Hydrography time series at depth | 2008-07-06 13:50:00 | 49.898 N, 7.8655 W | RRS James Cook JC025 |
| 1127601 | Hydrography time series at depth | 2008-07-06 13:50:00 | 49.898 N, 7.8655 W | RRS James Cook JC025 |
| 1103186 | CTD or STD cast | 2008-07-06 20:08:12 | 49.89583 N, 7.88183 W | RRS James Cook JC025 |
| 1103198 | CTD or STD cast | 2008-07-07 03:47:08 | 49.90683 N, 7.875 W | RRS James Cook JC025 |
| 1103205 | CTD or STD cast | 2008-07-07 08:39:36 | 49.90033 N, 7.86683 W | RRS James Cook JC025 |
| 1103217 | CTD or STD cast | 2008-07-07 12:00:31 | 49.89267 N, 7.8695 W | RRS James Cook JC025 |
| 1103229 | CTD or STD cast | 2008-07-07 16:00:10 | 49.8985 N, 7.87117 W | RRS James Cook JC025 |
| 1103334 | CTD or STD cast | 2008-07-14 11:03:16 | 49.89767 N, 7.86417 W | RRS James Cook JC025 |
| 1029305 | Hydrography time series at depth | 2008-07-14 11:41:00 | 49.89776 N, 7.86417 W | RRS James Cook JC025 |
| 1029330 | Hydrography time series at depth | 2008-07-14 11:41:00 | 49.89776 N, 7.86417 W | RRS James Cook JC025 |
| 1029366 | Hydrography time series at depth | 2008-07-14 11:41:00 | 49.89776 N, 7.86417 W | RRS James Cook JC025 |
| 1029409 | Hydrography time series at depth | 2008-07-14 11:41:00 | 49.89776 N, 7.86417 W | RRS James Cook JC025 |
| 1029434 | Hydrography time series at depth | 2008-07-14 11:41:00 | 49.89776 N, 7.86417 W | RRS James Cook JC025 |
| 1029471 | Hydrography time series at depth | 2008-07-14 11:41:00 | 49.89776 N, 7.86417 W | RRS James Cook JC025 |
| 1029502 | Hydrography time series at depth | 2008-07-14 11:41:00 | 49.89776 N, 7.86417 W | RRS James Cook JC025 |
| 1029538 | Hydrography time series at depth | 2008-07-14 11:41:00 | 49.89776 N, 7.86417 W | RRS James Cook JC025 |
| 1029575 | Hydrography time series at depth | 2008-07-14 11:41:00 | 49.89776 N, 7.86417 W | RRS James Cook JC025 |
| 1088194 | Hydrography time series at depth | 2008-07-14 11:41:00 | 49.8978 N, 7.8642 W | RRS James Cook JC025 |
| 1127613 | Hydrography time series at depth | 2008-07-14 11:41:00 | 49.8978 N, 7.8642 W | RRS James Cook JC025 |
| 1127625 | Hydrography time series at depth | 2008-07-14 11:41:00 | 49.8978 N, 7.8642 W | RRS James Cook JC025 |
| 1127637 | Hydrography time series at depth | 2008-07-14 11:41:00 | 49.8978 N, 7.8642 W | RRS James Cook JC025 |
| 1127649 | Hydrography time series at depth | 2008-07-14 11:41:00 | 49.8978 N, 7.8642 W | RRS James Cook JC025 |
| 1127662 | Hydrography time series at depth | 2008-07-14 11:41:00 | 49.8978 N, 7.8642 W | RRS James Cook JC025 |
| 1127674 | Hydrography time series at depth | 2008-07-14 11:41:00 | 49.8978 N, 7.8642 W | RRS James Cook JC025 |
| 1127686 | Hydrography time series at depth | 2008-07-14 11:41:00 | 49.8978 N, 7.8642 W | RRS James Cook JC025 |
| 1127698 | Hydrography time series at depth | 2008-07-14 11:41:00 | 49.8978 N, 7.8642 W | RRS James Cook JC025 |
| 1127705 | Hydrography time series at depth | 2008-07-14 11:41:00 | 49.8978 N, 7.8642 W | RRS James Cook JC025 |
| 1127717 | Hydrography time series at depth | 2008-07-14 11:41:00 | 49.8978 N, 7.8642 W | RRS James Cook JC025 |
| 1127729 | Hydrography time series at depth | 2008-07-14 11:41:00 | 49.8978 N, 7.8642 W | RRS James Cook JC025 |
| 1127730 | Hydrography time series at depth | 2008-07-14 11:41:00 | 49.8978 N, 7.8642 W | RRS James Cook JC025 |
| 1127742 | Hydrography time series at depth | 2008-07-14 11:41:00 | 49.8978 N, 7.8642 W | RRS James Cook JC025 |
| 1127754 | Hydrography time series at depth | 2008-07-14 11:41:00 | 49.8978 N, 7.8642 W | RRS James Cook JC025 |
| 1103346 | CTD or STD cast | 2008-07-14 18:07:24 | 49.90217 N, 7.88317 W | RRS James Cook JC025 |
| 1103506 | CTD or STD cast | 2008-07-21 06:37:49 | 49.89333 N, 7.87283 W | RRS James Cook JC025 |
| 1029317 | Hydrography time series at depth | 2008-07-21 07:30:00 | 49.8934 N, 7.87279 W | RRS James Cook JC025 |
| 1029342 | Hydrography time series at depth | 2008-07-21 07:30:00 | 49.8934 N, 7.87279 W | RRS James Cook JC025 |
| 1029378 | Hydrography time series at depth | 2008-07-21 07:30:00 | 49.8934 N, 7.87279 W | RRS James Cook JC025 |
| 1029410 | Hydrography time series at depth | 2008-07-21 07:30:00 | 49.8934 N, 7.87279 W | RRS James Cook JC025 |
| 1029446 | Hydrography time series at depth | 2008-07-21 07:30:00 | 49.8934 N, 7.87279 W | RRS James Cook JC025 |
| 1029483 | Hydrography time series at depth | 2008-07-21 07:30:00 | 49.8934 N, 7.87279 W | RRS James Cook JC025 |
| 1029514 | Hydrography time series at depth | 2008-07-21 07:30:00 | 49.8934 N, 7.87279 W | RRS James Cook JC025 |
| 1029551 | Hydrography time series at depth | 2008-07-21 07:30:00 | 49.8934 N, 7.87279 W | RRS James Cook JC025 |
| 1029587 | Hydrography time series at depth | 2008-07-21 07:30:00 | 49.8934 N, 7.87279 W | RRS James Cook JC025 |
| 1088201 | Hydrography time series at depth | 2008-07-21 07:30:00 | 49.8934 N, 7.8728 W | RRS James Cook JC025 |
| 1127766 | Hydrography time series at depth | 2008-07-21 07:30:00 | 49.8934 N, 7.8728 W | RRS James Cook JC025 |
| 1127778 | Hydrography time series at depth | 2008-07-21 07:30:00 | 49.8934 N, 7.8728 W | RRS James Cook JC025 |
| 1127791 | Hydrography time series at depth | 2008-07-21 07:30:00 | 49.8934 N, 7.8728 W | RRS James Cook JC025 |
| 1127809 | Hydrography time series at depth | 2008-07-21 07:30:00 | 49.8934 N, 7.8728 W | RRS James Cook JC025 |
| 1127810 | Hydrography time series at depth | 2008-07-21 07:30:00 | 49.8934 N, 7.8728 W | RRS James Cook JC025 |
| 1127822 | Hydrography time series at depth | 2008-07-21 07:30:00 | 49.8934 N, 7.8728 W | RRS James Cook JC025 |
| 1127834 | Hydrography time series at depth | 2008-07-21 07:30:00 | 49.8934 N, 7.8728 W | RRS James Cook JC025 |
| 1127846 | Hydrography time series at depth | 2008-07-21 07:30:00 | 49.8934 N, 7.8728 W | RRS James Cook JC025 |
| 1127858 | Hydrography time series at depth | 2008-07-21 07:30:00 | 49.8934 N, 7.8728 W | RRS James Cook JC025 |
| 1127871 | Hydrography time series at depth | 2008-07-21 07:30:00 | 49.8934 N, 7.8728 W | RRS James Cook JC025 |
| 1127883 | Hydrography time series at depth | 2008-07-21 07:30:00 | 49.8934 N, 7.8728 W | RRS James Cook JC025 |
| 1127895 | Hydrography time series at depth | 2008-07-21 07:30:00 | 49.8934 N, 7.8728 W | RRS James Cook JC025 |
| 1127902 | Hydrography time series at depth | 2008-07-21 07:30:00 | 49.8934 N, 7.8728 W | RRS James Cook JC025 |
| 1127914 | Hydrography time series at depth | 2008-07-21 07:30:00 | 49.8934 N, 7.8728 W | RRS James Cook JC025 |
| 1127926 | Hydrography time series at depth | 2008-07-21 07:30:00 | 49.8934 N, 7.8728 W | RRS James Cook JC025 |
| 1103518 | CTD or STD cast | 2008-07-21 13:17:54 | 49.9025 N, 7.87683 W | RRS James Cook JC025 |
| 1103531 | CTD or STD cast | 2008-07-21 20:10:17 | 49.89533 N, 7.88067 W | RRS James Cook JC025 |
| 1103543 | CTD or STD cast | 2008-07-22 10:05:11 | 49.89517 N, 7.87967 W | RRS James Cook JC025 |
