Metadata Report for BODC Series Reference Number 1761313
Metadata Summary
Problem Reports
Data Access Policy
Narrative Documents
Project Information
Data Activity or Cruise Information
Fixed Station Information
BODC Quality Flags
SeaDataNet Quality Flags
Metadata Summary
Data Description |
|||||||||||||||||||||||||||||||||||||||||||||||||||||||||
|
|||||||||||||||||||||||||||||||||||||||||||||||||||||||||
Data Identifiers |
|||||||||||||||||||||||||||||||||||||||||||||||||||||||||
|
|||||||||||||||||||||||||||||||||||||||||||||||||||||||||
Time Co-ordinates(UT) |
|||||||||||||||||||||||||||||||||||||||||||||||||||||||||
|
|||||||||||||||||||||||||||||||||||||||||||||||||||||||||
Spatial Co-ordinates | |||||||||||||||||||||||||||||||||||||||||||||||||||||||||
|
|||||||||||||||||||||||||||||||||||||||||||||||||||||||||
Parameters |
|||||||||||||||||||||||||||||||||||||||||||||||||||||||||
|
|||||||||||||||||||||||||||||||||||||||||||||||||||||||||
|
|||||||||||||||||||||||||||||||||||||||||||||||||||||||||
Problem Reports
No Problem Report Found in the Database
OSMOSIS RRS James Cook JC090 Meteorology Quality Report
Wind sensors
There are areas in this time series when the true wind speed show signs of shielding. Shielding occurs when the sensor is partially blocked from the wind by the ship. This is particularly noticeable during 8:30:00 to 15:50:00 on 14/09/2013.
Light sensors
Both PAR and TIR sensors exhibited negative readings in the dark. This phenomena is known to be caused by radiation loss at night. Night time negative values were flagged suspect to preserve the data value. (BODC assessment)
Data Access Policy
Open Data
These data have no specific confidentiality restrictions for users. However, users must acknowledge data sources as it is not ethical to publish data without proper attribution. Any publication or other output resulting from usage of the data should include an acknowledgment.
If the Information Provider does not provide a specific attribution statement, or if you are using Information from several Information Providers and multiple attributions are not practical in your product or application, you may consider using the following:
"Contains public sector information licensed under the Open Government Licence v1.0."
Narrative Documents
Gill Instruments Windsonic Anemometer
The Gill Windsonic is a 2-axis ultrasonic wind sensor that monitors wind speed and direction using four transducers. The time taken for an ultrasonic pulse to travel from the North to the South transducers is measured and compared with the time for a pulse to travel from South to North. Travel times between the East and West transducers are similarly compared. The wind speed and direction are calculated from the differences in the times of flight along each axis. This calculation is independent of environmental factors such as temperature.
Specifications
| Ultrasonic output rate | 0.25, 0.5, 1, 2 or 4 Hz |
| Operating Temperature | -35 to 70°C |
| Operating Humidity | < 5 to 100% RH |
| Anemometer start up time | < 5 s |
| Wind speed | |
| Range | 0 to 60 m s-1 |
| Accuracy | ± 2% at 2 m s-1 |
| Resolution | 0.01 m s-1 |
| Response time | 0.25 s |
| Threshold | 0.01 m s-1 |
| Wind direction | |
| Range | 0 to 359° |
| Accuracy | ± 3° at 12 m s-1 |
| Resolution | 1° |
| Response time | 0.25 s |
Further details can be found in the manufacturer's specification sheet.
Kipp and Zonen Pyranometer Model CM6B
The CM6B pyranometer is intended for routine global solar radiation measurement research on a level surface. The CM6B features a sixty-four thermocouple junction (series connected) sensing element. The sensing element is coated with a highly stable carbon based non-organic coating, which delivers excellent spectral absorption and long term stability characteristics. The sensing element is housed under two concentric fitting Schott K5 glass domes.
Specifications
| Dimensions (W x H) | 150.0 mm x 91.5 mm |
|---|---|
| Weight | 850 grams |
| Operating Temperature | -40°C to +80°C |
| Spectral Range | 305 - 2800 nm (50% points) |
| Sensitivity | 9 -15 µV/W/m2 |
| Impedance (nominal) | 70 - 100 ohm |
| Response Time (95%) | 30 sec |
| Non-linearity | < ± 1.2% (<1000 W/m2) |
| Temperature dependence of sensitivity | < ± 2% (-10 to +40°C) |
| Zero-offset due to temperature changes | < ± 4 W/m2 at 5 K/h temperature change |
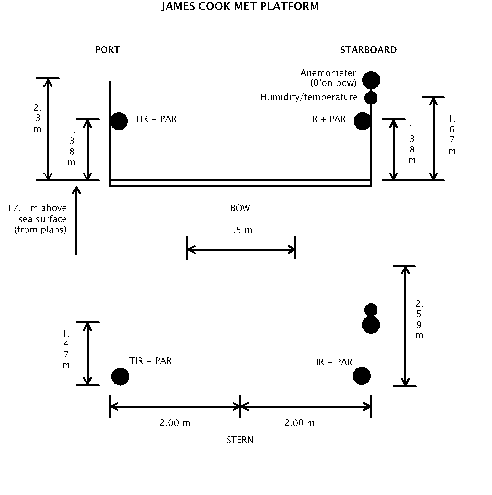
OSMOSIS RRS James Cook JC090 Meteorology Instrumentation
The meteorological suite of sensors were located on the foremast, approximately 20 m above sea level. The anemometer orientation was 0° on the bow.
| Manufacturer | Model | Serial number | Last manufacturer's calibration date | Comments |
| Skye | SKE 510 | 38884 | 13/08/2012 | Starboard |
| Skye | SKE 510 | 28562 | 22/09/2011 | Port |
| Kipp and Zonen | CM 6B | 994132 | 10/07/2012 | Port |
| Kipp and Zonen | CM 6B | 994133 | 10/07/2012 | Starboard |
| Gill | Windsonic | 064537 | no calibration | - |
| Vaisala | HMP45 | B4950010 | 06/07/2013 | Air Temperature and Relative Humidity |
| Vaisala | PTB100 | U1420016 | 21/3/2013 | Air Pressure |
Skye Instruments PAR Energy Sensor Model SKE 510
The SKE 510 is suitable for measuring photosynthetically active radiation (PAR) from natural or artificial light sources. The sensor is fully waterproof and guaranteed submersible to 4m depth, and indoor versions are also available.
The instrument uses a blue-enhanced planar diffused silicon detector to measure energy (in W m-2) over the 400-700 nm waveband. It has a cosine-corrected head and a square spectral response. The sensor can operate over a temperature range of -35 to 70 °C and a humidity range of 0-100% RH.
Specifications
| Sensitivity (current) | 1.5µA or 100 W m-2 |
|---|---|
| Sensitivity (voltage) | 1mV or 100 W m-2 |
| Working Range | 0-5000 W m-2 |
| Linearity error | 0.2% |
| Absolute calibration error | typ. less than 3% 5% max |
| Response time - voltage output | 10 ns |
| Cosine error | 3% |
| Azimuth error | less than 1% |
| Temperature co-efficient | ±0.1% per °C |
| Internal resistance - voltage output | c. 300 ohms |
| Longterm stability | ±2% |
| Material | Dupont 'Delrin' |
| Dimensions | 34 mm diameter 38mm height |
| Cable | 2 core screened 7 - 2 - 2C |
| Sensor Passband | 400 - 700 nm |
| Detector | Silicon photocell |
| Filters | Glass type and/or metal interference |
Vaisala Analog Barometers Models PTB100 (A), (B) and PTB101 (B), (C)
The PTB 100 series analog barometers are designed both for accurate barometric measurements at room temperature and for general environmental pressure monitoring over a wide temperature range. The long-term stability of the barometer minimizes the need for field adjustment in many applications.
Physical Specifications
| Size | 97 x 60 x 22 mm |
|---|---|
| Weight | 85g |
The barometers use the BAROCAP* silicon capacitive absolute pressure sensor developed by Vaisala for barometric pressure measurements. The BAROCAP* sensor combines the elasticity characteristics and mechanical stability of a single-crystal silicon with the proven capacitive detection principle.
Sensor Specifications
| Model Number | Pressure Range (mbar) | Temperature Range (°C) | Humidity Range | Total Accuracy | |
|---|---|---|---|---|---|
| PTB100A | 800 to 1060 | -40 to +60 | non-condensing | +20 °C | ± 0.3 mbar |
| 0 to +40 °C | ± 1.0 mbar | ||||
| -20 to +45 °C | ± 1.5 mbar | ||||
| -40 to +60 °C | ± 2.5 mbar | ||||
| PTB100B | 600 to 1060 | -40 to +60 | non-condensing | +20 °C | ± 0.5 mbar |
| 0 to +40 °C | ± 1.5 mbar | ||||
| -20 to +45 °C | ± 2.0 mbar | ||||
| -40 to +60 °C | ± 3.0 mbar | ||||
| PTB101B | 600 to 1060 | -40 to +60 | non-condensing | +20 °C | ± 0.5 mbar |
| 0 to +40 °C | ± 1.5 mbar | ||||
| -20 to +45 °C | ± 2.0 mbar | ||||
| -40 to +60 °C | ± 3.0 mbar | ||||
| PTB101C | 900 to 1100 | -40 to +60 | non-condensing | +20 °C | ± 0.3 mbar |
| 0 to +40 °C | ± 1.0 mbar | ||||
| -20 to +45 °C | ± 1.5 mbar | ||||
| -40 to +60 °C | ± 2.5 mbar | ||||
* BAROCAP is a registered trademark of Vaisala
Vaisala Temperature and Relative Humidity HMP Sensors
A family of sensors and instruments (sensors plus integral displays or loggers) for the measurement of air temperature and relative humidity. All are based on a probe containing a patent (HUMICAP) capacitive thin polymer film capacitanece humidity sensor and a Pt100 platinum resistance thermometer. The probes are available with a wide range of packaging, cabling and interface options all of which have designations of the form HMPnn or HMPnnn such as HMP45 and HMP230. Vaisala sensors are incorporated into weather stations and marketed by Campbell Scientific.
All versions operate at up to 100% humidity. Operating temperature ranges vary between models, allowing users to select the version best suited to their requirements.
Further details can be found in the manufacturer's specification sheets for the HMP 45 series, HMP 70 series and HMP 230 series.
OSMOSIS RRS James Cook JC090 Meteorology processing procedures
Originator's Data Processing
Data was extracted from TECHSAS MET-JC-SM_JC1.SURFMETv2 data stream each day. Time was converted from TECHSAS days to seconds from time origin (1/1/2013 0:0:0). Relative wind speed and direction was converted to true (Earth coordinate) wind speed and direction using processed ship navigation data from the position-Applanix_GPS_JC1.gps TECHSAS stream. U (eastward) and V (northwards) wind velocity components were calculated.
File delivered to BODC| Filename | Content description | Format | Interval | Start date/time (UTC) | End date/time (UTC) | Comments |
| Light_JC_SM_JC1_SURFMETv2 | raw meteorology data | Matlab | <1 second | 01/09/2013 12:37:00 | 14/09/2013 23:59:00 | raw PAR and TIR |
| MET_JC_SM_JC1_SURFMETv2 | raw meteorology data | Matlab | <1 second | 01/09/2013 12:37:00 | 14/09/2013 23:59:00 | Relative wind speed and direction |
BODC Data Processing
The MET_JC_SM_JC1_SURFMETv2 data file included true wind speed and direction but these were not transferred. This is because absolute wind speed and direction were derived by BODC from the relative data. The data were reformatted to NetCDF using BODC standard data banking procedures. The following table shows how variables within the file were mapped to appropriate BODC parameter codes:
Light_JC_SM_JC1_SURFMETv2
| Originator's variable | Originator's units | Description | BODC Code | BODC Units | Unit conversion | Comments |
| pressure | mbar | Pressure (measured variable) exerted by the atmosphere | CAPHZZ01 | Millibars | - | - |
| port_par | volt x 105 | Instrument output (voltage) by port-mounted PAR cosine-collector radiometer | DVLTRPSD | volts | /10-5 | - |
| starb_par | volt x 105 | Instrument output (voltage) by starboard-mounted PAR cosine-collector radiometer | DVLTRSSD | volts | /10-5 | - |
| port_tir | volt x 105 | Instrument output (voltage) by port-mounted pyranometer | CVLTRP01 | volts | /10-5 | |
| starb_tir | volt x 105 | Instrument output (voltage) by starboard-mounted pyranometer | CVLTRS01 | volts | /10-5 | - |
MET_JC_SM_JC1_SURFMETv2
| Originator's variable | Originator's units | Description | BODC Code | BODC Units | Unit conversion | Comments |
| rel_wind_spd | m/s | Wind speed (relative to moving platform) in the atmosphere by in-situ anemometer | ERWSSS01 | m/s | - | - |
| rel_wind_dir | degrees | Wind direction (relative to moving platform) in the atmosphere by in-situ anemometer | ERWDSS01 | degrees | - | 0° on the bow |
| air_temp | degrees C | Temperature of the atmosphere by dry bulb thermometer | CDTASS01 | degrees C | - | - |
| humidity | % | Relative humidity of the atmosphere by humidity sensor | CRELSS01 | % | - | - |
| true_wind_dir | degrees | Wind from direction in the atmosphere by in-situ anemometer | EWDASS01 | degrees | - | derived by BODC from relative. |
| true_wind_spd | m/s | Wind speed in the atmosphere by in-situ anemometer | EWSBSS01 | m/s | - | derived by BODC from relative. |
Screening
All the reformatted data were visualised using the in-house EDSERPLO software. Suspect data were marked by adding an appropriate quality control flag.
Calibration
Absolute wind speed and direction
Relative wind speed and direction were corrected for the ship's heading and speed using the POS MV gyro heading, ship velocities (calculated at BODC from the main positional channels) and an anemometer orientation of 0° on the bow.
PAR and TIR
The following manufacturer's calibrations were applied to the PAR and TIR light sensors using:
y (W m-2) = (a x 106)/b
where 'a' is the raw data in volts and 'b' is the calibration offset (µV per W m-2) as shown below.
| Sensor | Serial no | location | offset (µV per W m-2) |
| PAR | 28562 | port | 10.81 |
| PAR | 38884 | starboard | 9.530 |
| TIR | 994132 | port | 11.41 |
| TIR | 994133 | starboard | 9.67 |
Subsequently, as no offset could be identified, the maximum value of the port-side and starboard-side sensor pairs were calculated into a new data channels.
Project Information
Ocean Surface Mixing, Ocean Sub-mesoscale Interaction Study (OSMOSIS)
Background
The Ocean Surface Mixing, Ocean Sub-mesoscale Interaction Study (OSMOSIS) consortium was funded to deliver NERC's Ocean Surface Boundary Layer (OSBL) programme. Commencing in 2011, this multiple year study will combine traditional observational techniques, such as moorings and CTDs, with the latest autonomous sampling technologies (including ocean gliders), capable of delivering near real-time scientific measurements through the water column.
The OSMOSIS consortium aims to improve understanding of the OSBL, the interface between the atmosphere and the deeper ocean. This layer of the water column is thought to play a pivotal role in global climate and the productivity of our oceans.
OSMOSIS involves collaborations between scientists at various universities (Reading, Oxford, Bangor, Southampton and East Anglia) together with researchers at the National Oceanography Centre (NOC), Scottish Association for Marine Science (SAMS) and Plymouth Marine Laboratory (PML). In addition, there are a number of project partners linked to the consortium.
Scientific Objectives
- The primary goal of the fieldwork component of OSMOSIS is to obtain a year-long time series of the properties of the OSBL and its controlling 3D physical processes. This is achieved with an array of moorings (two nested clusters of 4 moorings, each centred around a central mooring) and gliders deployed near the Porcupine Abyssal Plain (PAP) observatory. Data obtained from this campaign will help with the understanding of these processes and subsequent development of associated parameterisations.
- OSMOSIS will attempt to create parameterisations for the processes which determine the evolving stratification and potential vorticity budgets of the OSBL.
- The overall legacy of OSMOSIS will be to develop new (physically based and observationally supported) parameterisations of processes that deepen and shoal the OSBL, and to implement and evaluate these parameterisations in a state-of-the-art global coupled climate model, facilitating improved weather and climate predictions.
Fieldwork
Three cruises are directly associated with the OSMOSIS consortium. Preliminary exploratory work in the Clyde Sea (September 2011) to hone techniques and strategies, followed by a mooring deployment and recovery cruise in the vicinity of the Porcupine Abyssal Plain (PAP) observatory (in late Summer 2012 and 2013 respectively). Additional opportunist ship time being factored in to support the ambitious glider operations associated with OSMOSIS.
Instrumentation
Types of instrumentation and measurements associated with the OSMOSIS observational campaign:
- Ocean gliders
- Wave rider buoys
- Towed SeaSoar surveys
- Microshear measurements
- Moored current meters, conductivity-temperature sensors and ADCPs
- Traditional shipboard measurements (including CTD, underway, discrete nutrients, LADCP, ADCP).
Contacts
| Collaborator | Organisation |
|---|---|
| Prof. Stephen Belcher | University of Reading, U.K |
| Dr. Alberto C Naveira Garabato | University of Southampton, U.K |
Data Activity or Cruise Information
Cruise
| Cruise Name | JC090 |
| Departure Date | 2013-08-31 |
| Arrival Date | 2013-09-16 |
| Principal Scientist(s) | Alberto C Naveira Garabato (University of Southampton School of Ocean and Earth Science) |
| Ship | RRS James Cook |
Complete Cruise Metadata Report is available here
Fixed Station Information
No Fixed Station Information held for the Series
BODC Quality Control Flags
The following single character qualifying flags may be associated with one or more individual parameters with a data cycle:
| Flag | Description |
|---|---|
| Blank | Unqualified |
| < | Below detection limit |
| > | In excess of quoted value |
| A | Taxonomic flag for affinis (aff.) |
| B | Beginning of CTD Down/Up Cast |
| C | Taxonomic flag for confer (cf.) |
| D | Thermometric depth |
| E | End of CTD Down/Up Cast |
| G | Non-taxonomic biological characteristic uncertainty |
| H | Extrapolated value |
| I | Taxonomic flag for single species (sp.) |
| K | Improbable value - unknown quality control source |
| L | Improbable value - originator's quality control |
| M | Improbable value - BODC quality control |
| N | Null value |
| O | Improbable value - user quality control |
| P | Trace/calm |
| Q | Indeterminate |
| R | Replacement value |
| S | Estimated value |
| T | Interpolated value |
| U | Uncalibrated |
| W | Control value |
| X | Excessive difference |
SeaDataNet Quality Control Flags
The following single character qualifying flags may be associated with one or more individual parameters with a data cycle:
| Flag | Description |
|---|---|
| 0 | no quality control |
| 1 | good value |
| 2 | probably good value |
| 3 | probably bad value |
| 4 | bad value |
| 5 | changed value |
| 6 | value below detection |
| 7 | value in excess |
| 8 | interpolated value |
| 9 | missing value |
| A | value phenomenon uncertain |
| B | nominal value |
| Q | value below limit of quantification |
