Metadata Report for BODC Series Reference Number 1814850
Metadata Summary
Problem Reports
Data Access Policy
Narrative Documents
Project Information
Data Activity or Cruise Information
Fixed Station Information
BODC Quality Flags
SeaDataNet Quality Flags
Metadata Summary
Data Description |
|||||||||||||||||||||||||||||||||||||||||||||||||||||||||||||||||||||||||||||||||
|
|||||||||||||||||||||||||||||||||||||||||||||||||||||||||||||||||||||||||||||||||
Data Identifiers |
|||||||||||||||||||||||||||||||||||||||||||||||||||||||||||||||||||||||||||||||||
|
|||||||||||||||||||||||||||||||||||||||||||||||||||||||||||||||||||||||||||||||||
Time Co-ordinates(UT) |
|||||||||||||||||||||||||||||||||||||||||||||||||||||||||||||||||||||||||||||||||
|
|||||||||||||||||||||||||||||||||||||||||||||||||||||||||||||||||||||||||||||||||
Spatial Co-ordinates | |||||||||||||||||||||||||||||||||||||||||||||||||||||||||||||||||||||||||||||||||
|
|||||||||||||||||||||||||||||||||||||||||||||||||||||||||||||||||||||||||||||||||
Parameters |
|||||||||||||||||||||||||||||||||||||||||||||||||||||||||||||||||||||||||||||||||
|
|||||||||||||||||||||||||||||||||||||||||||||||||||||||||||||||||||||||||||||||||
|
|||||||||||||||||||||||||||||||||||||||||||||||||||||||||||||||||||||||||||||||||
Problem Reports
No Problem Report Found in the Database
RRS James Cook cruise JC142 meteorology quality control report
Light sensors
All PAR and TIR channels display consistent negative readings during night time. This most likely results from excessive loss of radiation after sunset, which suggests that day-time data recorded during cloud cover should also be treated with caution. Another explanation would be that outdated calibrations added an offset to the data. All negative PAR and TIR data were flagged. (BODC assessment)
A small offset between the starboard and port PAR sensor pair was observed. The offset was not considered severe and the data were not flagged. Negative night time values were flagged suspect and are due to night time radiation loss from the sensors. (BODC assessment)
Wind sensors
There are areas in this time series when the met data show signs of wind shielding, predominantly when the wind was blowing from 130-220° from the bow. Shielding occurs when the sensor is partially blocked from the wind by the ship. All met data (apart from light) were flagged appropriately. (BODC assessment)
There are areas in this time series when the met data show signs of wind acceleration, predominantly when the wind was blowing from 260-300° from the bow. An acceleration in wind speed may occur when the ship changes direction or by reflection off the ship's superstructure. All met data (apart from light) were flagged appropriately where an affect was clearly seen. (BODC assessment)
Data Access Policy
Open Data
These data have no specific confidentiality restrictions for users. However, users must acknowledge data sources as it is not ethical to publish data without proper attribution. Any publication or other output resulting from usage of the data should include an acknowledgment.
If the Information Provider does not provide a specific attribution statement, or if you are using Information from several Information Providers and multiple attributions are not practical in your product or application, you may consider using the following:
"Contains public sector information licensed under the Open Government Licence v1.0."
Narrative Documents
Gill Instruments Windsonic Anemometer
The Gill Windsonic is a 2-axis ultrasonic wind sensor that monitors wind speed and direction using four transducers. The time taken for an ultrasonic pulse to travel from the North to the South transducers is measured and compared with the time for a pulse to travel from South to North. Travel times between the East and West transducers are similarly compared. The wind speed and direction are calculated from the differences in the times of flight along each axis. This calculation is independent of environmental factors such as temperature.
Specifications
| Ultrasonic output rate | 0.25, 0.5, 1, 2 or 4 Hz |
| Operating Temperature | -35 to 70°C |
| Operating Humidity | < 5 to 100% RH |
| Anemometer start up time | < 5 s |
| Wind speed | |
| Range | 0 to 60 m s-1 |
| Accuracy | ± 2% at 2 m s-1 |
| Resolution | 0.01 m s-1 |
| Response time | 0.25 s |
| Threshold | 0.01 m s-1 |
| Wind direction | |
| Range | 0 to 359° |
| Accuracy | ± 3° at 12 m s-1 |
| Resolution | 1° |
| Response time | 0.25 s |
Further details can be found in the manufacturer's specification sheet.
Kipp and Zonen Pyranometer Model CM6B
The CM6B pyranometer is intended for routine global solar radiation measurement research on a level surface. The CM6B features a sixty-four thermocouple junction (series connected) sensing element. The sensing element is coated with a highly stable carbon based non-organic coating, which delivers excellent spectral absorption and long term stability characteristics. The sensing element is housed under two concentric fitting Schott K5 glass domes.
Specifications
| Dimensions (W x H) | 150.0 mm x 91.5 mm |
|---|---|
| Weight | 850 grams |
| Operating Temperature | -40°C to +80°C |
| Spectral Range | 305 - 2800 nm (50% points) |
| Sensitivity | 9 -15 µV/W/m2 |
| Impedance (nominal) | 70 - 100 ohm |
| Response Time (95%) | 30 sec |
| Non-linearity | < ± 1.2% (<1000 W/m2) |
| Temperature dependence of sensitivity | < ± 2% (-10 to +40°C) |
| Zero-offset due to temperature changes | < ± 4 W/m2 at 5 K/h temperature change |
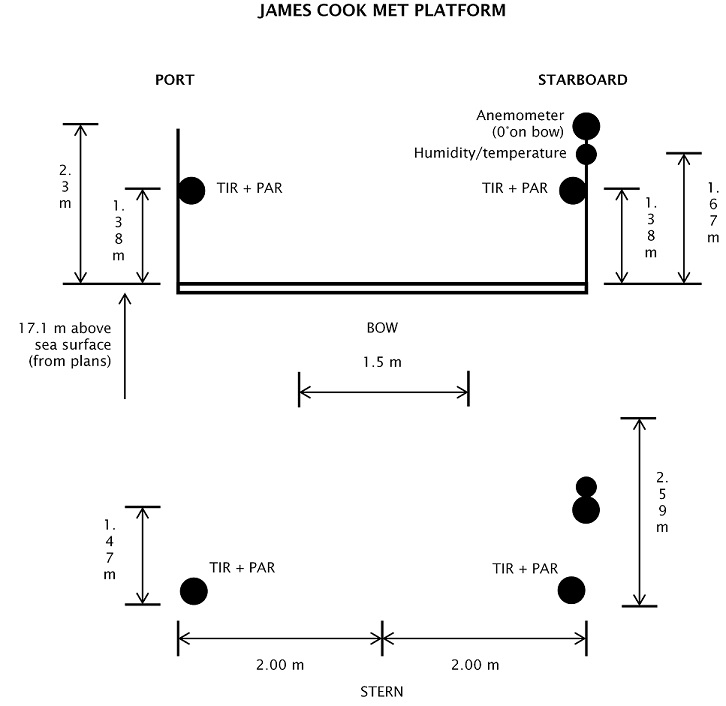
RRS James Cook cruise JC142 meteorology instrumentation
Instrumentation
The meteorological suite of sensors was located on the forecastle deck, at approximately 17.1 m above sea level. The anemometer orientation was 0° on the bow.
| Manufacturer | Model | Serial number | Last manufacturer's calibration date | Comments |
| Skye | SKE 510 | 28559 | 11/09/2015 | Port |
| Skye | SKE 510 | 28560 | 11/09/2015 | Starboard |
| Kipp and Zonen | CM6B | 047463 | 15/06/2015 | Starboard |
| Kipp and Zonen | CM6B | 047462 | 01/06/2015 | Port |
| Gill | Windsonic | 064537 | - | No calibration required |
| Vaisala | Humidity and Temperature Probe HMP45A | E105502 | 18/07/2016 | No calibration required |
| Vaisala | PTB110 Barometer Air pres | J0710001 | 12/04/2016 | No calibration required |
 |
Skye Instruments PAR Energy Sensor Model SKE 510
The SKE 510 is suitable for measuring photosynthetically active radiation (PAR) from natural or artificial light sources. The sensor is fully waterproof and guaranteed submersible to 4m depth, and indoor versions are also available.
The instrument uses a blue-enhanced planar diffused silicon detector to measure energy (in W m-2) over the 400-700 nm waveband. It has a cosine-corrected head and a square spectral response. The sensor can operate over a temperature range of -35 to 70 °C and a humidity range of 0-100% RH.
Specifications
| Sensitivity (current) | 1.5µA or 100 W m-2 |
|---|---|
| Sensitivity (voltage) | 1mV or 100 W m-2 |
| Working Range | 0-5000 W m-2 |
| Linearity error | 0.2% |
| Absolute calibration error | typ. less than 3% 5% max |
| Response time - voltage output | 10 ns |
| Cosine error | 3% |
| Azimuth error | less than 1% |
| Temperature co-efficient | ±0.1% per °C |
| Internal resistance - voltage output | c. 300 ohms |
| Longterm stability | ±2% |
| Material | Dupont 'Delrin' |
| Dimensions | 34 mm diameter 38mm height |
| Cable | 2 core screened 7 - 2 - 2C |
| Sensor Passband | 400 - 700 nm |
| Detector | Silicon photocell |
| Filters | Glass type and/or metal interference |
Vaisala PTB110 barometer
An industrial, analog barometer which uses a silicon capacitive sensor (BAROCAP). The sensor produces either frequency or voltage output and is mountable on a (35 mm wide) DIN rail.
Operating ranges (1 hPa = 1 mbar)
| Pressure ranges | 500 ... 1100 hPa 600 ... 1100 hPa 800 ... 1100 hPa 800 ... 1060 hPa 600 ... 1060 hPa |
| Temperature range | -40 ... +60 °C (-40 ... +140 °F) |
| Humidity range | non-condensing |
General
| Output voltage | 0 ... 2.5 VDC 0 ... 5 VDC |
| Output frequency | 500 ... 1100 Hz |
| Resolution | 0.1 hPa |
Accuracy
| Linearity* | ±0.25 hPa |
| Hysteresis* | ±0.03 hPa |
| Repeatability* | ±0.03 hPa |
| Pressure calibration uncertainty** | ±0.15 hPa |
| Accuracy at +20 °C*** | ±0.3 hPa |
| Total accuracy at: | |
| +15 ... +25 °C (+59 ... +77 °F) 0 ... +40 °C (+32 ... +104 °F) -20 ... +45 °C (-4 ... +113 °F) -40 ... +60 °C (-40 ... +140 °F) | ±0.3 hPa ±0.6 hPa ±1.0 hPa ±1.5 hPa |
* Defined as ±2 standard deviation limits of end-point non-linearity, hysteresis error or repeatability error.
** Defined as ±2 standard deviation limits of inaccuracy of the working standard including traceability to NIST.
*** Defined as the root sum of the squares (RSS) of end-point non-linearity, hysteresis error, repeatability error and calibration uncertainty at room temperature when using voltage output.
More detailed information can be found in the manufacturer's data sheet and user's guide.
Vaisala Temperature and Relative Humidity HMP Sensors
A family of sensors and instruments (sensors plus integral displays or loggers) for the measurement of air temperature and relative humidity. All are based on a probe containing a patent (HUMICAP) capacitive thin polymer film capacitanece humidity sensor and a Pt100 platinum resistance thermometer. The probes are available with a wide range of packaging, cabling and interface options all of which have designations of the form HMPnn or HMPnnn such as HMP45 and HMP230. Vaisala sensors are incorporated into weather stations and marketed by Campbell Scientific.
All versions operate at up to 100% humidity. Operating temperature ranges vary between models, allowing users to select the version best suited to their requirements.
Further details can be found in the manufacturer's specification sheets for the HMP 45 series, HMP 70 series and HMP 230 series.
RRS James Cook cruise JC142 meteorology data processing procedures
Originator's Data Processing
The data were logged by the TECHSAS (TECHnical and Scientific sensors Acquisition System) version 5.11 data logging system into daily NetCDF files which were provided to BODC for processing. Data was additionally logged into the RVS Level-C format which have been archived at BODC.
Files delivered to BODC
| Filename | Content description | Format | Interval | Start date/time (UTC) | End date/time (UTC) | Comments |
| *-*-MET-JC-SM_JC1.SURFMETv2 | Air temperature, humidity, relative wind speed, relative wind direction | NetCDF | ~ 1 sec. | 29/10/2016 10:45:38 | 08/12/2016 09:22:59 | |
| *-*-Light-JC-SM_JC1.SURFMETv2 | Air pressure, PAR, TIR | NetCDF | ~ 1 sec. | 29/10/2016 10:45:38 | 08/12/2016 09:22:59 |
BODC Data Processing
The data were reformatted to BODC internal format using standard banking procedures. Data were averaged at 60 second intervals. The following table shows how variables within the file were mapped to appropriate BODC parameter codes:
y*-*-MET-JC-SM_JC1.SURFMETv2
| Originator's variable | Originator's units | Description | BODC Code | BODC Units | Unit conversion | Comments |
| direct | degrees | Apparent wind direction | ERWDSS01 | degrees | none | |
| speed | m/s | Apparent wind speed | ERWSSS01 | m/s | none | |
| airtemp | degree celsius | Air temperature | CDTAZZ01 | degrees celsius | none | |
| humid | % | Relative air humidity | CRELZZ01 | % | none | |
| time | days since 1899-12-30 00:00:00 UTC | Acquisition time | Not transferred |
*-*-Light-JC-SM_JC1.SURFMETv2
| Originator's variable | Originator's units | Description | BODC Code | BODC Units | Unit conversion | Comments |
| ptir | Volt x 105 | Port total irradiance | CVLTRP01 | Volts | /100000 | |
| stir | Volt x 105 | Starboard total irradiance | CVLTRS01 | Volts | /100000 | |
| ppar | Volt x 105 | Port side PAR sensor | DVLTRPSD | Volts | /100000 | |
| spar | Volt x 105 | Port side starboard sensor | DVLTRSSD | Volts | /100000 | |
| pres | hectopascal | Atmospheric pressure | CAPHTU01 | millibar | none | |
| time | days since 1899-12-30 00:00:00 UTC | Acquisition time | Not transferred |
All data expressed at measurement altitude.
Calibrations
Field Calibrations
No field calibrations were applied to the data at BODC.
Manufacturers Calibrations
PAR/TIR
The following manufacturer's calibrations were applied to the PAR and TIR light sensors using:
y (W m -2 ) = (a x 10 6 )/b
where 'a' is the raw data in volts and 'b' is the calibration offset (µV per W m -2 ) as shown below.
| Sensor | Serial no | location | offset (µV per W m -2 ) |
| PAR | 28559 | Port | 10.77 |
| PAR | 28560 | Starboard | 9.799 |
| TIR | 047463 | Starboard | 10.62 |
| TIR | 047462 | Port | 11.87 |
All the reformatted data were visualised using the in-house EDSERPLO software. Suspect data were marked by adding an appropriate quality control flag.
Absolute wind speed and direction
Relative wind speed and direction were corrected for the ship's heading and speed using the POS MV gyro heading, ship velocities (calculated at BODC from the main positional channels) and an anemometer orientation of 0° on the bow, thus obtaining the BODC derived absolute wind speed and direction parameters, with codes EWSBSS01 and ERWDSS01 respectively.
Air pressure
A manufacturer's calibration was not applied to the barometer because there was no significant offset reported on the certified calibration certificate.
Air temperature and humidity
Manufacturer's calibrations were not applied to the temperature and humidity probe because there were no significant offsets reported on the certified calibration certificate.
Project Information
MarineE-tech Research Programme
MarineE-tech is a four year (2016-2020) research programme, jointly funded by the Natural Environment Research Council (NERC), Security of Supply of Mineral Resources (SoS Minerals), Engineering and Physical Sciences Research Programme (EPSRC), and the Sao Paulo Research Foundation (FAPESP). The aim of the programme is to improve understanding of E-tech element concentration in seafloor mineral deposits, in particular Cobalt Crusts (ferromanganese-cobalt-rich deposits), which are considered the largest yet least explored source of E-tech elements globally. Research will focus on two key aspects: The formation of the deposits, and reducing the impacts resulting from their recovery.
Background
Minerals are essential for economic development, the functioning of society and maintaining our quality of life. Consumption of most raw materials has increased steadily since World War II, and demand is expected to continue to grow in response to the burgeoning global population and economic growth, especially in Brazil, Russia, India and China (BRIC) and other emerging economies. We are also using a greater variety of metals than ever before.
New technologies such as those required for modern communication and computing and to produce clean renewable, low-carbon energy require considerable quantities of many metals. In light of these trends there is increasing global concern over the long-term availability of secure and adequate supplies of the minerals and metals needed by society. Of particular concern are 'critical' raw materials (E-tech elements), so called because of their growing economic importance and essential contribution to emerging 'green' technologies, yet which have a high risk of supply shortage.
The primary focus of the programme is on the processes controlling the concentration of these E-tech deposits and their composition at a local scale (10s to 100s square km). This will involve data gathering by robotic vehicles across underwater mountains and small, deep-sea basins off the coast of North Africa and Brazil. By identifying the processes that result in the highest grade deposits, we aim to develop a predictive model for their occurrence worldwide. Also to be addressed is how to minimise the environmental impacts of mineral recovery.
Further details are available on the MarineE-tech website.
Participants
Nine different organisations are directly involved in research for MarineE-tech. These institutions are:
- National Oceanography Centre (NOC) - Project Chief Scientist: Dr Bramley Murton
- British Geological Survey (BGS)
- University of Bath
- University of Leicester
- HR Wallingford
- Marine Ecological Surveys Limited (MESL)
- University of Sao Paulo
- Secretariat of the Pacific Community (SPC)
- Soil Machine Dynamics Limited (SMD)
Research details
Overall, two Science Goals and five Work Packages have been funded and are described in brief below:
Science Goal 1: Assess the processes controlling the genesis of marine Fe-Mn deposits and their E-tech element composition
The objective of Work Packages 1, 2 and 3 are to characterise local-scale environmental variables and their influence on the formation and composition of Fe-Mn deposits and hence to ultimately develop predictive models for these deposits. This work addresses Science Goal 1 of the NERC Programme (E-tech element cycling) and forms the central component of our proposal. It is made possible by the opportunity to deploy robotic underwater vehicles and instruments that will enable the detailed studies required to make significant advances in the understanding of these systems and their E-tech element budgets.
-
Work Package 1: Local-scale processes, seafloor morphology, sampling and primary data interpretation (UK lead: NOC).
-
Work Package 2: Physical and chemical characterisation of crusts, development of a litho-,bio- and chemo-stratigraphic framework (BGS lead).
-
Work Package 3: Work package 3: Assessment of the role of microbes in E-tech element concentration and cycling and implications for bioprocessing (NOC lead with USP).
Science Goal 2: Environmental Impacts
-
Work Package 4: Assessing the environmental impacts of Fe-Mn oxide deposit exploitation and E-Tech element extraction on periphery ecosystems (Marine Ecological Surveys Ltd, SOPAC and HR Wallingford).
- Work Package 5: Low-carbon extraction of E-Tech elements from Fe-Mn deposits (University of Bath lead).
Fieldwork and data collection
The project has two dedicated cruises: A UK expedition (JC142) sailed during late 2016 to the Tropic Seamount, north-east Atlantic, on the RRS James Cook. A further cruise is scheduled for 2017 and 2018 by the University of Sao Paulo focusing on the Rio Grande Rise and Sao Paulo Ridge, south-west Atlantic Ocean.
Activities will involve the deployment of underwater robotic technology including the ISIS Remotely Operated Vehicle (ROV) to sample over 100 locations of Fe-Mn crusts. Also to be utilised is the Autosub6000 Autonomous Underwater Vehicle (AUV) to image the lateral extent and thickness of crusts across the seamounts. Plume studies will also be undertaken to assess their impacts on peripheral ecosystems.
Data Activity or Cruise Information
Cruise
| Cruise Name | JC142 (MarineE-tech) |
| Departure Date | 2016-10-29 |
| Arrival Date | 2016-12-08 |
| Principal Scientist(s) | Bramley J Murton (National Oceanography Centre, Southampton) |
| Ship | RRS James Cook |
Complete Cruise Metadata Report is available here
Fixed Station Information
No Fixed Station Information held for the Series
BODC Quality Control Flags
The following single character qualifying flags may be associated with one or more individual parameters with a data cycle:
| Flag | Description |
|---|---|
| Blank | Unqualified |
| < | Below detection limit |
| > | In excess of quoted value |
| A | Taxonomic flag for affinis (aff.) |
| B | Beginning of CTD Down/Up Cast |
| C | Taxonomic flag for confer (cf.) |
| D | Thermometric depth |
| E | End of CTD Down/Up Cast |
| G | Non-taxonomic biological characteristic uncertainty |
| H | Extrapolated value |
| I | Taxonomic flag for single species (sp.) |
| K | Improbable value - unknown quality control source |
| L | Improbable value - originator's quality control |
| M | Improbable value - BODC quality control |
| N | Null value |
| O | Improbable value - user quality control |
| P | Trace/calm |
| Q | Indeterminate |
| R | Replacement value |
| S | Estimated value |
| T | Interpolated value |
| U | Uncalibrated |
| W | Control value |
| X | Excessive difference |
SeaDataNet Quality Control Flags
The following single character qualifying flags may be associated with one or more individual parameters with a data cycle:
| Flag | Description |
|---|---|
| 0 | no quality control |
| 1 | good value |
| 2 | probably good value |
| 3 | probably bad value |
| 4 | bad value |
| 5 | changed value |
| 6 | value below detection |
| 7 | value in excess |
| 8 | interpolated value |
| 9 | missing value |
| A | value phenomenon uncertain |
| B | nominal value |
| Q | value below limit of quantification |
