Metadata Report for BODC Series Reference Number 1816997
Metadata Summary
Problem Reports
Data Access Policy
Narrative Documents
Project Information
Data Activity or Cruise Information
Fixed Station Information
BODC Quality Flags
SeaDataNet Quality Flags
Metadata Summary
Data Description |
|||||||||||||||||||||||||||||||||||||||||||||||||||||||||||||||||||||||||||||||||
|
|||||||||||||||||||||||||||||||||||||||||||||||||||||||||||||||||||||||||||||||||
Data Identifiers |
|||||||||||||||||||||||||||||||||||||||||||||||||||||||||||||||||||||||||||||||||
|
|||||||||||||||||||||||||||||||||||||||||||||||||||||||||||||||||||||||||||||||||
Time Co-ordinates(UT) |
|||||||||||||||||||||||||||||||||||||||||||||||||||||||||||||||||||||||||||||||||
|
|||||||||||||||||||||||||||||||||||||||||||||||||||||||||||||||||||||||||||||||||
Spatial Co-ordinates | |||||||||||||||||||||||||||||||||||||||||||||||||||||||||||||||||||||||||||||||||
|
|||||||||||||||||||||||||||||||||||||||||||||||||||||||||||||||||||||||||||||||||
Parameters |
|||||||||||||||||||||||||||||||||||||||||||||||||||||||||||||||||||||||||||||||||
|
|||||||||||||||||||||||||||||||||||||||||||||||||||||||||||||||||||||||||||||||||
|
|||||||||||||||||||||||||||||||||||||||||||||||||||||||||||||||||||||||||||||||||
Problem Reports
No Problem Report Found in the Database
RRS Discovery cruise DY072 meteorology quality control report
Light sensors
All PAR and TIR channels display occasional negative readings during night time. This most likely results from excessive loss of radiation after sunset, which suggests that day-time data recorded during cloud cover should also be treated with caution. Another explanation would be that outdated calibrations added an offset to the data. All negative PAR and TIR data were flagged. (BODC assessment)
Wind sensors
Evidence of faint wind shielding was observed in meteorological data when winds were coming from 170-190° relative to the bow. All meteorology channels (except light) were flagged appropriately. (BODC assessment).
Data Access Policy
Open Data
These data have no specific confidentiality restrictions for users. However, users must acknowledge data sources as it is not ethical to publish data without proper attribution. Any publication or other output resulting from usage of the data should include an acknowledgment.
If the Information Provider does not provide a specific attribution statement, or if you are using Information from several Information Providers and multiple attributions are not practical in your product or application, you may consider using the following:
"Contains public sector information licensed under the Open Government Licence v1.0."
Narrative Documents
Gill Instruments Windsonic Anemometer
The Gill Windsonic is a 2-axis ultrasonic wind sensor that monitors wind speed and direction using four transducers. The time taken for an ultrasonic pulse to travel from the North to the South transducers is measured and compared with the time for a pulse to travel from South to North. Travel times between the East and West transducers are similarly compared. The wind speed and direction are calculated from the differences in the times of flight along each axis. This calculation is independent of environmental factors such as temperature.
Specifications
| Ultrasonic output rate | 0.25, 0.5, 1, 2 or 4 Hz |
| Operating Temperature | -35 to 70°C |
| Operating Humidity | < 5 to 100% RH |
| Anemometer start up time | < 5 s |
| Wind speed | |
| Range | 0 to 60 m s-1 |
| Accuracy | ± 2% at 2 m s-1 |
| Resolution | 0.01 m s-1 |
| Response time | 0.25 s |
| Threshold | 0.01 m s-1 |
| Wind direction | |
| Range | 0 to 359° |
| Accuracy | ± 3° at 12 m s-1 |
| Resolution | 1° |
| Response time | 0.25 s |
Further details can be found in the manufacturer's specification sheet.
Kipp and Zonen Pyranometer Model CM6B
The CM6B pyranometer is intended for routine global solar radiation measurement research on a level surface. The CM6B features a sixty-four thermocouple junction (series connected) sensing element. The sensing element is coated with a highly stable carbon based non-organic coating, which delivers excellent spectral absorption and long term stability characteristics. The sensing element is housed under two concentric fitting Schott K5 glass domes.
Specifications
| Dimensions (W x H) | 150.0 mm x 91.5 mm |
|---|---|
| Weight | 850 grams |
| Operating Temperature | -40°C to +80°C |
| Spectral Range | 305 - 2800 nm (50% points) |
| Sensitivity | 9 -15 µV/W/m2 |
| Impedance (nominal) | 70 - 100 ohm |
| Response Time (95%) | 30 sec |
| Non-linearity | < ± 1.2% (<1000 W/m2) |
| Temperature dependence of sensitivity | < ± 2% (-10 to +40°C) |
| Zero-offset due to temperature changes | < ± 4 W/m2 at 5 K/h temperature change |
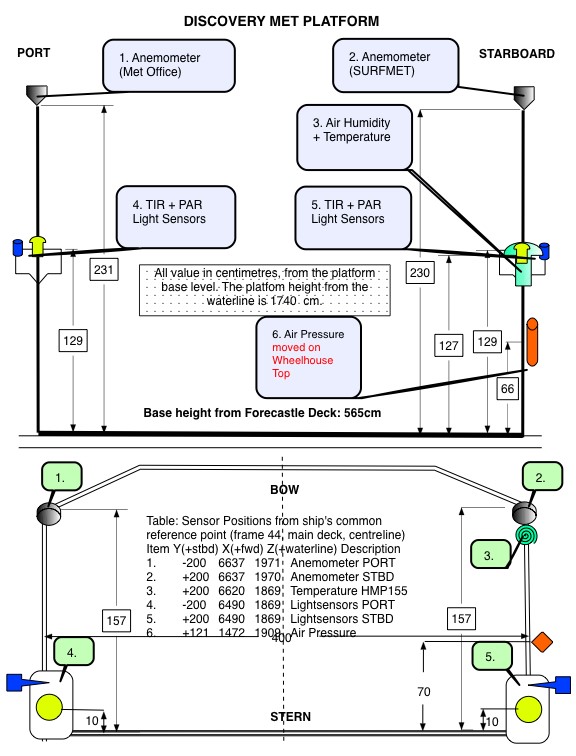
RRS Discovery cruise DY072 meteorology instrumentation
Instrumentation
The meteorological suite of sensors was located on the forecastle deck, at approximately 17.4 m above sea level. The anemometer orientation was 0° on the bow.
| Manufacturer | Model | Serial number | Last manufacturer's calibration date | Comments |
| Skye | SKE 510 | 38884 | 23/11/2016 | Port |
| Skye | SKE 510 | 28556 | 11/09/2015 | Starboard |
| Kipp and Zonen | CM6B | 962276 | 25/11/2016 | Port |
| Kipp and Zonen | CM6B | 962301 | 25/08/2015 | Starboard |
| Gill | Windsonic | 10280018 | - | No calibration required |
| Vaisala | Humidity and Temperature Probe HMP155 | K0950056 | 09/03/2017 | No calibration required |
| Vaisala | PTB210C Barometer Air pres | M2930080 | 20/07/2016 | No calibration required |
 |
Skye Instruments PAR Energy Sensor Model SKE 510
The SKE 510 is suitable for measuring photosynthetically active radiation (PAR) from natural or artificial light sources. The sensor is fully waterproof and guaranteed submersible to 4m depth, and indoor versions are also available.
The instrument uses a blue-enhanced planar diffused silicon detector to measure energy (in W m-2) over the 400-700 nm waveband. It has a cosine-corrected head and a square spectral response. The sensor can operate over a temperature range of -35 to 70 °C and a humidity range of 0-100% RH.
Specifications
| Sensitivity (current) | 1.5µA or 100 W m-2 |
|---|---|
| Sensitivity (voltage) | 1mV or 100 W m-2 |
| Working Range | 0-5000 W m-2 |
| Linearity error | 0.2% |
| Absolute calibration error | typ. less than 3% 5% max |
| Response time - voltage output | 10 ns |
| Cosine error | 3% |
| Azimuth error | less than 1% |
| Temperature co-efficient | ±0.1% per °C |
| Internal resistance - voltage output | c. 300 ohms |
| Longterm stability | ±2% |
| Material | Dupont 'Delrin' |
| Dimensions | 34 mm diameter 38mm height |
| Cable | 2 core screened 7 - 2 - 2C |
| Sensor Passband | 400 - 700 nm |
| Detector | Silicon photocell |
| Filters | Glass type and/or metal interference |
Vaisala PTB210 Digital Barometer
The basic specifications for this pressure sensor are as follows:
- Manufacturer: Vaisala
- Type: Silicon capacitive sensor
- Model: PTB210
- Range: 900 - 1100 hPa
- Output: 0-5VDC
- Total Accuracy (20°C): ±0.30hPa
- Operating temperature: -40 to +60 deg C
- Weight: 110g
- Certification Ingress Protection: IP65
Further details can be found in the manufacturer's specification sheet.
Vaisala Temperature and Relative Humidity HMP Sensors
A family of sensors and instruments (sensors plus integral displays or loggers) for the measurement of air temperature and relative humidity. All are based on a probe containing a patent (HUMICAP) capacitive thin polymer film capacitanece humidity sensor and a Pt100 platinum resistance thermometer. The probes are available with a wide range of packaging, cabling and interface options all of which have designations of the form HMPnn or HMPnnn such as HMP45 and HMP230. Vaisala sensors are incorporated into weather stations and marketed by Campbell Scientific.
All versions operate at up to 100% humidity. Operating temperature ranges vary between models, allowing users to select the version best suited to their requirements.
Further details can be found in the manufacturer's specification sheets for the HMP 45 series, HMP 70 series and HMP 230 series.
RRS Discovery cruise DY072 meteorology data processing procedures
Originator's Data Processing
The data were logged by the TECHSAS (TECHnical and Scientific sensors Acquisition System) version 5.9 data logging system into daily NetCDF files which were provided to BODC for processing. Data was additionally logged into the RVS Level-C format which have been archived at BODC.
Files delivered to BODC
| Filename | Content description | Format | Interval | Start date/time (UTC) | End date/time (UTC) | Comments |
| yyyymmdd-090000-MET-DY-SM_DY1.SURFMETv2 | Air temperature, humidity, relative wind speed, relative wind direction | NetCDF | ~ 1 sec. | 28/02/2017 16:20:34 | 30/03/2017 12:15:28 | |
| yyyymmdd-090000-Light-DY-SM_DY1.SURFMETv2 | Air pressure, PAR, TIR | NetCDF | ~ 1 sec. | 28/02/2017 16:20:34 | 30/03/2017 12:15:28 |
BODC Data Processing
The data were reformatted to BODC internal format using standard banking procedures. Data were averaged at 60 second intervals. The following table shows how variables within the file were mapped to appropriate BODC parameter codes:
yyyymmdd-090000-MET-DY-SM_DY1.SURFMETv2
| Originator's variable | Originator's units | Description | BODC Code | BODC Units | Unit conversion | Comments |
| direct | degrees | Apparent wind direction | ERWDSS01 | degrees | none | |
| speed | m/s | Apparent wind speed | ERWSSS01 | m/s | none | |
| airtemp | degree celsius | Air temperature | CDTAZZ01 | degrees celsius | none | |
| humid | % | Relative air humidity | CRELZZ01 | % | none | |
| time | days since 1899-12-30 00:00:00 UTC | Acquisition time | Not transferred |
yyyymmdd-090000-Light-DY-SM_DY1.SURFMETv2
| Originator's variable | Originator's units | Description | BODC Code | BODC Units | Unit conversion | Comments |
| ptir | Volt x 105 | Port total irradiance | CVLTRP01 | Volts | /100000 | |
| stir | Volt x 105 | Starboard total irradiance | CVLTRS01 | Volts | /100000 | |
| ppar | Volt x 105 | Port side PAR sensor | DVLTRPSD | Volts | /100000 | |
| spar | Volt x 105 | Port side starboard sensor | DVLTRSSD | Volts | /100000 | |
| pres | hectopascal | Atmospheric pressure | CAPHTU01 | millibar | none | |
| time | days since 1899-12-30 00:00:00 UTC | Acquisition time | Not transferred |
All data expressed at measurement altitude.
All the reformatted data were visualised using the in-house EDSERPLO software. Suspect data were marked by adding an appropriate quality control flag.
Calibrations
Field Calibrations
No field calibrations were applied to the data at BODC.
Manufacturers Calibrations
PAR/TIR
The following manufacturer's calibrations were applied to the PAR and TIR light sensors using:
y (W m -2 ) = (a x 10 6 )/b
where 'a' is the raw data in volts and 'b' is the calibration offset (µV per W m -2 ) as shown below.
| Sensor | Serial no | location | offset (µV per W m -2 ) |
| PAR | 38884 | Port | 9.435 |
| PAR | 28556 | Starboard | 9.783 |
| TIR | 962301 | Starboard | 9.74 |
| TIR | 962276 | Port | 10.13 |
Absolute wind speed and direction
Relative wind speed and direction were corrected for the ship's heading and speed using the POS MV gyro heading, ship velocities (calculated at BODC from the main positional channels) and an anemometer orientation of 0° on the bow, thus obtaining the BODC derived absolute wind speed and direction parameters, with codes EWSBSS01 and ERWDSS01 respectively.
Air pressure
A manufacturer's calibration was not applied to the barometer because there was no significant offset reported on the certified calibration certificate.
Air temperature and humidity
Manufacturer's calibrations were not applied to the temperature and humidity probe because there were no significant offsets reported on the certified calibration certificate.
Project Information
Passive Imaging of the Lithosphere Asthensphere Boundary (PiLAB)
PiLAB is a three-year collaborative research project that aims taims to systematically image the entire length of an oceanic plate, from its birth at the Mid-Atlantic Ridge, to its oldest formation on the African margin, in order to determine the processes and properties that define and strengthen a plate.
Through this, PiLAB will improve global understanding of plate physiology and structure.
The PiLAB project is led by the University of Southampton, school of Ocean and Earth Sciences and is a collaboration between IFM GEOMAR, Germany, the Institute of Earth Physics, IPGP, France, and the universities of California and Bristol. The project received funding from the Natural Environmental Research Council and runs between February 2016 and January 2019 and forms part of the UK contribution to the global GEOTRACES project.
Data Activity or Cruise Information
Cruise
| Cruise Name | DY072 |
| Departure Date | 2017-02-28 |
| Arrival Date | 2017-04-02 |
| Principal Scientist(s) | Catherine A Rychert (University of Southampton School of Ocean and Earth Science) |
| Ship | RRS Discovery |
Complete Cruise Metadata Report is available here
Fixed Station Information
No Fixed Station Information held for the Series
BODC Quality Control Flags
The following single character qualifying flags may be associated with one or more individual parameters with a data cycle:
| Flag | Description |
|---|---|
| Blank | Unqualified |
| < | Below detection limit |
| > | In excess of quoted value |
| A | Taxonomic flag for affinis (aff.) |
| B | Beginning of CTD Down/Up Cast |
| C | Taxonomic flag for confer (cf.) |
| D | Thermometric depth |
| E | End of CTD Down/Up Cast |
| G | Non-taxonomic biological characteristic uncertainty |
| H | Extrapolated value |
| I | Taxonomic flag for single species (sp.) |
| K | Improbable value - unknown quality control source |
| L | Improbable value - originator's quality control |
| M | Improbable value - BODC quality control |
| N | Null value |
| O | Improbable value - user quality control |
| P | Trace/calm |
| Q | Indeterminate |
| R | Replacement value |
| S | Estimated value |
| T | Interpolated value |
| U | Uncalibrated |
| W | Control value |
| X | Excessive difference |
SeaDataNet Quality Control Flags
The following single character qualifying flags may be associated with one or more individual parameters with a data cycle:
| Flag | Description |
|---|---|
| 0 | no quality control |
| 1 | good value |
| 2 | probably good value |
| 3 | probably bad value |
| 4 | bad value |
| 5 | changed value |
| 6 | value below detection |
| 7 | value in excess |
| 8 | interpolated value |
| 9 | missing value |
| A | value phenomenon uncertain |
| B | nominal value |
| Q | value below limit of quantification |
