Metadata Report for BODC Series Reference Number 1817073
Metadata Summary
Problem Reports
Data Access Policy
Narrative Documents
Project Information
Data Activity or Cruise Information
Fixed Station Information
BODC Quality Flags
SeaDataNet Quality Flags
Metadata Summary
Data Description |
|||||||||||||||||||||||||||||||||||||||||||||||||||||||||||||||||||||||||||||||||
|
|||||||||||||||||||||||||||||||||||||||||||||||||||||||||||||||||||||||||||||||||
Data Identifiers |
|||||||||||||||||||||||||||||||||||||||||||||||||||||||||||||||||||||||||||||||||
|
|||||||||||||||||||||||||||||||||||||||||||||||||||||||||||||||||||||||||||||||||
Time Co-ordinates(UT) |
|||||||||||||||||||||||||||||||||||||||||||||||||||||||||||||||||||||||||||||||||
|
|||||||||||||||||||||||||||||||||||||||||||||||||||||||||||||||||||||||||||||||||
Spatial Co-ordinates | |||||||||||||||||||||||||||||||||||||||||||||||||||||||||||||||||||||||||||||||||
|
|||||||||||||||||||||||||||||||||||||||||||||||||||||||||||||||||||||||||||||||||
Parameters |
|||||||||||||||||||||||||||||||||||||||||||||||||||||||||||||||||||||||||||||||||
|
|||||||||||||||||||||||||||||||||||||||||||||||||||||||||||||||||||||||||||||||||
|
|||||||||||||||||||||||||||||||||||||||||||||||||||||||||||||||||||||||||||||||||
Problem Reports
No Problem Report Found in the Database
RRS Discovery DY078 Meteorology Quality Report
Light sensors
All PAR and TIR channels display consistent negative readings during night time. This most likely results from excessive loss of radiation after sunset, which suggests that day-time data recorded during cloud cover should also be treated with caution. Another explanation would be that outdated calibrations added an offset to the data. All negative PAR and TIR data were flagged. (BODC assessment)
The starboard TIR channel shows signs of shielding. This occurs when the sensor is partially shaded by the ship. Data have been flagged where this occurs. (BODC assessment)
Wind sensors
There are areas in this time series when the true wind speed show signs of shielding. Shielding occurs when the sensor is partially blocked from the wind by the ship. (BODC assessment)
Data Access Policy
Open Data
These data have no specific confidentiality restrictions for users. However, users must acknowledge data sources as it is not ethical to publish data without proper attribution. Any publication or other output resulting from usage of the data should include an acknowledgment.
If the Information Provider does not provide a specific attribution statement, or if you are using Information from several Information Providers and multiple attributions are not practical in your product or application, you may consider using the following:
"Contains public sector information licensed under the Open Government Licence v1.0."
Narrative Documents
Gill Instruments Windsonic Anemometer
The Gill Windsonic is a 2-axis ultrasonic wind sensor that monitors wind speed and direction using four transducers. The time taken for an ultrasonic pulse to travel from the North to the South transducers is measured and compared with the time for a pulse to travel from South to North. Travel times between the East and West transducers are similarly compared. The wind speed and direction are calculated from the differences in the times of flight along each axis. This calculation is independent of environmental factors such as temperature.
Specifications
| Ultrasonic output rate | 0.25, 0.5, 1, 2 or 4 Hz |
| Operating Temperature | -35 to 70°C |
| Operating Humidity | < 5 to 100% RH |
| Anemometer start up time | < 5 s |
| Wind speed | |
| Range | 0 to 60 m s-1 |
| Accuracy | ± 2% at 2 m s-1 |
| Resolution | 0.01 m s-1 |
| Response time | 0.25 s |
| Threshold | 0.01 m s-1 |
| Wind direction | |
| Range | 0 to 359° |
| Accuracy | ± 3° at 12 m s-1 |
| Resolution | 1° |
| Response time | 0.25 s |
Further details can be found in the manufacturer's specification sheet.
Kipp and Zonen Pyranometer Model CM6B
The CM6B pyranometer is intended for routine global solar radiation measurement research on a level surface. The CM6B features a sixty-four thermocouple junction (series connected) sensing element. The sensing element is coated with a highly stable carbon based non-organic coating, which delivers excellent spectral absorption and long term stability characteristics. The sensing element is housed under two concentric fitting Schott K5 glass domes.
Specifications
| Dimensions (W x H) | 150.0 mm x 91.5 mm |
|---|---|
| Weight | 850 grams |
| Operating Temperature | -40°C to +80°C |
| Spectral Range | 305 - 2800 nm (50% points) |
| Sensitivity | 9 -15 µV/W/m2 |
| Impedance (nominal) | 70 - 100 ohm |
| Response Time (95%) | 30 sec |
| Non-linearity | < ± 1.2% (<1000 W/m2) |
| Temperature dependence of sensitivity | < ± 2% (-10 to +40°C) |
| Zero-offset due to temperature changes | < ± 4 W/m2 at 5 K/h temperature change |
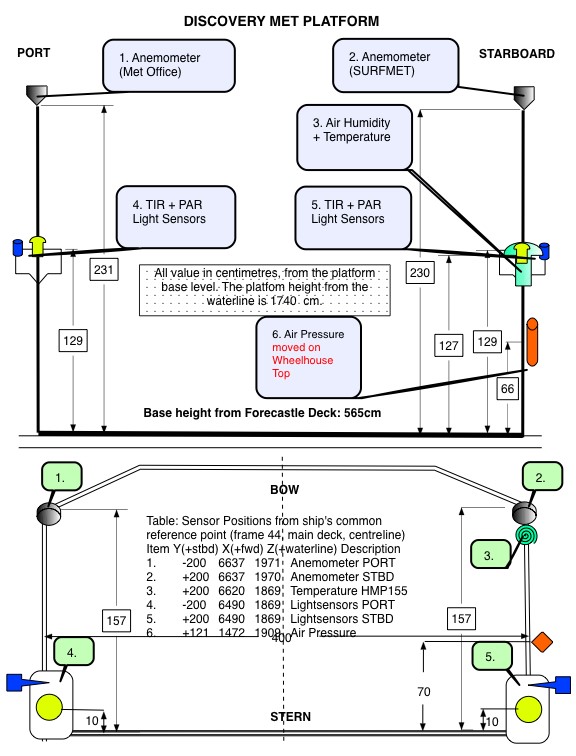
RRS Discovery DY078 Meteorology Instrumentation
The meteorological suite of sensors was located on the forecastle deck, at approximately 19 m above sea level. The anemometer orientation was 0° on the bow.
| Manufacturer | Model | Serial number | Last manufacturer's calibration date | Comments |
| Skye | SKE 510 | 38884 | 23/11/2016 | Port |
| Skye | SKE 510 | 28556 | 11/09/2015 | Starboard |
| Kipp and Zonen | CM 6B | 962776 | 25/11/2016 | Port |
| Kipp and Zonen | CM 6B | 962301 | 25/08/2015 | Starboard |
| Gill | Windsonic | 10280018 | - | No calibration required |
| Vaisala | Humidity and Temperature Probe HMP155 | K0950056 | 09/03/2017 | No calibration required |
| Vaisala | PTB210C Barometer Air pres | M2930080 | 20/07/2016 | No calibration required |
 |
Skye Instruments PAR Energy Sensor Model SKE 510
The SKE 510 is suitable for measuring photosynthetically active radiation (PAR) from natural or artificial light sources. The sensor is fully waterproof and guaranteed submersible to 4m depth, and indoor versions are also available.
The instrument uses a blue-enhanced planar diffused silicon detector to measure energy (in W m-2) over the 400-700 nm waveband. It has a cosine-corrected head and a square spectral response. The sensor can operate over a temperature range of -35 to 70 °C and a humidity range of 0-100% RH.
Specifications
| Sensitivity (current) | 1.5µA or 100 W m-2 |
|---|---|
| Sensitivity (voltage) | 1mV or 100 W m-2 |
| Working Range | 0-5000 W m-2 |
| Linearity error | 0.2% |
| Absolute calibration error | typ. less than 3% 5% max |
| Response time - voltage output | 10 ns |
| Cosine error | 3% |
| Azimuth error | less than 1% |
| Temperature co-efficient | ±0.1% per °C |
| Internal resistance - voltage output | c. 300 ohms |
| Longterm stability | ±2% |
| Material | Dupont 'Delrin' |
| Dimensions | 34 mm diameter 38mm height |
| Cable | 2 core screened 7 - 2 - 2C |
| Sensor Passband | 400 - 700 nm |
| Detector | Silicon photocell |
| Filters | Glass type and/or metal interference |
Vaisala PTB210 Digital Barometer
The basic specifications for this pressure sensor are as follows:
- Manufacturer: Vaisala
- Type: Silicon capacitive sensor
- Model: PTB210
- Range: 900 - 1100 hPa
- Output: 0-5VDC
- Total Accuracy (20°C): ±0.30hPa
- Operating temperature: -40 to +60 deg C
- Weight: 110g
- Certification Ingress Protection: IP65
Further details can be found in the manufacturer's specification sheet.
Vaisala Temperature and Relative Humidity HMP Sensors
A family of sensors and instruments (sensors plus integral displays or loggers) for the measurement of air temperature and relative humidity. All are based on a probe containing a patent (HUMICAP) capacitive thin polymer film capacitanece humidity sensor and a Pt100 platinum resistance thermometer. The probes are available with a wide range of packaging, cabling and interface options all of which have designations of the form HMPnn or HMPnnn such as HMP45 and HMP230. Vaisala sensors are incorporated into weather stations and marketed by Campbell Scientific.
All versions operate at up to 100% humidity. Operating temperature ranges vary between models, allowing users to select the version best suited to their requirements.
Further details can be found in the manufacturer's specification sheets for the HMP 45 series, HMP 70 series and HMP 230 series.
RRS Discovery DY078 Meteorology processing procedures
Originator's Data Processing
SurfMet
Ship speed, position and heading from the seapos navigation file were merged onto the wind data in the surfmet stream.
The absolute wind speed is calculated and vector averaged with mtruew_01_dy078.m. As with bestnav processing, this is rerun for the entire cruise each time the data are updated. The output files from this processing are:
data/met/surfmet/met_dy078_true.nc data/met/surfmet/met_dy078_trueav.nc
The latter file is reduced to 1-minute averages, with correct vector averaging when required. In order to avoid ambiguity, variable units are explicit in whether wind directions are towards or from the direction in question. Although the header originally reported the speed in knots, comparison against the on-board live streams showed that the units were in fact m/s.
SurfLight
PA irradiance and thermal-IR data are found in the surlight stream, which also contains surface pressure. These streams were ingested and stored, but no further processing was undertaken.
The daily Mstar Meteorology files provided to BODC were used for BODC processing. Data were additionally logged into the RVS Level-C format files and TECHSAS which have been archived at BODC. Relative wind speed and direction were loaded from the TECHSAS source files after discovering problems with the Mstar files.
For more detailed information on the Originator's underway data processing, please see the cruise report, p64-73.
Files delivered to BODC
| Filename | Content description | Format | Interval | Start date/time (UTC) | End date/time (UTC) | Comments |
| met_dy078_trueav.nc | relative wind speed, relative wind direction | Mstar | 60 seconds. | 06/05/2017 00:00:00 | 27/05/2017 00:00:00 | |
| met_light_dy078_01.nc | Air pressure, PAR, TIR | Mstar | 1 second. | 06/05/2017 00:00:00 | 26/05/2017 23:59:58 | |
| met_dy078_01.nc | Humidity, air temperature | Mstar | 1 second. | 06/05/2017 00:00:00 | 26/05/2017 23:59:58 | |
| *-*-MET-DY-SM_DY1.SURFMETv2 | relative wind speed, relative wind direction | NetCDF | ~1 second. | 04/05/2017 09:50:11 | 27/05/2017 01:00:00 |
BODC Data Processing
The data were reformatted to BODC internal format using standard banking procedures. Data were averaged at 60 second intervals. The following table shows how variables within the file were mapped to appropriate BODC parameter codes:
met_dy078_trueav.nc
| Originator's variable | Originator's units | Description | BODC Code | BODC Units | Unit conversion | Comments |
| ship_u | m/s | Ship eastward velocity | Not transferred. Derived by BODC. | |||
| ship_v | m/s | Ship northward velocity | Not transferred. Derived by BODC. | |||
| ship_spd | m/s | Ship's speed | Not transferred | |||
| ship_dir | degrees | ship direction | Not transferred. Transferred from bestnav. | |||
| ship_hdg | degrees | ship heading | Not transferred. Transferred from bestnav. | |||
| truwind_u | m/s | true wind eastward velocity | Not transferred | |||
| truwind_v | m/s | true wind northward velocity | Not transferred | |||
| trwind_dir | degrees | True wind direction | EWDASS01 | degrees | none | Not transferred. Derived by BODC. |
| truwind_spd | m/s | True wind speed | EWSBSS01 | m/s | none | Not transferred. Derived by BODC. |
| relwind_u | m/s | Relative east component wind velocity | Not transferred. | |||
| relwind_v | m/s | Relative north component wind velocity | Not transferred. | |||
| relwind_spd | m/s | relative wind speed | Not transferred. Sourced from TECHSAS. | |||
| relwind_direarth | degrees_to relative to earth | degrees_to relative to earth | Not transferred. | |||
| relwind_dirship | degrees relative to ship 0 = towards bow | degrees relative to ship 0 = towards bow | Not transferred. Sourced from TECHSAS. | |||
| lat | degree_north | degree_north | Not transferred. Transferred from bestnav. | |||
| long | degree_east | degree_east | Not transferred. Transferred from bestnav. | |||
| distrun | km | distance travelled | DSRNCV01 | km | none | Not transferred. Derived by BODC. |
| time | seconds since 01/01/2017 | Measure timestamp | Not transferred |
met_light_dy078_01.nc
| Originator's variable | Originator's units | Description | BODC Code | BODC Units | Unit conversion | Comments |
| ptir | Volt x 105 | Port total irradiance | CVLTRP01 | Volts | /100000 | |
| stir | Volt x 105 | Starboard total irradiance | CVLTRS01 | Volts | /100000 | |
| ppar | Volt x 105 | Port side PAR sensor | DVLTRPSD | Volts | /100000 | |
| spar | Volt x 105 | Port side starboard sensor | DVLTRSSD | Volts | /100000 | |
| pres | mbar | Atmospheric pressure | CAPHTU01 | millibar | none | |
| time | seconds since 01/01/2017 | Measure timestamp | Not transferred |
met_dy078_01.nc
| Originator's variable | Originator's units | Description | BODC Code | BODC Units | Unit conversion | Comments |
| Direct | degree | True wind direction | Not transferred. | |||
| speed | m/s | True wind speed | Not transferred. | |||
| airtemp | degree celsius | Air temperature | CDTAZZ01 | degrees celsius | none | |
| humid | % | Relative air humidity | CRELZZ01 | % | none | |
| time | seconds since 01/01/2017 | Measure timestamp | Not transferred |
yyyymmdd-050010-MET-DY-SM_DY1.SURFMETv2
| Originator's variable | Originator's units | Description | BODC Code | BODC Units | Unit conversion | Comments |
| direct | degrees | Apparent wind direction | ERWDSS01 | degrees | none | |
| speed | m/s | Apparent wind speed | ERWSSS01 | m/s | none | |
| airtemp | degree celsius | Air temperature | Not transferred. | |||
| humid | % | Relative air humidity | Not transferred. | |||
| time | days since 1899-12-30 00:00:00 UTC | Acquisition time | Not transferred |
All data expressed at measurement altitude.
Screening
All the reformatted data were visualised using the in-house EDSERPLO software. Suspect data were marked by adding an appropriate quality control flag.
Calibrations
Field Calibrations
No field calibrations were applied to the data at BODC.
Manufacturers Calibrations
PAR/TIR
The following manufacturer's calibrations were applied to the PAR and TIR light sensors using:
y (W m -2 ) = (a x 10 6 )/b
where 'a' is the raw data in volts and 'b' is the calibration offset (µV per W m -2 ) as shown below.
| Sensor | Serial no | location | offset (µV per W m -2 ) |
| PAR | 38884 | Port | 9.435 |
| PAR | 28556 | Starboard | 9.783 |
| TIR | 962301 | Starboard | 9.74 |
| TIR | 962276 | Port | 10.13 |
Absolute wind speed and direction
Relative wind speed and direction were corrected for the ship's heading and speed using the heading, ship velocities (calculated at BODC from the main positional channels) and an anemometer orientation of 0° on the bow, thus obtaining the BODC derived absolute wind speed and direction parameters, with codes EWSBSS01 and EWDASS01 respectively.
Air pressure
A manufacturer's calibration was not applied to the barometer because there was no significant offset reported on the certified calibration certificate.
Air temperature and humidity
Manufacturer's calibrations were not applied to the temperature and humidity probe because there were no significant offsets reported on the certified calibration certificate.
Project Information
UK - Overturning in the Subpolar North Atlantic Programme (UK-OSNAP) Programme
UK-OSNAP is part of an international collaboration to establish a transoceanic observing system in the subpolar North Atlantic. The aim is to quantify and understand the Subpolar Gyre's response to local and remote forcing of mass, heat and freshwater fluxes, within the conceptual framework of the Atlantic Meridional Overturning Circulation (AMOC).
UK-OSNAP is developing a new observing system to provide a continuous record of full-depth, trans-basin mass, heat, and freshwater fluxes. Combining these sustained measurements with innovative modelling techniques will enable the project to characterise the circulation and fluxes of the North Atlantic Subpolar Gyre.
UK-OSNAP is funded by the Natural Environment Research Council (NERC). The project is led by the National Oceanography Centre (NOC) with partners in the University of Liverpool, the University of Oxford and the Scottish Association for Marine Science (SAMS). It is a part of international OSNAP that is led by USA and includes 10 further partner groups in Canada, France, Germany, the Netherlands and China. The project involves fieldwork at sea and model studies.
The OSNAP observing system consists of two legs: one extending from southern Labrador to the southwestern tip of Greenland across the mouth of the Labrador Sea (OSNAP West), and the second from the southeastern tip of Greenland to Scotland (OSNAP East). The observing system also includes subsurface floats (OSNAP Floats) in order to trace the pathways of overflow waters in the basin and to assess the connectivity of currents crossing the OSNAP line.
NERC have added an extension to UK-OSNAP, until October 2024. This will result in the UK-OSNAP-Decade: 10 years of observing and understanding the overturning circulation in the subpolar North Atlantic (2014-2024). UK-OSNAP Decade forms part of the wider UK-OSNAP programme. Although supported through separate funding streams, including the Collective Funds 'Changing North Atlantic' grant, OSNAP decade (NE/T00858X/1), is considered a continuation of the core programme. In line with this, activities and associated data are grouped under UK-OSNAP, with funding details recorded here rather than as a separate project.
Data Activity or Cruise Information
Cruise
| Cruise Name | DY078 (DY079) |
| Departure Date | 2017-05-06 |
| Arrival Date | 2017-05-28 |
| Principal Scientist(s) | N Penny Holliday (National Oceanography Centre, Southampton) |
| Ship | RRS Discovery |
Complete Cruise Metadata Report is available here
Fixed Station Information
No Fixed Station Information held for the Series
BODC Quality Control Flags
The following single character qualifying flags may be associated with one or more individual parameters with a data cycle:
| Flag | Description |
|---|---|
| Blank | Unqualified |
| < | Below detection limit |
| > | In excess of quoted value |
| A | Taxonomic flag for affinis (aff.) |
| B | Beginning of CTD Down/Up Cast |
| C | Taxonomic flag for confer (cf.) |
| D | Thermometric depth |
| E | End of CTD Down/Up Cast |
| G | Non-taxonomic biological characteristic uncertainty |
| H | Extrapolated value |
| I | Taxonomic flag for single species (sp.) |
| K | Improbable value - unknown quality control source |
| L | Improbable value - originator's quality control |
| M | Improbable value - BODC quality control |
| N | Null value |
| O | Improbable value - user quality control |
| P | Trace/calm |
| Q | Indeterminate |
| R | Replacement value |
| S | Estimated value |
| T | Interpolated value |
| U | Uncalibrated |
| W | Control value |
| X | Excessive difference |
SeaDataNet Quality Control Flags
The following single character qualifying flags may be associated with one or more individual parameters with a data cycle:
| Flag | Description |
|---|---|
| 0 | no quality control |
| 1 | good value |
| 2 | probably good value |
| 3 | probably bad value |
| 4 | bad value |
| 5 | changed value |
| 6 | value below detection |
| 7 | value in excess |
| 8 | interpolated value |
| 9 | missing value |
| A | value phenomenon uncertain |
| B | nominal value |
| Q | value below limit of quantification |
