Metadata Report for BODC Series Reference Number 1844231
Metadata Summary
Problem Reports
Data Access Policy
Narrative Documents
Project Information
Data Activity or Cruise Information
Fixed Station Information
BODC Quality Flags
SeaDataNet Quality Flags
Metadata Summary
Data Description |
|||||||||||||||||||||||||||||||||||||||||||||||||||||||||||||||||
|
|||||||||||||||||||||||||||||||||||||||||||||||||||||||||||||||||
Data Identifiers |
|||||||||||||||||||||||||||||||||||||||||||||||||||||||||||||||||
|
|||||||||||||||||||||||||||||||||||||||||||||||||||||||||||||||||
Time Co-ordinates(UT) |
|||||||||||||||||||||||||||||||||||||||||||||||||||||||||||||||||
|
|||||||||||||||||||||||||||||||||||||||||||||||||||||||||||||||||
Spatial Co-ordinates | |||||||||||||||||||||||||||||||||||||||||||||||||||||||||||||||||
|
|||||||||||||||||||||||||||||||||||||||||||||||||||||||||||||||||
Parameters |
|||||||||||||||||||||||||||||||||||||||||||||||||||||||||||||||||
|
|||||||||||||||||||||||||||||||||||||||||||||||||||||||||||||||||
|
|||||||||||||||||||||||||||||||||||||||||||||||||||||||||||||||||
Problem Reports
No Problem Report Found in the Database
CTD data from cruise J17005 Quality Report
Screening and Quality Control
During BODC quality control, data were screened using in house visualisation software. The data were screened and any obvious outliers and spikes were looked at in closer detail and flagged if necessary.
DOXYSC01 and OXYSZZ01
The first 18 cycles of DOXYSC01 in the series 1844612 have been flagged 'M' during BODC screening as the values were decreasing in incremental steps that were not reflect in the remainder of the cast or in surrounding casts. As OXYSZZ01 is derived using DOXYSC01, the first 18 cycles of OXYSZZ01 have also been flagged 'M' in this series.
AHSFZZ01
This channel has been flagged where values are constant or increase with depth. The altimeter only collects good data within 100 m of the seabed and these instances of constant values or increases with depth occur more than 100 m from the seabed.
Data Access Policy
Open Data
These data have no specific confidentiality restrictions for users. However, users must acknowledge data sources as it is not ethical to publish data without proper attribution. Any publication or other output resulting from usage of the data should include an acknowledgment.
If the Information Provider does not provide a specific attribution statement, or if you are using Information from several Information Providers and multiple attributions are not practical in your product or application, you may consider using the following:
"Contains public sector information licensed under the Open Government Licence v1.0."
Narrative Documents
Sea-Bird Dissolved Oxygen Sensor SBE 43 and SBE 43F
The SBE 43 is a dissolved oxygen sensor designed for marine applications. It incorporates a high-performance Clark polarographic membrane with a pump that continuously plumbs water through it, preventing algal growth and the development of anoxic conditions when the sensor is taking measurements.
Two configurations are available: SBE 43 produces a voltage output and can be incorporated with any Sea-Bird CTD that accepts input from a 0-5 volt auxiliary sensor, while the SBE 43F produces a frequency output and can be integrated with an SBE 52-MP (Moored Profiler CTD) or used for OEM applications. The specifications below are common to both.
Specifications
| Housing | Plastic or titanium |
| Membrane | 0.5 mil- fast response, typical for profile applications 1 mil- slower response, typical for moored applications |
| Depth rating | 600 m (plastic) or 7000 m (titanium) 10500 m titanium housing available on request |
| Measurement range | 120% of surface saturation |
| Initial accuracy | 2% of saturation |
| Typical stability | 0.5% per 1000 h |
Further details can be found in the manufacturer's specification sheet.
Instrument Description for JR17005 CTD
CTD Unit and Auxiliary Sensors
| Sensor unit | Model | Serial number | Full specification | Calibration date |
|---|---|---|---|---|
| CTD underwater unit | SBE 9plus | 09P30856-0707 | SBE 9plus | 23 MAY 2017 |
| CTD deck unit | SBE 11plus | 11P15759-0458 | - | - |
| Primary temperature sensor | SBE 3P | 2705 | SBE 03P | 25 MAY 2017 |
| Secondary temperature sensor | SBE 3P | 5042 | SBE 03P | 25 MAY 2017 |
| Primary conductivity sensor | SBE 4C | 2222 | SBE 04C | 24 MAY 2017 |
| Secondary conductivity sensor | SBE 4C | 2255 | SBE 04C | 24 MAY 2017 |
| Dissolved oxygen sensor | SBE 43 | 2291 | SBE 43 | 20 MAY 2017 |
| Altimeter | Tritech PA-200 | 244740 | Tritech PA-200 | 24 MAY 2017 |
| Irradiance sensor | Biospherical QCP2350 PAR | 70688 | Biospherical QCP PAR sensor | 20 JUN 2017 |
| Fluorometer | Chelsea MKIII Aquatracka | 088-216 | Chelsea MKII Aquatracka | 19 MAY 2017 |
| Fluorometer** | WET Labs ECO CDOM | FLCDRTD-1930 | WET Labs ECO FL | - |
| Transmissometer | WetLabs C-Star | CST-1399DR | WetLabs C-Star | 16 JUN 2017 |
| LADCP | RDI Workhorse 300 kHz | - | LADCP | - |
**The CDOM flourometer was removed from the CTD frame after cast 62.
Sea-Bird Electronics SBE 911 and SBE 917 series CTD profilers
The SBE 911 and SBE 917 series of conductivity-temperature-depth (CTD) units are used to collect hydrographic profiles, including temperature, conductivity and pressure as standard. Each profiler consists of an underwater unit and deck unit or SEARAM. Auxiliary sensors, such as fluorometers, dissolved oxygen sensors and transmissometers, and carousel water samplers are commonly added to the underwater unit.
Underwater unit
The CTD underwater unit (SBE 9 or SBE 9 plus) comprises a protective cage (usually with a carousel water sampler), including a main pressure housing containing power supplies, acquisition electronics, telemetry circuitry, and a suite of modular sensors. The original SBE 9 incorporated Sea-Bird's standard modular SBE 3 temperature sensor and SBE 4 conductivity sensor, and a Paroscientific Digiquartz pressure sensor. The conductivity cell was connected to a pump-fed plastic tubing circuit that could include auxiliary sensors. Each SBE 9 unit was custom built to individual specification. The SBE 9 was replaced in 1997 by an off-the-shelf version, termed the SBE 9 plus, that incorporated the SBE 3 plus (or SBE 3P) temperature sensor, SBE 4C conductivity sensor and a Paroscientific Digiquartz pressure sensor. Sensors could be connected to a pump-fed plastic tubing circuit or stand-alone.
Temperature, conductivity and pressure sensors
The conductivity, temperature, and pressure sensors supplied with Sea-Bird CTD systems have outputs in the form of variable frequencies, which are measured using high-speed parallel counters. The resulting count totals are converted to numeric representations of the original frequencies, which bear a direct relationship to temperature, conductivity or pressure. Sampling frequencies for these sensors are typically set at 24 Hz.
The temperature sensing element is a glass-coated thermistor bead, pressure-protected inside a stainless steel tube, while the conductivity sensing element is a cylindrical, flow-through, borosilicate glass cell with three internal platinum electrodes. Thermistor resistance or conductivity cell resistance, respectively, is the controlling element in an optimized Wien Bridge oscillator circuit, which produces a frequency output that can be converted to a temperature or conductivity reading. These sensors are available with depth ratings of 6800 m (aluminium housing) or 10500 m (titanium housing). The Paroscientific Digiquartz pressure sensor comprises a quartz crystal resonator that responds to pressure-induced stress, and temperature is measured for thermal compensation of the calculated pressure.
Additional sensors
Optional sensors for dissolved oxygen, pH, light transmission, fluorescence and others do not require the very high levels of resolution needed in the primary CTD channels, nor do these sensors generally offer variable frequency outputs. Accordingly, signals from the auxiliary sensors are acquired using a conventional voltage-input multiplexed A/D converter (optional). Some Sea-Bird CTDs use a strain gauge pressure sensor (Senso-Metrics) in which case their pressure output data is in the same form as that from the auxiliary sensors as described above.
Deck unit or SEARAM
Each underwater unit is connected to a power supply and data logging system: the SBE 11 (or SBE 11 plus) deck unit allows real-time interfacing between the deck and the underwater unit via a conductive wire, while the submersible SBE 17 (or SBE 17 plus) SEARAM plugs directly into the underwater unit and data are downloaded on recovery of the CTD. The combination of SBE 9 and SBE 17 or SBE 11 are termed SBE 917 or SBE 911, respectively, while the combinations of SBE 9 plus and SBE 17 plus or SBE 11 plus are termed SBE 917 plus or SBE 911 plus.
Specifications
Specifications for the SBE 9 plus underwater unit are listed below:
| Parameter | Range | Initial accuracy | Resolution at 24 Hz | Response time |
|---|---|---|---|---|
| Temperature | -5 to 35°C | 0.001°C | 0.0002°C | 0.065 sec |
| Conductivity | 0 to 7 S m-1 | 0.0003 S m-1 | 0.00004 S m-1 | 0.065 sec (pumped) |
| Pressure | 0 to full scale (1400, 2000, 4200, 6800 or 10500 m) | 0.015% of full scale | 0.001% of full scale | 0.015 sec |
Further details can be found in the manufacturer's specification sheet.
Chelsea Technologies Group Aquatracka MKIII fluorometer
The Chelsea Technologies Group Aquatracka MKIII is a logarithmic response fluorometer. Filters are available to enable the instrument to measure chlorophyll, rhodamine, fluorescein and turbidity.
It uses a pulsed (5.5 Hz) xenon light source discharging along two signal paths to eliminate variations in the flashlamp intensity. The reference path measures the intensity of the light source whilst the signal path measures the intensity of the light emitted from the specimen under test. The reference signal and the emitted light signals are then applied to a ratiometric circuit. In this circuit, the ratio of returned signal to reference signal is computed and scaled logarithmically to achieve a wide dynamic range. The logarithmic conversion accuracy is maintained at better than one percent of the reading over the full output range of the instrument.
Two variants of the instrument are available, both manufactured in titanium, capable of operating in depths from shallow water down to 2000 m and 6000 m respectively. The optical characteristics of the instrument in its different detection modes are visible below:
| Excitation | Chlorophyll a | Rhodamine | Fluorescein | Turbidity |
|---|---|---|---|---|
| Wavelength (nm) | 430 | 500 | 485 | 440* |
| Bandwidth (nm) | 105 | 70 | 22 | 80* |
| Emission | Chlorophyll a | Rhodamine | Fluorescein | Turbidity |
| Wavelength (nm) | 685 | 590 | 530 | 440* |
| Bandwidth (nm) | 30 | 45 | 30 | 80* |
* The wavelengths for the turbidity filters are customer selectable but must be in the range 400 to 700 nm. The same wavelength is used in the excitation path and the emission path.
The instrument measures chlorophyll a, rhodamine and fluorescein with a concentration range of 0.01 µg l-1 to 100 µg l-1. The concentration range for turbidity is 0.01 to 100 FTU (other wavelengths are available on request).
The instrument accuracy is ± 0.02 µg l-1 (or ± 3% of the reading, whichever is greater) for chlorophyll a, rhodamine and fluorescein. The accuracy for turbidity, over a 0 - 10 FTU range, is ± 0.02 FTU (or ± 3% of the reading, whichever is greater).
Further details are available from the Aquatracka MKIII specification sheet.
Biospherical Instruments QCP-2350 [underwater] PAR sensor
A cosine-corrected PAR quantum irradiance profiling sensor. For use in underwater applications with 24 bit ADC systems. Measures light available for photosynthesis on a flat surface. Operation is by a single channel compressed analog output voltage that is proportional to the log of incident PAR (400-700 nm) irradiance. The sensor is designed for operation in waters to depths of up to 2,000 m (standard) or 6,800 m (optional).
For more information, please see this document: https://www.bodc.ac.uk/data/documents/nodb/pdf/Biospherical_QCP2300_QCP2350_Apr2014.pdf
Tritech PA-200 altimeter
Digital precision altimeter with 200 kHz signal giving highly accurate height off seabed and subsea distance measurements. Operates effectively between -10 °C and 40 °C at heights up to 50 m above the seabed. Standard depth rating is 4000 m, with 700 and 6800 m options. This term can be used for either the MKI or MKII version, which will be identified elsewhere in the supporting metadata.
For more information, please see these documents:
https://www.bodc.ac.uk/data/documents/nodb/pdf/pa200_pa500-altimeters.pdf
https://www.bodc.ac.uk/data/documents/nodb/pdf/pa200_pa500_MKII-altimeters.pdf
WETLabs C-Star transmissometer
This instrument is designed to measure beam transmittance by submersion or with an optional flow tube for pumped applications. It can be used in profiles, moorings or as part of an underway system.
Two models are available, a 25 cm pathlength, which can be built in aluminum or co-polymer, and a 10 cm pathlength with a plastic housing. Both have an analog output, but a digital model is also available.
This instrument has been updated to provide a high resolution RS232 data output, while maintaining the same design and characteristics.
Specifications
| Pathlength | 10 or 25 cm |
| Wavelength | 370, 470, 530 or 660 nm |
| Bandwidth | ~ 20 nm for wavelengths of 470, 530 and 660 nm ~ 10 to 12 nm for a wavelength of 370 nm |
| Temperature error | 0.02 % full scale °C-1 |
| Temperature range | 0 to 30°C |
| Rated depth | 600 m (plastic housing) 6000 m (aluminum housing) |
Further details are available in the manufacturer's specification sheet or user guide.
BODC Data Processing
Data Processing
Processed and calibrated CTD data from Changing Arctic Ocean cruise JR17005 were submitted to BODC in both .mat and .txt format. which were archived following BODC procedures. The files were transferred to BODC internal format using standard BODC processing procedures. The variables provided in the files were mapped to BODC parameter codes as follows:
| Originator's Variable | Originator's Units | BODC Parameter Code | BODC Units | Comment |
|---|---|---|---|---|
| CTDpres | db | PRESPR01 | db | - |
| CTDdepth | m | DEPHPR01 | m | - |
| CTDtemp1 | °C | TEMPST01 | °C | - |
| CTDtemp2 | °C | TEMPST02 | °C | The channel was transferred and then dropped following BODC processing as there was no difference in the quality of the data from the first or second sensor. |
| CTDfluor | µg L-1 | CPHLPR01 | mg m-3 | Equivalent units |
| CTDatt | m-1 | ATTNMR01 | m-1 | - |
| CTDxmiss | % | POPTDR01 | % | - |
| CTDpar | µE m-2s-1 | IRRDSV01 | µE m-2s-1 | - |
| CTDaltim | m | AHSFZZ01 | m | - |
| CTDcond1 | mS cm-1 | CNDCST01 | S m-1 | Conversion of /10 applied |
| CTDcond2 | mS cm-1 | CNDCST02 | S m-1 | The channel was transferred and then dropped following BODC processing as there was no difference in the quality of the data from the first or second sensor. |
| CTDsal1 | PSU | PSALST01 | Dimensionless | - |
| CTDsal2 | PSU | PSALST02 | Dimensionless | The channel was transferred and then dropped following BODC processing as there was no difference in the quality of the data from the first or second sensor. |
| CTDpden1 | - | - | - | Not transferring, using BODC derived channel. |
| CTDpden2 | - | - | - | Not transferring, using BODC derived channel. |
| CTDoxy | µmol L-1 | DOXYSC01 | µmol L-1 | - |
The following parameters were derived by BODC when the data were transferred to QXF format:
| Originator's Variable | Originator's Units | BODC Parameter Code | BODC Units | Comment |
|---|---|---|---|---|
| - | - | OXYSZZ01 | % | Derived during transfer using DOXYZZ01, TEMPST01 and PSALST01 |
| - | - | POTMCV01 | °C | Derived during transfer using TEMPST01, PSALST01 and PRESPR01 |
| - | - | SIGTPR01 | kg m-3 | Derived during transfer using POTMCV01, PSALST01 and PRESPR01 |
Screening
Post transfer analysis and crosschecks were applied according to BODC procedures. This involved the screening of data using BODC's in house visualisation software where any suspect data were flagged but not removed.
Originator Data Processing
Sampling Strategy
A total of 72 CTD casts were performed during JR17005 which included two test casts.
Data Processing
For each CTD cast the following raw data files were generated:
- JR17005_XXX.bl (a record of bottle firing locations)
- JR17005_XXX.hdr (header file)
- JR17005_XXX.hex (raw data file)
- JR17005_XXX.con (configuration file)
where XXX is the cast number of the CTD data series.
The CTD processing was started using Seabird Data Processing version 7.26.7 were the following modules were run:
- Data conversion - converted raw data from engineering units to binary .cnv files using any calibrations in the instrument configuration file and created .ros files.
- Wild edit - flagged any major spikes however this was not applied to conductivity and temperature as it resulted in bad data values of oxygen concentration after dynamic corrections.
- Filter - smoothed the high frequency pressure and depth data using a low-pass filter (values of 0.15 - recommended by SeaBird).
- AlignCTD - shifted conductivities and oxygen relative to pressure to compensate for sensor time lag.
- CellTM - ran a recursive filter to remove conductivity cell thermal mass effects from measured conductivity.
- Derive - derived computation variables from the processed pressure, temperature and conductivity.
- Translate - converted the binary data to ASCII.
- BottleSum - created .btl files using a five second window centered around the bottle firing time.
- Strip - removed the first depth variable obtained at the Data Conversion stage.
- Binavg - averaged all variables to 2Hz bins and 1 second bins for LADCP processing.
- AsciiOut - reformatted the 1 second bin files for LADCP processing.
The originator then proceeded to process the data in Matlab as follows:
- Created metadata files to be used as header information for each CTD cast file.
- Read the 24Hz and 2Hz .cnv files created by the SBEProcessing Software into a matlab structure and combined with the metadata.
- Corrected the oxygen channel for deep oxygen hysteresis.
- Manually removed the surface soak and out of water data post-cast.
- A routine similar to WildEdit in the SBE Data Processing was used to automatically despike the temperature, conductivity, salinity, density, oxygen and transmission variables.
- Created bottle files by extracting the scan number of each bottle firing from .bl files and all variables in 5 second windows centred on the bottle firings. Averages, standard deviations, minimum and maximum values over the 5 second window were computed and saved.
- The profiles were split into up and down casts (based on the maximum pressure record).
- Manually removed any spikes and data anomalies.
- Averaged the cast in to 1db and 10db bins. Missing or cropped out data was linearly interpolated for bins between the maximum and minimum pressure. No extrapolation was performed at the surface or bottom.
- Applied oxygen and salinity calibrations. Oxygen and salinity samples were taken from the CTD Niskin bottles to calibrate the respective sensors.
Calibrations
Salinity
A total of 171 salinity samples were taken from Niskin bottles throughout the cruise. Approximately 100 discrete salinity samples were taken from CTD casts in the top 400 m of the water column with the remaining salinity samples taken in deeper water to provide more stable calibration samples for the CTD sensors. The salinities of samples taken ranged between 31.49 psu and 35.05 psu. Samples were placed in crates in the same temperature controlled room as the Autosal (S/N 68959) for 24 hours to acclimatise to the laboratory temperature. At the start and the end of each crate, a standard sea water (SSW) sample was analysed to monitor any drift of the Autosal instrument. For the first crate run (26th May 2018) the Autosal was reading 0.001 psu too high but this was still below the instrument specification of 0.002 psu. This offset increased linearly throughout the cruise. Therefore, for each crate the average of the two SSW offsets was used to correct the Autosal reading. The differences between the Autosal salinity and the primary/secondary CTD salinity were calculated for all 171 salinity samples. A few samples were removed immediately from the calibration because the average salinity recorded by the CTD was more than 1 psu greater than the salinity measured by the Autosal. This was mostly likely a result of human error while sampling and/or completing the logs. The median and standard deviation of the remaining CTD and Autosal salinity differences were calculated for both sensors. All samples with a difference larger than 0.2 standard deviations from the median were excluded. These were predominantly from the top 400 m of the water column where both temperature and salinity gradients were highest. The median offsets were subsequently recalculated. There was no temporal trend so constant offsets were applied.
| Samples Rejected | Salinity sensor offset | |
|---|---|---|
| Sensor 1 | 40 (27.8%) | -0.0071 psu (CTD reading too low) |
| Sensor 2 | 38 (26.4%) | -0.0034 psu (CTD reading too low) |
Oxygen
Discrete samples were taken from the CTD Niskin bottles for analysis using the Winkler titration method. Of the 92 measurements available (average values from triplicate samples), 22 were discarded as they had a standard deviation greater than 1 µmol L-1. This left 70 measurements for the CTD sensor calibration collected from depths between the surface and 3500 m. The offsets between the CTD sensor and the Winkler samples were calculated and the mean offset was -17.08 µmol L-1 with the CTD sensor under-reading. A significant trend in offset with depth was identified:
offset_depth = (-0.00098567 x depth) - 15.9029
Although the mean offset following the above depth correction was zero, a significant trend over time was detected when all values were considered. However, there is a 3 day gap in sampling resulting from the transit time. If the data were split into two separate periods, pre- and post- May 21st 2018, a significant linear trend over time was not detected in either period. This suggested that there was either a jump in the offset around May 21st or that no further correction to the data is necessary. The mean offsets (following the depth correction) pre- and post- May 21st 2018 were -2.9943 and 1.4653 µmol L-1 respectively.
CDOM Fluorometer
A CDOM Fluorometer was mounted to the CTD frame on behalf of Dr Paul Dodd, Norwegian Polar Institute who is responsible for providing calibrated data which will be accessible through https://data.npolar.no/home. The originator of this dataset has stripped this data stream from the final processed files submitted to BODC.
Project Information
Changing Arctic Ocean: Implications for marine biology and biogeochemistry
Changing Arctic Ocean (CAO) is a £16 million, five year (2017-2022) research programme initially funded by the Natural Environment Research Council (NERC). The aim of the CAO programme is to understand how change in the physical environment (ice and ocean) will affect the large-scale ecosystem structure and biogeochemical functioning of the Arctic Ocean, the potential major impacts and provide projections for future ecosystem services. In July 2018, additional projects were added to the programme that were jointly funded by NERC and the German Federal Ministry of Education and Research.
Background
The Arctic Ocean is responding to global climate change in ways that are not yet fully understood and in some cases, not yet identified. The impacts of change in the Arctic are global in range and international in importance. To achieve the aim, the programme has two key research challenges:
- To develop quantified understanding of the structure and functioning of Arctic ecosystems.
- To understand the sensitivity of Arctic ecosystem structure, functioning and services to multiple stressors and the development of projections of the impacts of change.
The decision to fund the CAO project was both scientific and political and is the second largest research programme funded by NERC.
The programme involves 33 organisations, the majority of which are research institutions in the UK and Germany, and over 170 scientists. The programme consists of four large projects with an additional 12 research projects added in July 2018.
Further information can be found on the Changing Arctic Ocean website.
Participants
There are 33 organisations involved in the Changing Arctic Ocean project, these are:
- Alfred Wegener Institut (AWI)
- Bangor University
- British Antarctic Survey (BAS)
- Centre for Environment, Fisheries and Aquaculture Science (CEFAS)
- Durham University
- GEOMAR
- Helmholtz-Zentrum Geesthacht Centre for Materials and Coastal Research
- Lancaster University
- Marine Biological Association (MBA)
- Max Planck Institute for the Science of Human History
- National Oceanography Centre (NOC)
- Newcastle University
- Northumbria University
- Ocean Atmosphere Systems GmbH
- Plymouth Marine Laboratory (PML)
- Scottish Association for Marine Science (SAMS)
- Scottish Universities Environmental Research Centre (SUERC)
- Université Libre de Bruxelles
- University College London (UCL)
- University of Bristol
- University of East Anglia (UEA)
- University of Edinburgh
- University of Glasgow
- University of Huddersfield
- University of Leeds
- University of Liverpool
- University of Manchester
- University of Oldenburg
- University of Oxford
- University of Southampton
- University of St Andrews
- University of Stirling
- University of Strathclyde
In addition to the core organisation, there are a number of international collaborators.
Research Details
The four large projects funded by NERC are:
- Arctic Productivity in the seasonal Ice Zone (Arctic PRIZE)
- Can we detect changes in Arctic ecosystems? (ARISE)
- The Changing Arctic Ocean Seafloor (ChAOS) - How changing sea ice conditions impact biological communities, biogeochemical processes and ecosystems
- Mechanistic understanding of the role of diatoms in the success of the Arctic Calanus complex and implications for a warmer Arctic (DIAPOD)
The additional 12 projects added in July 2018 funded jointly by NERC and the German Federal Ministry of Education and Research are:
- Advective Pathways of nutrients and key Ecological substances in the Arctic (APEAR)
- How will changing freshwater export and terrestrial permafrost thaw influence the Arctic Ocean? (CACOON)
- Chronobiology of changing Arctic Sea Ecosystems (CHASE)
- Potential benefits and risks of borealisation for fish stocks and ecosystems in a changing Arctic Ocean (Coldfish)
- Diatom Autecological Responses with Changes To Ice Cover (Diatom-ARCTIC)
- Ecosystem functions controlled by sea ice and light in a changing Arctic (Eco-Light)
- Effects of ice stressors and pollutants on the Arctic marine cryosphere (EISPAC)
- Linking Oceanography and Multi-specific, spatially-Variable Interactions of seabirds and their prey in the Arctic (LOMVIA)
- Understanding the links between pelagic microbial ecosystems and organic matter cycling in the changing Arctic (Micro-ARC)
- Microbes to Megafauna Modelling of Arctic Seas (MiMeMo)
- Primary productivity driven by escalating Arctic nutrient fluxes? (PEANUTS)
- Pathways and emissions of climate-relevant trace gases in a changing Arctic Ocean (PETRA)
Fieldwork and Data Collection
The programme consists of seven core cruises that survey areas in the Barents Sea and the Fram Strait on board the NERC research vessel RRS James Clark Ross. Measurements will include temperature, salinity, dissolved oxygen, dissolved inorganic carbon, total alkalinity, inorganic nutrients, oxygen and carbon isotopes and underway meteorological and surface ocean observations. In addition to ship based cruise datasets gliders, moorings and animal tags are part of the fieldwork. Further data are collected from model runs.
Data Activity or Cruise Information
Cruise
| Cruise Name | JR17005 |
| Departure Date | 2018-05-08 |
| Arrival Date | 2018-06-08 |
| Principal Scientist(s) | David Pond (University of Stirling, Institute of Aquaculture) |
| Ship | RRS James Clark Ross |
Complete Cruise Metadata Report is available here
Fixed Station Information
Fixed Station Information
| Station Name | CAO NB |
| Category | Offshore location |
| Latitude | 67° 59.90' N |
| Longitude | 3° 59.13' W |
| Water depth below MSL | 3738.0 m |
Changing Arctic Ocean Fixed Station NB
JR17005 cruise was part of the NERC Changing Arctic Ocean inolving ARISE and DIAPOD projects, surveying sections of the Fram Strait at pre-determined locations in the Arctic.
Station NB was a 24 hour test station which involved multiple scientific deployments (see Table 2).
Table 1. Station Summary
| Station | Latitude | Longitude | Water Depth (m) |
|---|---|---|---|
| NB | 67.99834 | -3.98542 | 3735 |
Table 2. Sampling History
| Deployments | |
|---|---|
| CTD casts | 2 |
| Bongo | 1 |
| Stand Alone Pump Systems (SAPS) | 1 |
| MOCNESS | 2 |
| Zooplankton Ring Net | 0 |
| Mega Corer | 0 |
| Day Grab | 0 |
The JR17005 cruise track (Figure 1) displays all stations visited during the cruise including fixed stations (super stations) and skinny stations for reference purposes only.
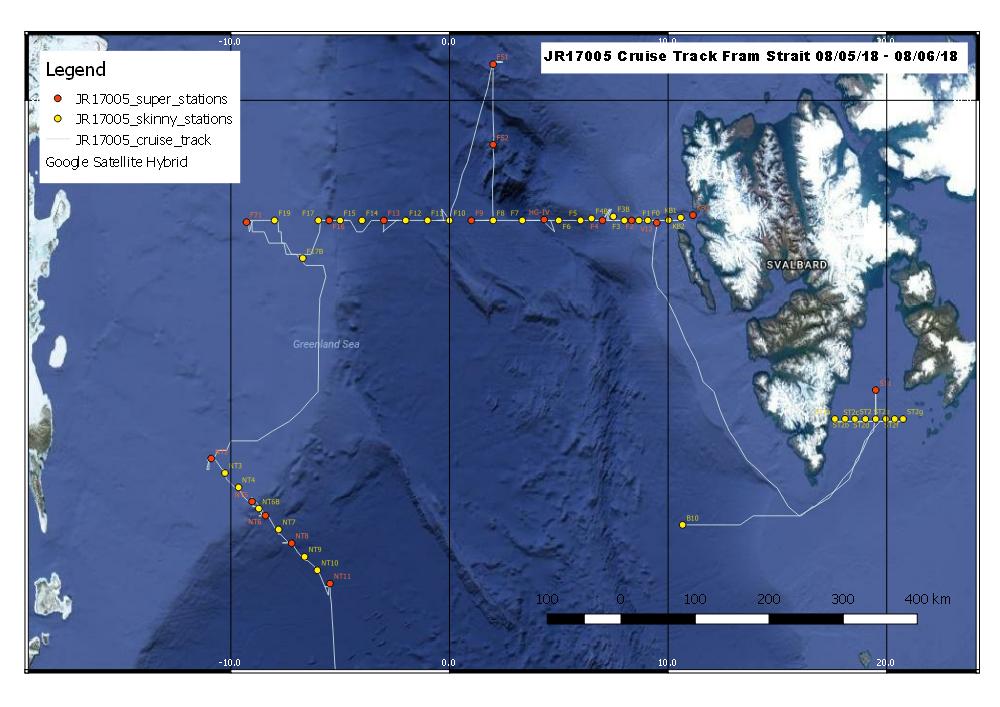
Figure 1. JR17005 Cruise Track
Fixed stations occured at various transects across the survey area, as shown in Figure 2.
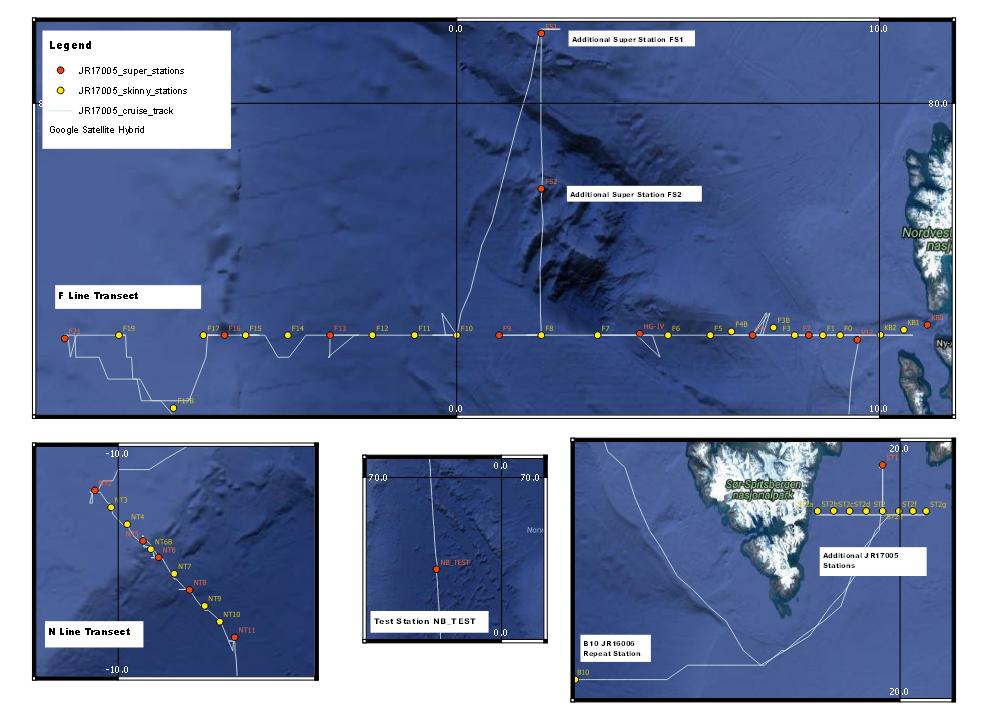
Figure 2. Summary of JR17005 fixed stations (super stations). Skinny stations have been included for reference purposes only.
Related Fixed Station activities are detailed in Appendix 1
BODC Quality Control Flags
The following single character qualifying flags may be associated with one or more individual parameters with a data cycle:
| Flag | Description |
|---|---|
| Blank | Unqualified |
| < | Below detection limit |
| > | In excess of quoted value |
| A | Taxonomic flag for affinis (aff.) |
| B | Beginning of CTD Down/Up Cast |
| C | Taxonomic flag for confer (cf.) |
| D | Thermometric depth |
| E | End of CTD Down/Up Cast |
| G | Non-taxonomic biological characteristic uncertainty |
| H | Extrapolated value |
| I | Taxonomic flag for single species (sp.) |
| K | Improbable value - unknown quality control source |
| L | Improbable value - originator's quality control |
| M | Improbable value - BODC quality control |
| N | Null value |
| O | Improbable value - user quality control |
| P | Trace/calm |
| Q | Indeterminate |
| R | Replacement value |
| S | Estimated value |
| T | Interpolated value |
| U | Uncalibrated |
| W | Control value |
| X | Excessive difference |
SeaDataNet Quality Control Flags
The following single character qualifying flags may be associated with one or more individual parameters with a data cycle:
| Flag | Description |
|---|---|
| 0 | no quality control |
| 1 | good value |
| 2 | probably good value |
| 3 | probably bad value |
| 4 | bad value |
| 5 | changed value |
| 6 | value below detection |
| 7 | value in excess |
| 8 | interpolated value |
| 9 | missing value |
| A | value phenomenon uncertain |
| B | nominal value |
| Q | value below limit of quantification |
Appendix 1: CAO NB
Related series for this Fixed Station are presented in the table below. Further information can be found by following the appropriate links.
If you are interested in these series, please be aware we offer a multiple file download service. Should your credentials be insufficient for automatic download, the service also offers a referral to our Enquiries Officer who may be able to negotiate access.
| Series Identifier | Data Category | Start date/time | Start position | Cruise |
|---|---|---|---|---|
| 1844218 | CTD or STD cast | 2018-05-13 08:03:00 | 67.9983 N, 3.9854 W | RRS James Clark Ross JR17005 |
