Metadata Report for BODC Series Reference Number 1868731
Metadata Summary
Problem Reports
Data Access Policy
Narrative Documents
Project Information
Data Activity or Cruise Information
Fixed Station Information
BODC Quality Flags
SeaDataNet Quality Flags
Metadata Summary
Data Description |
|||||||||||||||||||||||||
|
|||||||||||||||||||||||||
Data Identifiers |
|||||||||||||||||||||||||
|
|||||||||||||||||||||||||
Time Co-ordinates(UT) |
|||||||||||||||||||||||||
|
|||||||||||||||||||||||||
Spatial Co-ordinates | |||||||||||||||||||||||||
|
|||||||||||||||||||||||||
Parameters |
|||||||||||||||||||||||||
|
|||||||||||||||||||||||||
Definition of BOTTFLAG | |||||||||||||||||||||||||
| BOTTFLAG | Definition |
|---|---|
| 0 | The sampling event occurred without any incident being reported to BODC. |
| 1 | The filter in an in-situ sampling pump physically ruptured during sample resulting in an unquantifiable loss of sampled material. |
| 2 | Analytical evidence (e.g. surface water salinity measured on a sample collected at depth) indicates that the water sample has been contaminated by water from depths other than the depths of sampling. |
| 3 | The feedback indicator on the deck unit reported that the bottle closure command had failed. General Oceanics deck units used on NERC vessels in the 80s and 90s were renowned for reporting misfires when the bottle had been closed. This flag is also suitable for when a trigger command is mistakenly sent to a bottle that has previously been fired. |
| 4 | During the sampling deployment the bottle was fired in an order other than incrementing rosette position. Indicative of the potential for errors in the assignment of bottle firing depth, especially with General Oceanics rosettes. |
| 5 | Water was reported to be escaping from the bottle as the rosette was being recovered. |
| 6 | The bottle seals were observed to be incorrectly seated and the bottle was only part full of water on recovery. |
| 7 | Either the bottle was found to contain no sample on recovery or there was no bottle fitted to the rosette position fired (but SBE35 record may exist). |
| 8 | There is reason to doubt the accuracy of the sampling depth associated with the sample. |
| 9 | The bottle air vent had not been closed prior to deployment giving rise to a risk of sample contamination through leakage. |
Definition of Rank |
|
|
Problem Reports
No Problem Report Found in the Database
Data Access Policy
Open Data
These data have no specific confidentiality restrictions for users. However, users must acknowledge data sources as it is not ethical to publish data without proper attribution. Any publication or other output resulting from usage of the data should include an acknowledgment.
If the Information Provider does not provide a specific attribution statement, or if you are using Information from several Information Providers and multiple attributions are not practical in your product or application, you may consider using the following:
"Contains public sector information licensed under the Open Government Licence v1.0."
Narrative Documents
Methane and Nitrous Oxide as part of the ARABESQUE project
Parameter Code Definitions
| CH4DGCDX | Dissolved methane nanomoles/litre |
| Single phase equilibration gas chromatography | |
| CH4SGCDX | Dissolved methane saturation (%) |
| Calculated from methane concentration | |
| DN2OGCTX | Dissolved nitrous oxide (N2O) nanomoles/litre |
| Single phase equilibration gas chromatography | |
| SN2OGCTX | Dissolved nitrous oxide saturation (%) |
| Calculated from nitrous oxide concentration |
Originator Codes
22 Prof. N.J.P. Owens Univ. of Newcastle
Originator Protocols
The dissolved seawater concentrations of nitrous oxide and methane (both important greenhouse gases) was determined simultaneously to high precision using a fully automated headspace equilibration gas chromatographic technique.
Samples were collected in 1 litre glass volumetric flasks and allowed to overflow by at least three volumes. Immediately following collection, the samples were stabilised by the addition of 200µl 0.25M aqueous mercuric chloride and the flasks were stoppered and inverted to disperse the HgCl2. Analysis followed immediately; the samples were thermally equilibrated to 25°C in a water bath and then equilibrated with a headspace of known nitrous oxide and methane. The equilibrated gases were dried and passed over a Carbosorb column to remove CO2 before being separated on Porapak Q columns and injected into the carrier gas lines (ultra high purity nitrogen) of two Shimadzu GC 8A gas chromatographs. The first was equipped with a flame ionisation detector (FID) for the analysis of methane; the second with an electron capture detector (ECD) for the measurement of nitrous oxide.
Two high mixing ratio primary standards were used for calibration, containing 10ppmv nitrous oxide, 5.2 ppmv methane and 20ppmv nitrous oxide, 8.5ppmv methane respectively. For routine calibrations, four secondary standards were prepared from these primary standards by pressure dilution (Upstill-Goddard et.al. 1990); estimates for their accuracy are 1.5% for methane and 2% for nitrous oxide. Analytical precisions are better than 0.5% for nitrous oxide and 0.4% for methane.
GO-FLO Bottle
A water sampling bottle featuring close-open-close operation. The bottle opens automatically at approximately 10 metres and flushes until closed. Sampling with these bottles avoids contamination at the surface, internal spring contamination, loss of sample on deck and exchange of water from different depths.
There are several sizes available, from 1.7 to 100 litres and are made of PVC with a depth rating of up to 500 m. These bottles can be attached to a rosette or placed on a cable at selected positions.
Project Information
ARABESQUE
ARABESQUE was a multidisciplinary oceanographic research project focused on the Arabian Sea and Northwest Indian Ocean during the monsoon and intermonsoon season in 1994. Funding for ARABESQUE was provided by the Ministry of Defence/ Defence Research Agency Joint Grant TQ/10/3/2 and Amersham International as well as the Natural Environment Research Council. ARABESQUE was almost entirely field based with extensive physical, chemical and biological measurements made in the Gulf of Oman, the Arabian Sea and the Northwest Indian Ocean. The aim of the project was to study the upper ocean microbial biogeochemistry in the Arabian Sea. Its focus was carbon and nitrogen cycling processes linked to climate change. The project was a UK contribution to the Joint Global Ocean Flux Study (JGOFS) Process Studies of the Arabian Sea. ARABESQUE was organised by Plymouth Marine Laboratory (PML).
Objectives
The detailed scientific objectives of ARABESQUE were to quantify the seasonal influence of the Monsoon winds in the Arabian Sea on:
-
Upwelling of nutrients and the resultant production and fate of phytoplankton, in terms of size-fractionated, new and regenerated production
-
Vertical and on-shelf gradients of heterotrophic, methanogenic and denitrifying bacteria
-
Distribution of chemotaxonomic pigments with links to optical properties of seawater
-
The Dissolved Inorganic and Organic Carbon cycle
-
Air-sea exchange of Sulphur and Nitrogen biogases including dimethyl sulphide, methylamines and methane
-
Sedimentation rates and the fate of organic matter through the oxygen depleted zone
A final objective was to calibrate satellite data on ocean colour so as to map the biogeochemistry of the northwestern Indian Ocean.
Fieldwork
The fieldwork programme consisted of two cruises of RRS Discovery. Cruise 210 (from 27 August to 4 October 1994) was timed to coincide with the South West Monsoon. Cruise 212 (from 16 November to 19 December 1994) took place during the intermonsoon period through to the onset of the North East Monsoon. The fieldwork programme included three repeated sections;
-
One section along the Gulf of Oman
-
A section at 8°N 67°E to 14° 30N 67°E
-
A major section from 8°N 67°E to the coast of Oman
Other one-off sections were also crossed in the area. Sections were covered by underway upper ocean measurements and by a total of 21 sites where CTD/water-bottle stations were taken, 14 of which were repeated.
Data Management
Data management services to the ARABESQUE project were provided by the British Oceanographic Data Centre, funded by the UK Natural Environment Research Council.
Data Activity or Cruise Information
Data Activity
| Start Date (yyyy-mm-dd) | 1994-12-06 |
| End Date (yyyy-mm-dd) | 1994-12-06 |
| Organization Undertaking Activity | Plymouth Marine Laboratory |
| Country of Organization | United Kingdom |
| Originator's Data Activity Identifier | DI212_CTD_A3/47 |
| Platform Category | lowered unmanned submersible |
BODC Sample Metadata Report for DI212_CTD_A3/47
| Sample reference number | Nominal collection volume(l) | Bottle rosette position | Bottle firing sequence number | Minimum pressure sampled (dbar) | Maximum pressure sampled (dbar) | Depth of sampling point (m) | Bottle type | Sample quality flag | Bottle reference | Comments |
|---|---|---|---|---|---|---|---|---|---|---|
| 69881 | 10.00 | 199.70 | 200.60 | 197.10 | General Oceanics GO-FLO water sampler | No problem reported | ||||
| 69882 | 10.00 | 151.10 | 151.80 | 148.70 | General Oceanics GO-FLO water sampler | No problem reported | ||||
| 69883 | 10.00 | 101.30 | 102.00 | 99.20 | General Oceanics GO-FLO water sampler | No problem reported | ||||
| 69884 | 10.00 | 61.60 | 62.20 | 59.70 | General Oceanics GO-FLO water sampler | No problem reported | ||||
| 69885 | 10.00 | 46.50 | 47.00 | 44.70 | General Oceanics GO-FLO water sampler | No problem reported | ||||
| 69886 | 10.00 | 41.10 | 42.00 | 39.50 | General Oceanics GO-FLO water sampler | No problem reported | ||||
| 69887 | 10.00 | 31.10 | 31.90 | 29.50 | General Oceanics GO-FLO water sampler | No problem reported | ||||
| 69888 | 10.00 | 26.50 | 27.00 | 24.80 | General Oceanics GO-FLO water sampler | No problem reported | ||||
| 69889 | 10.00 | 21.50 | 21.90 | 19.80 | General Oceanics GO-FLO water sampler | No problem reported | ||||
| 69890 | 10.00 | 16.40 | 17.10 | 14.80 | General Oceanics GO-FLO water sampler | No problem reported | ||||
| 69891 | 10.00 | 11.40 | 12.20 | 9.90 | General Oceanics GO-FLO water sampler | No problem reported | ||||
| 69892 | 10.00 | 6.40 | 7.10 | 4.90 | General Oceanics GO-FLO water sampler | No problem reported |
Please note:the supplied parameters may not have been sampled from all the bottle firings described in the table above. Cross-match the Sample Reference Number above against the SAMPRFNM value in the data file to identify the relevant metadata.
Related Data Activity activities are detailed in Appendix 1
Cruise
| Cruise Name | D212 |
| Departure Date | 1994-11-16 |
| Arrival Date | 1994-12-19 |
| Principal Scientist(s) | Peter H Burkill (Plymouth Marine Laboratory) |
| Ship | RRS Discovery |
Complete Cruise Metadata Report is available here
Fixed Station Information
Fixed Station Information
| Station Name | ARABESQUE Arabian Sea Station 3 (A3) |
| Category | Offshore location |
| Latitude | 16° 2.20' N |
| Longitude | 62° 0.00' E |
| Water depth below MSL | 3927.0 m |
ARABESQUE - Arabian Sea Station 3 (A3)
Site A3 is one of 20 ARABESQUE fixed stations illustrated in the map below.
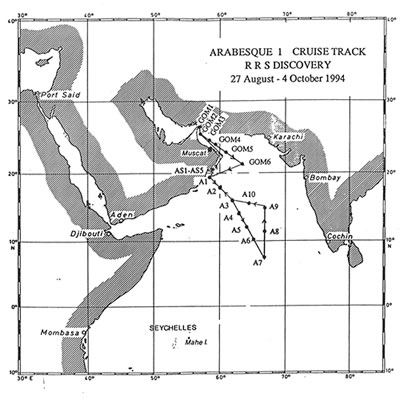
ARABESQUE fixed stations were visited by 2 cruises, namely: RRS Discovery 210 (D210) - 25 August to 05 October 1994 and RRS Discovery 212 (D212) - 16 November to 19 December 1994. The cruises operated in survey and station mode: station mode consisted of profiling, production and trap stations.
More information is available via the D210 and D212 cruise reports.
Related Fixed Station activities are detailed in Appendix 2
BODC Quality Control Flags
The following single character qualifying flags may be associated with one or more individual parameters with a data cycle:
| Flag | Description |
|---|---|
| Blank | Unqualified |
| < | Below detection limit |
| > | In excess of quoted value |
| A | Taxonomic flag for affinis (aff.) |
| B | Beginning of CTD Down/Up Cast |
| C | Taxonomic flag for confer (cf.) |
| D | Thermometric depth |
| E | End of CTD Down/Up Cast |
| G | Non-taxonomic biological characteristic uncertainty |
| H | Extrapolated value |
| I | Taxonomic flag for single species (sp.) |
| K | Improbable value - unknown quality control source |
| L | Improbable value - originator's quality control |
| M | Improbable value - BODC quality control |
| N | Null value |
| O | Improbable value - user quality control |
| P | Trace/calm |
| Q | Indeterminate |
| R | Replacement value |
| S | Estimated value |
| T | Interpolated value |
| U | Uncalibrated |
| W | Control value |
| X | Excessive difference |
SeaDataNet Quality Control Flags
The following single character qualifying flags may be associated with one or more individual parameters with a data cycle:
| Flag | Description |
|---|---|
| 0 | no quality control |
| 1 | good value |
| 2 | probably good value |
| 3 | probably bad value |
| 4 | bad value |
| 5 | changed value |
| 6 | value below detection |
| 7 | value in excess |
| 8 | interpolated value |
| 9 | missing value |
| A | value phenomenon uncertain |
| B | nominal value |
| Q | value below limit of quantification |
Appendix 1: DI212_CTD_A3/47
Related series for this Data Activity are presented in the table below. Further information can be found by following the appropriate links.
If you are interested in these series, please be aware we offer a multiple file download service. Should your credentials be insufficient for automatic download, the service also offers a referral to our Enquiries Officer who may be able to negotiate access.
| Series Identifier | Data Category | Start date/time | Start position | Cruise |
|---|---|---|---|---|
| 1300848 | Water sample data | 1994-12-06 02:42:00 | 16.04143 N, 61.99364 E | RRS Discovery D212 |
| 1664291 | Water sample data | 1994-12-06 02:42:00 | 16.04143 N, 61.99364 E | RRS Discovery D212 |
Appendix 2: ARABESQUE Arabian Sea Station 3 (A3)
Related series for this Fixed Station are presented in the table below. Further information can be found by following the appropriate links.
If you are interested in these series, please be aware we offer a multiple file download service. Should your credentials be insufficient for automatic download, the service also offers a referral to our Enquiries Officer who may be able to negotiate access.
| Series Identifier | Data Category | Start date/time | Start position | Cruise |
|---|---|---|---|---|
| 966125 | CTD or STD cast | 1994-09-11 23:35:00 | 16.0265 N, 62.00467 E | RRS Discovery D210 |
| 1653810 | Water sample data | 1994-09-11 23:47:00 | 16.02646 N, 62.00474 E | RRS Discovery D210 |
| 966137 | CTD or STD cast | 1994-09-12 00:09:00 | 16.02733 N, 62.0015 E | RRS Discovery D210 |
| 966149 | CTD or STD cast | 1994-09-12 00:37:00 | 16.02433 N, 62.00417 E | RRS Discovery D210 |
| 966150 | CTD or STD cast | 1994-09-12 01:09:00 | 16.02033 N, 62.007 E | RRS Discovery D210 |
| 965797 | CTD or STD cast | 1994-09-12 08:57:00 | 15.99617 N, 62.06217 E | RRS Discovery D210 |
| 965804 | CTD or STD cast | 1994-09-12 11:06:00 | 15.98633 N, 62.07067 E | RRS Discovery D210 |
| 965816 | CTD or STD cast | 1994-09-13 00:38:00 | 15.97633 N, 62.10033 E | RRS Discovery D210 |
| 1653809 | Water sample data | 1994-09-13 00:48:00 | 15.97631 N, 62.10038 E | RRS Discovery D210 |
| 965828 | CTD or STD cast | 1994-09-13 02:36:00 | 15.96867 N, 62.09083 E | RRS Discovery D210 |
| 965841 | CTD or STD cast | 1994-09-13 06:08:00 | 15.97417 N, 62.09467 E | RRS Discovery D210 |
| 1851147 | Water sample data | 1994-09-13 06:31:00 | 15.97418 N, 62.09462 E | RRS Discovery D210 |
| 965853 | CTD or STD cast | 1994-09-13 08:37:00 | 15.988 N, 62.1065 E | RRS Discovery D210 |
| 965865 | CTD or STD cast | 1994-09-13 09:31:00 | 15.9895 N, 62.11083 E | RRS Discovery D210 |
| 1851159 | Water sample data | 1994-09-13 11:01:00 | 15.98949 N, 62.11084 E | RRS Discovery D210 |
| 965877 | CTD or STD cast | 1994-09-13 23:45:00 | 15.95717 N, 62.18183 E | RRS Discovery D210 |
| 1653822 | Water sample data | 1994-09-13 23:53:00 | 15.95713 N, 62.1819 E | RRS Discovery D210 |
| 965889 | CTD or STD cast | 1994-09-14 00:25:00 | 15.9505 N, 62.18267 E | RRS Discovery D210 |
| 965890 | CTD or STD cast | 1994-09-14 01:07:00 | 15.94933 N, 62.181 E | RRS Discovery D210 |
| 965908 | CTD or STD cast | 1994-09-14 03:33:00 | 15.94033 N, 62.186 E | RRS Discovery D210 |
| 965921 | CTD or STD cast | 1994-09-14 04:21:00 | 15.9345 N, 62.19067 E | RRS Discovery D210 |
| 1851160 | Water sample data | 1994-09-14 05:30:00 | 15.93447 N, 62.19073 E | RRS Discovery D210 |
| 965933 | CTD or STD cast | 1994-09-14 07:31:00 | 15.92317 N, 62.19783 E | RRS Discovery D210 |
| 965945 | CTD or STD cast | 1994-09-14 09:04:00 | 15.9185 N, 62.19133 E | RRS Discovery D210 |
| 965619 | CTD or STD cast | 1994-09-14 11:29:00 | 15.914 N, 62.19717 E | RRS Discovery D210 |
| 965620 | CTD or STD cast | 1994-09-14 13:29:00 | 15.91133 N, 62.19633 E | RRS Discovery D210 |
| 965632 | CTD or STD cast | 1994-09-15 00:50:00 | 15.92783 N, 62.20433 E | RRS Discovery D210 |
| 965644 | CTD or STD cast | 1994-09-15 01:32:00 | 15.92933 N, 62.20733 E | RRS Discovery D210 |
| 1653834 | Water sample data | 1994-09-15 01:45:00 | 15.92938 N, 62.20734 E | RRS Discovery D210 |
| 965656 | CTD or STD cast | 1994-09-15 07:24:00 | 15.9255 N, 62.22 E | RRS Discovery D210 |
| 965263 | CTD or STD cast | 1994-09-27 23:02:00 | 16.03617 N, 62.002 E | RRS Discovery D210 |
| 1653846 | Water sample data | 1994-09-27 23:13:00 | 16.03614 N, 62.00198 E | RRS Discovery D210 |
| 965275 | CTD or STD cast | 1994-09-27 23:59:00 | 16.03833 N, 62.009 E | RRS Discovery D210 |
| 964930 | CTD or STD cast | 1994-09-28 00:42:00 | 16.04133 N, 62.01633 E | RRS Discovery D210 |
| 964942 | CTD or STD cast | 1994-09-28 02:24:00 | 16.06 N, 62.01633 E | RRS Discovery D210 |
| 1851172 | Water sample data | 1994-09-28 03:57:00 | 16.05996 N, 62.01635 E | RRS Discovery D210 |
| 964954 | CTD or STD cast | 1994-09-28 07:39:00 | 16.0775 N, 62.03517 E | RRS Discovery D210 |
| 964966 | CTD or STD cast | 1994-09-28 08:21:00 | 16.07683 N, 62.04617 E | RRS Discovery D210 |
| 1851184 | Water sample data | 1994-09-28 08:37:00 | 16.07687 N, 62.04614 E | RRS Discovery D210 |
| 967780 | CTD or STD cast | 1994-11-29 23:02:00 | 16.03983 N, 61.99833 E | RRS Discovery D212 |
| 967313 | CTD or STD cast | 1994-11-30 00:37:00 | 16.06317 N, 61.98017 E | RRS Discovery D212 |
| 1300812 | Water sample data | 1994-11-30 01:19:00 | 16.06317 N, 61.98018 E | RRS Discovery D212 |
| 967325 | CTD or STD cast | 1994-11-30 04:14:00 | 16.09933 N, 61.95683 E | RRS Discovery D212 |
| 1300873 | Water sample data | 1994-11-30 04:40:00 | 16.09927 N, 61.95691 E | RRS Discovery D212 |
| 1868755 | Water sample data | 1994-11-30 04:40:00 | 16.09927 N, 61.95691 E | RRS Discovery D212 |
| 967337 | CTD or STD cast | 1994-11-30 07:28:00 | 16.13817 N, 61.91067 E | RRS Discovery D212 |
| 966924 | CTD or STD cast | 1994-12-01 00:10:00 | 16.34983 N, 61.80417 E | RRS Discovery D212 |
| 1300732 | Water sample data | 1994-12-01 00:27:00 | 16.34985 N, 61.80418 E | RRS Discovery D212 |
| 967349 | CTD or STD cast | 1994-12-01 01:26:00 | 16.355 N, 61.8085 E | RRS Discovery D212 |
| 967350 | CTD or STD cast | 1994-12-01 03:54:00 | 16.40483 N, 61.796 E | RRS Discovery D212 |
| 967362 | CTD or STD cast | 1994-12-01 07:56:00 | 16.4335 N, 61.782 E | RRS Discovery D212 |
| 967374 | CTD or STD cast | 1994-12-01 09:38:00 | 16.45367 N, 61.77 E | RRS Discovery D212 |
| 1300744 | Water sample data | 1994-12-01 09:58:00 | 16.45359 N, 61.76993 E | RRS Discovery D212 |
| 1868699 | Water sample data | 1994-12-01 09:58:00 | 16.45359 N, 61.76993 E | RRS Discovery D212 |
| 967386 | CTD or STD cast | 1994-12-02 00:41:00 | 16.622 N, 61.66583 E | RRS Discovery D212 |
| 1300756 | Water sample data | 1994-12-02 00:58:00 | 16.62207 N, 61.66583 E | RRS Discovery D212 |
| 967398 | CTD or STD cast | 1994-12-02 03:59:00 | 16.68567 N, 61.64217 E | RRS Discovery D212 |
| 1300768 | Water sample data | 1994-12-02 04:26:00 | 16.68575 N, 61.64217 E | RRS Discovery D212 |
| 967405 | CTD or STD cast | 1994-12-02 07:54:00 | 16.727 N, 61.62233 E | RRS Discovery D212 |
| 967417 | CTD or STD cast | 1994-12-02 09:04:00 | 16.74433 N, 61.61617 E | RRS Discovery D212 |
| 967429 | CTD or STD cast | 1994-12-04 00:08:00 | 17.2365 N, 61.5025 E | RRS Discovery D212 |
| 1300781 | Water sample data | 1994-12-04 00:24:00 | 17.23645 N, 61.50251 E | RRS Discovery D212 |
| 967430 | CTD or STD cast | 1994-12-04 01:07:00 | 17.2445 N, 61.51383 E | RRS Discovery D212 |
| 966936 | CTD or STD cast | 1994-12-04 02:22:00 | 17.269 N, 61.5125 E | RRS Discovery D212 |
| 1300793 | Water sample data | 1994-12-04 02:46:00 | 17.26895 N, 61.51249 E | RRS Discovery D212 |
| 1868706 | Water sample data | 1994-12-04 02:46:00 | 17.26895 N, 61.51249 E | RRS Discovery D212 |
| 967442 | CTD or STD cast | 1994-12-04 04:26:00 | 17.29167 N, 61.52767 E | RRS Discovery D212 |
| 1300800 | Water sample data | 1994-12-04 06:07:00 | 17.29169 N, 61.5276 E | RRS Discovery D212 |
| 1868718 | Water sample data | 1994-12-04 06:07:00 | 17.29169 N, 61.5276 E | RRS Discovery D212 |
| 967454 | CTD or STD cast | 1994-12-04 09:03:00 | 17.32667 N, 61.528 E | RRS Discovery D212 |
| 967466 | CTD or STD cast | 1994-12-04 10:07:00 | 17.34383 N, 61.5265 E | RRS Discovery D212 |
| 967478 | CTD or STD cast | 1994-12-05 01:08:00 | 17.54 N, 61.54967 E | RRS Discovery D212 |
| 1300824 | Water sample data | 1994-12-05 01:27:00 | 17.54001 N, 61.54969 E | RRS Discovery D212 |
| 967491 | CTD or STD cast | 1994-12-05 08:08:00 | 16.8965 N, 61.75067 E | RRS Discovery D212 |
| 967509 | CTD or STD cast | 1994-12-06 00:34:00 | 16.048 N, 61.98883 E | RRS Discovery D212 |
| 1300836 | Water sample data | 1994-12-06 00:53:00 | 16.04798 N, 61.9888 E | RRS Discovery D212 |
| 967510 | CTD or STD cast | 1994-12-06 02:18:00 | 16.0415 N, 61.99367 E | RRS Discovery D212 |
| 1300848 | Water sample data | 1994-12-06 02:42:00 | 16.04143 N, 61.99364 E | RRS Discovery D212 |
| 967522 | CTD or STD cast | 1994-12-06 03:56:00 | 16.05183 N, 61.99083 E | RRS Discovery D212 |
| 1300861 | Water sample data | 1994-12-06 05:33:00 | 16.05179 N, 61.9908 E | RRS Discovery D212 |
| 1868743 | Water sample data | 1994-12-06 05:33:00 | 16.05179 N, 61.9908 E | RRS Discovery D212 |
| 967534 | CTD or STD cast | 1994-12-06 08:09:00 | 16.0595 N, 61.9675 E | RRS Discovery D212 |
