Metadata Report for BODC Series Reference Number 1980952
Metadata Summary
Problem Reports
Data Access Policy
Narrative Documents
Project Information
Data Activity or Cruise Information
Fixed Station Information
BODC Quality Flags
SeaDataNet Quality Flags
Metadata Summary
Data Description |
|||||||||||||||||||||||||||||||||||||||||
|
|||||||||||||||||||||||||||||||||||||||||
Data Identifiers |
|||||||||||||||||||||||||||||||||||||||||
|
|||||||||||||||||||||||||||||||||||||||||
Time Co-ordinates(UT) |
|||||||||||||||||||||||||||||||||||||||||
|
|||||||||||||||||||||||||||||||||||||||||
Spatial Co-ordinates | |||||||||||||||||||||||||||||||||||||||||
|
|||||||||||||||||||||||||||||||||||||||||
Parameters |
|||||||||||||||||||||||||||||||||||||||||
|
|||||||||||||||||||||||||||||||||||||||||
Definition of BOTTFLAG | |||||||||||||||||||||||||||||||||||||||||
| BOTTFLAG | Definition |
|---|---|
| 0 | The sampling event occurred without any incident being reported to BODC. |
| 1 | The filter in an in-situ sampling pump physically ruptured during sample resulting in an unquantifiable loss of sampled material. |
| 2 | Analytical evidence (e.g. surface water salinity measured on a sample collected at depth) indicates that the water sample has been contaminated by water from depths other than the depths of sampling. |
| 3 | The feedback indicator on the deck unit reported that the bottle closure command had failed. General Oceanics deck units used on NERC vessels in the 80s and 90s were renowned for reporting misfires when the bottle had been closed. This flag is also suitable for when a trigger command is mistakenly sent to a bottle that has previously been fired. |
| 4 | During the sampling deployment the bottle was fired in an order other than incrementing rosette position. Indicative of the potential for errors in the assignment of bottle firing depth, especially with General Oceanics rosettes. |
| 5 | Water was reported to be escaping from the bottle as the rosette was being recovered. |
| 6 | The bottle seals were observed to be incorrectly seated and the bottle was only part full of water on recovery. |
| 7 | Either the bottle was found to contain no sample on recovery or there was no bottle fitted to the rosette position fired (but SBE35 record may exist). |
| 8 | There is reason to doubt the accuracy of the sampling depth associated with the sample. |
| 9 | The bottle air vent had not been closed prior to deployment giving rise to a risk of sample contamination through leakage. |
Definition of Rank |
|
|
Problem Reports
No Problem Report Found in the Database
Data Access Policy
Open Data
These data have no specific confidentiality restrictions for users. However, users must acknowledge data sources as it is not ethical to publish data without proper attribution. Any publication or other output resulting from usage of the data should include an acknowledgment.
If the Information Provider does not provide a specific attribution statement, or if you are using Information from several Information Providers and multiple attributions are not practical in your product or application, you may consider using the following:
"Contains public sector information licensed under the Open Government Licence v1.0."
Narrative Documents
Niskin Bottle
The Niskin bottle is a device used by oceanographers to collect subsurface seawater samples. It is a plastic bottle with caps and rubber seals at each end and is deployed with the caps held open, allowing free-flushing of the bottle as it moves through the water column.
Standard Niskin
The standard version of the bottle includes a plastic-coated metal spring or elastic cord running through the interior of the bottle that joins the two caps, and the caps are held open against the spring by plastic lanyards. When the bottle reaches the desired depth the lanyards are released by a pressure-actuated switch, command signal or messenger weight and the caps are forced shut and sealed, trapping the seawater sample.
Lever Action Niskin
The Lever Action Niskin Bottle differs from the standard version, in that the caps are held open during deployment by externally mounted stainless steel springs rather than an internal spring or cord. Lever Action Niskins are recommended for applications where a completely clear sample chamber is critical or for use in deep cold water.
Clean Sampling
A modified version of the standard Niskin bottle has been developed for clean sampling. This is teflon-coated and uses a latex cord to close the caps rather than a metal spring. The clean version of the Levered Action Niskin bottle is also teflon-coated and uses epoxy covered springs in place of the stainless steel springs. These bottles are specifically designed to minimise metal contamination when sampling trace metals.
Deployment
Bottles may be deployed singly clamped to a wire or in groups of up to 48 on a rosette. Standard bottles and Lever Action bottles have a capacity between 1.7 and 30 L. Reversing thermometers may be attached to a spring-loaded disk that rotates through 180° on bottle closure.
Turner Designs Trilogy Fluorometer
The Trilogy Laboratory Fluorometer is a compact laboratory instrument for making fluorescence, absorbance and turbidity measurements using the appropriate snap-in Application Module.
The following snap-in application modules are available:
| Application | Minimum Detection Limit | Linear Range | Comments | |
|---|---|---|---|---|
| Ammonium | 0.05µmol | 0-50µmol | ||
| CDOM/FDOM | 0.1 ppb | 0 - 1000 ppb | Quinine sulphate | |
| Chlorophyll-a extracted (acidification) | 0.025 µg l-1 | 0-300 µg l-1 | ||
| Chlorophyll-a extracted (non-acidification) | 0.025 µg l-1 | 0-300 µg l-1 | ||
| Chlorophyll in vivo | 0.025 µg l-1 | 0-300 µg l-1 | ||
| Fluorescein dye standard range | 0.01 ppb | 0-200 ppb | ||
| Fluorescein dye extended range | 0.75 ppb | 0-8000 ppb | Minicell adapter P/N 8000-936 and P/N 7000-950 required | |
| Histamine | 0.001 ppm | 0-100 ppm | ||
| Histamine (PTSA) | 0.5 ppm | 0-2,000 ppm | ||
| Nitrate (absorbance) | 0.04 mg l-1 | 0 - 14 mg l-1 | ||
| Crude Oil | 0.2 ppb | 0 - 2,000 ppb | Quinine sulphate | |
| Refined Oil | 0.25 ppb | 0 - 6,000 ppb Napthalene | 1,5 Naphthalene disulfonic disodium salt | |
| Optical Brighteners | 1 ppb | 0 - 10,000 ppb | Quinine sulphate | |
| Phosphate (absorbance) | 1 µg l-1 | 0 - 930 µg l-1 | ||
| Phycocyanin (freshwater) | 150 cells ml-1 | 0 - 150,000 cells ml-1 | ||
| Phycoerythrin (marine) | 150 cells ml-1 | 0 - 150,000 cells ml-1 | ||
| Pyrene tetra sulfonic acid (PTSA) | 0.1 ppb | >10,000 ppb | ||
| Rhodamine WT | 0.01 ppb | 0 - 500 ppb | ||
| Silicate (absorbance) | 3 µg l-1 | 0 - 3000 µg l-1 | ||
| Turbidity | 0.05 NTU | 0 - 1000 NTU |
For extracted chlorophyll measurements using EPA 445, Trilogy automatically calculates the concentration using the filtered and solvent volumes. The turbidity modules use an IRLED with a wavelength of 860nm to meet ISO 7027 standards for turbidity water quality measurements.
Specifications
| Power | 100 to 240VAC Universal Power Supply, Output 12VDC 0.84A Max |
|---|---|
| Operating Temperature | 15-40 °C |
| Size | 32.82 cm depth, 26.52 cm width, 21.39 height |
| Weight | 3.65 kg |
| Readout | Direct concentration (µg l-1, ppb etc.) |
| Light source and detector | Light emitting diode and photodiode |
| Data output | 100% ASCII format through a 9-pin RS-232 serial cable at 9600 baud |
| PC operating system | Windows 98 or later |
Further details can be found in the manufacturer's specification sheet.
Changing Arctic Ocean cruise JR16006 Chlorophyll and Phaeophytin samples from CTD bottles
Originator's Protocol for Data Acquisition and Analysis
Water was collected from six CTD bottles at various depths throughout the water column. The water was pre-screened with a 200 µm mesh attached at the end of a blacked out acid washed silicone tubing and collected into 10 l acid washed carboys and stored in black bags either in the cold room or on deck in low light area. The location of the samples for storage until processing was dependent on the surface water temperature at the time of collection.
After collection approximately 0.5 l of water was filtered through a 47 mm GF/F filter using a deionised water rinsed filtration unit. All samples were done in duplicate and transferred to a labeled 15 ml centrifuge tube and frozen at -20°C.
Analysis took place at The Scottish Association for Marine Science, with samples being extracted in 8 ml of 90% neutralised acetone overnight in the dark at 4°C, for no more than 24 hours. The filters were sonicated for one minute and then centrifuged at 4000 rpm for 6 minutes after which they were measured with a fluorometer.
The fluorometer was calibrated using chlorophyll-a concentrations extract from spinach (Sigma Aldrich C5753-1MG), the working chlorophyll stock concentration verified by measurements taken by a scanning spectrometer and calculations applied. Standards and samples were kept at the same temperature for analysis on the fluorometer. Blanks (90% neutralised acetone) were measured every 8 samples and a solid state secondary standard (Turner designs P/No 8000-952) to check the stability of the fluorometer and to account for drift.
BODC Data Processing Procedures
Data were received in a single spreadsheet containing the pigment concentrations (concentration and respective standard deviation) and associated metadata. Originator's parameters were mapped to BODC parameter codes and metadata checked against BODC's database. No unit conversions were required as the originator's units were found to be equivalent to those used by BODC.
Discrepancies in Niskin bottle numbers for CTD# 23, Originator's ID# 235 were identified and corrected. This was reported to the originator.
The originator's parameters were mapped to BODC parameter codes as follows:
| Originator's Parameter | Originator's Units | BODC Parameter Code | BODC Standard Deviation Code | BODC Units | Comment |
|---|---|---|---|---|---|
| Chla ug/l | µg l-1 | CPHLFLP1 | CLSDFLP1 | mg m-3 | Equivalent units |
| Phaeo ug/l | µg l-1 | PHEOPH01 | PHEOPHSD | mg m-3 | Equivalent units |
Project Information
Changing Arctic Ocean: Implications for marine biology and biogeochemistry
Changing Arctic Ocean (CAO) is a £16 million, five year (2017-2022) research programme initially funded by the Natural Environment Research Council (NERC). The aim of the CAO programme is to understand how change in the physical environment (ice and ocean) will affect the large-scale ecosystem structure and biogeochemical functioning of the Arctic Ocean, the potential major impacts and provide projections for future ecosystem services. In July 2018, additional projects were added to the programme that were jointly funded by NERC and the German Federal Ministry of Education and Research.
Background
The Arctic Ocean is responding to global climate change in ways that are not yet fully understood and in some cases, not yet identified. The impacts of change in the Arctic are global in range and international in importance. To achieve the aim, the programme has two key research challenges:
- To develop quantified understanding of the structure and functioning of Arctic ecosystems.
- To understand the sensitivity of Arctic ecosystem structure, functioning and services to multiple stressors and the development of projections of the impacts of change.
The decision to fund the CAO project was both scientific and political and is the second largest research programme funded by NERC.
The programme involves 33 organisations, the majority of which are research institutions in the UK and Germany, and over 170 scientists. The programme consists of four large projects with an additional 12 research projects added in July 2018.
Further information can be found on the Changing Arctic Ocean website.
Participants
There are 33 organisations involved in the Changing Arctic Ocean project, these are:
- Alfred Wegener Institut (AWI)
- Bangor University
- British Antarctic Survey (BAS)
- Centre for Environment, Fisheries and Aquaculture Science (CEFAS)
- Durham University
- GEOMAR
- Helmholtz-Zentrum Geesthacht Centre for Materials and Coastal Research
- Lancaster University
- Marine Biological Association (MBA)
- Max Planck Institute for the Science of Human History
- National Oceanography Centre (NOC)
- Newcastle University
- Northumbria University
- Ocean Atmosphere Systems GmbH
- Plymouth Marine Laboratory (PML)
- Scottish Association for Marine Science (SAMS)
- Scottish Universities Environmental Research Centre (SUERC)
- Université Libre de Bruxelles
- University College London (UCL)
- University of Bristol
- University of East Anglia (UEA)
- University of Edinburgh
- University of Glasgow
- University of Huddersfield
- University of Leeds
- University of Liverpool
- University of Manchester
- University of Oldenburg
- University of Oxford
- University of Southampton
- University of St Andrews
- University of Stirling
- University of Strathclyde
In addition to the core organisation, there are a number of international collaborators.
Research Details
The four large projects funded by NERC are:
- Arctic Productivity in the seasonal Ice Zone (Arctic PRIZE)
- Can we detect changes in Arctic ecosystems? (ARISE)
- The Changing Arctic Ocean Seafloor (ChAOS) - How changing sea ice conditions impact biological communities, biogeochemical processes and ecosystems
- Mechanistic understanding of the role of diatoms in the success of the Arctic Calanus complex and implications for a warmer Arctic (DIAPOD)
The additional 12 projects added in July 2018 funded jointly by NERC and the German Federal Ministry of Education and Research are:
- Advective Pathways of nutrients and key Ecological substances in the Arctic (APEAR)
- How will changing freshwater export and terrestrial permafrost thaw influence the Arctic Ocean? (CACOON)
- Chronobiology of changing Arctic Sea Ecosystems (CHASE)
- Potential benefits and risks of borealisation for fish stocks and ecosystems in a changing Arctic Ocean (Coldfish)
- Diatom Autecological Responses with Changes To Ice Cover (Diatom-ARCTIC)
- Ecosystem functions controlled by sea ice and light in a changing Arctic (Eco-Light)
- Effects of ice stressors and pollutants on the Arctic marine cryosphere (EISPAC)
- Linking Oceanography and Multi-specific, spatially-Variable Interactions of seabirds and their prey in the Arctic (LOMVIA)
- Understanding the links between pelagic microbial ecosystems and organic matter cycling in the changing Arctic (Micro-ARC)
- Microbes to Megafauna Modelling of Arctic Seas (MiMeMo)
- Primary productivity driven by escalating Arctic nutrient fluxes? (PEANUTS)
- Pathways and emissions of climate-relevant trace gases in a changing Arctic Ocean (PETRA)
Fieldwork and Data Collection
The programme consists of seven core cruises that survey areas in the Barents Sea and the Fram Strait on board the NERC research vessel RRS James Clark Ross. Measurements will include temperature, salinity, dissolved oxygen, dissolved inorganic carbon, total alkalinity, inorganic nutrients, oxygen and carbon isotopes and underway meteorological and surface ocean observations. In addition to ship based cruise datasets gliders, moorings and animal tags are part of the fieldwork. Further data are collected from model runs.
Data Activity or Cruise Information
Data Activity
| Start Date (yyyy-mm-dd) | 2017-08-03 |
| End Date (yyyy-mm-dd) | 2017-08-03 |
| Organization Undertaking Activity | National Oceanography Centre, Liverpool |
| Country of Organization | United Kingdom |
| Originator's Data Activity Identifier | JR16006_CTD_CTD048 |
| Platform Category | lowered unmanned submersible |
BODC Sample Metadata Report for JR16006_CTD_CTD048
| Sample reference number | Nominal collection volume(l) | Bottle rosette position | Bottle firing sequence number | Minimum pressure sampled (dbar) | Maximum pressure sampled (dbar) | Depth of sampling point (m) | Bottle type | Sample quality flag | Bottle reference | Comments |
|---|---|---|---|---|---|---|---|---|---|---|
| 1256375 | 20.00 | 1 | 1 | 308.50 | Niskin bottle | No problem reported | ||||
| 1256378 | 20.00 | 2 | 2 | 308.40 | Niskin bottle | No problem reported | ||||
| 1256381 | 20.00 | 3 | 3 | 279.20 | Niskin bottle | No problem reported | ||||
| 1256384 | 20.00 | 4 | 4 | 249.40 | Niskin bottle | No problem reported | ||||
| 1256387 | 20.00 | 5 | 5 | 249.30 | Niskin bottle | No problem reported | ||||
| 1256390 | 20.00 | 6 | 6 | 199.20 | Niskin bottle | No problem reported | ||||
| 1256393 | 20.00 | 7 | 7 | 199.20 | Niskin bottle | No problem reported | ||||
| 1256396 | 20.00 | 8 | 8 | 139.60 | Niskin bottle | No problem reported | ||||
| 1256399 | 20.00 | 9 | 9 | 139.70 | Niskin bottle | No problem reported | ||||
| 1256402 | 20.00 | 10 | 10 | 99.60 | Niskin bottle | No problem reported | ||||
| 1256405 | 20.00 | 11 | 11 | 99.60 | Niskin bottle | No problem reported | ||||
| 1256408 | 20.00 | 12 | 12 | 49.40 | Niskin bottle | No problem reported | ||||
| 1256411 | 20.00 | 13 | 13 | 49.40 | Niskin bottle | No problem reported | ||||
| 1256414 | 20.00 | 14 | 14 | 39.50 | Niskin bottle | No problem reported | ||||
| 1256417 | 20.00 | 15 | 15 | 27.90 | Niskin bottle | No problem reported | ||||
| 1256420 | 20.00 | 16 | 16 | 27.80 | Niskin bottle | No problem reported | ||||
| 1256423 | 20.00 | 17 | 17 | 28.00 | Niskin bottle | No problem reported | ||||
| 1256426 | 20.00 | 18 | 18 | 17.80 | Niskin bottle | No problem reported | ||||
| 1256429 | 20.00 | 19 | 19 | 11.90 | Niskin bottle | No problem reported | ||||
| 1256432 | 20.00 | 20 | 20 | 5.50 | Niskin bottle | No problem reported | ||||
| 1256435 | 20.00 | 21 | 21 | 5.50 | Niskin bottle | No problem reported | ||||
| 1256438 | 20.00 | 22 | 22 | 2.70 | Niskin bottle | No problem reported | ||||
| 1256441 | 20.00 | 23 | 23 | 2.70 | Niskin bottle | No problem reported | ||||
| 1256444 | 20.00 | 24 | 24 | 2.80 | Niskin bottle | No problem reported |
Please note:the supplied parameters may not have been sampled from all the bottle firings described in the table above. Cross-match the Sample Reference Number above against the SAMPRFNM value in the data file to identify the relevant metadata.
Related Data Activity activities are detailed in Appendix 1
Cruise
| Cruise Name | JR16006 |
| Departure Date | 2017-06-30 |
| Arrival Date | 2017-08-15 |
| Principal Scientist(s) | Jo Hopkins (National Oceanography Centre, Liverpool) |
| Ship | RRS James Clark Ross |
Complete Cruise Metadata Report is available here
Fixed Station Information
Fixed Station Information
| Station Name | CAO-B7 |
| Category | Offshore location |
| Latitude | 76° 0.00' N |
| Longitude | 16° 49.80' E |
| Water depth below MSL | 325.0 m |
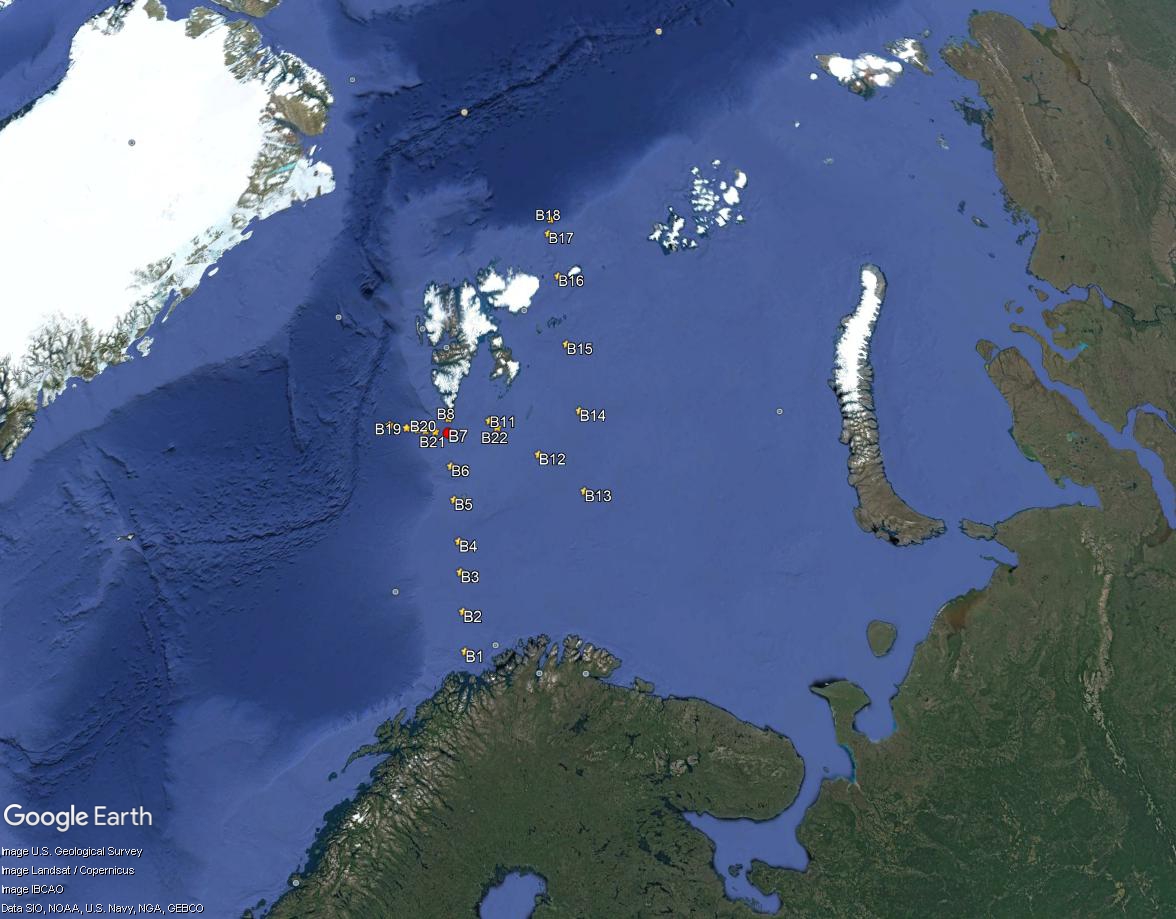
Changing Arctic Ocean Fixed Station B7
This station is one of several sites sampled on the Barents Sea as part of the Changing Arctic Ocean programme. The station has a mean water depth 325 m at the following co-ordinates:
| Latitude | Longitude |
|---|---|
| 76° N | 16.83° E |
The position of this station relative to the other Changing Arctic Ocean sites can be seen from the figure below (in red).
Sampling History
| JR16006 | |
|---|---|
| CTD casts | 2 |
| Grab | 1 |
| Multi-core | 3 |
| Shallow Underwater Camera System (SUCS) | 1 |
| Stand Alone Pump Systems (SAPS) | 1 |
| Zooplankton net hauls | 4 |
Related Fixed Station activities are detailed in Appendix 2
BODC Quality Control Flags
The following single character qualifying flags may be associated with one or more individual parameters with a data cycle:
| Flag | Description |
|---|---|
| Blank | Unqualified |
| < | Below detection limit |
| > | In excess of quoted value |
| A | Taxonomic flag for affinis (aff.) |
| B | Beginning of CTD Down/Up Cast |
| C | Taxonomic flag for confer (cf.) |
| D | Thermometric depth |
| E | End of CTD Down/Up Cast |
| G | Non-taxonomic biological characteristic uncertainty |
| H | Extrapolated value |
| I | Taxonomic flag for single species (sp.) |
| K | Improbable value - unknown quality control source |
| L | Improbable value - originator's quality control |
| M | Improbable value - BODC quality control |
| N | Null value |
| O | Improbable value - user quality control |
| P | Trace/calm |
| Q | Indeterminate |
| R | Replacement value |
| S | Estimated value |
| T | Interpolated value |
| U | Uncalibrated |
| W | Control value |
| X | Excessive difference |
SeaDataNet Quality Control Flags
The following single character qualifying flags may be associated with one or more individual parameters with a data cycle:
| Flag | Description |
|---|---|
| 0 | no quality control |
| 1 | good value |
| 2 | probably good value |
| 3 | probably bad value |
| 4 | bad value |
| 5 | changed value |
| 6 | value below detection |
| 7 | value in excess |
| 8 | interpolated value |
| 9 | missing value |
| A | value phenomenon uncertain |
| B | nominal value |
| Q | value below limit of quantification |
Appendix 1: JR16006_CTD_CTD048
Related series for this Data Activity are presented in the table below. Further information can be found by following the appropriate links.
If you are interested in these series, please be aware we offer a multiple file download service. Should your credentials be insufficient for automatic download, the service also offers a referral to our Enquiries Officer who may be able to negotiate access.
| Series Identifier | Data Category | Start date/time | Start position | Cruise |
|---|---|---|---|---|
| 2012985 | Water sample data | 2017-08-03 09:12:30 | 76.00012 N, 16.83357 E | RRS James Clark Ross JR16006 |
| 2043370 | Water sample data | 2017-08-03 09:12:30 | 76.00012 N, 16.83357 E | RRS James Clark Ross JR16006 |
| 2052293 | Water sample data | 2017-08-03 09:12:30 | 76.00012 N, 16.83357 E | RRS James Clark Ross JR16006 |
| 2056337 | Water sample data | 2017-08-03 09:12:30 | 76.00012 N, 16.83357 E | RRS James Clark Ross JR16006 |
| 2056583 | Water sample data | 2017-08-03 09:12:30 | 76.00012 N, 16.83357 E | RRS James Clark Ross JR16006 |
| 1980779 | Water sample data | 2017-08-03 09:13:00 | 76.00012 N, 16.83357 E | RRS James Clark Ross JR16006 |
| 1981734 | Water sample data | 2017-08-03 09:13:00 | 76.00012 N, 16.83357 E | RRS James Clark Ross JR16006 |
Appendix 2: CAO-B7
Related series for this Fixed Station are presented in the table below. Further information can be found by following the appropriate links.
If you are interested in these series, please be aware we offer a multiple file download service. Should your credentials be insufficient for automatic download, the service also offers a referral to our Enquiries Officer who may be able to negotiate access.
| Series Identifier | Data Category | Start date/time | Start position | Cruise |
|---|---|---|---|---|
| 1837603 | CTD or STD cast | 2017-07-11 15:29:00 | 76.0001 N, 16.8325 E | RRS James Clark Ross JR16006 |
| 2042919 | Water sample data | 2017-07-11 15:48:00 | 76.00014 N, 16.83257 E | RRS James Clark Ross JR16006 |
| 1838077 | CTD or STD cast | 2017-08-03 08:59:00 | 76.0001 N, 16.8334 E | RRS James Clark Ross JR16006 |
| 2012985 | Water sample data | 2017-08-03 09:12:30 | 76.00012 N, 16.83357 E | RRS James Clark Ross JR16006 |
| 2043370 | Water sample data | 2017-08-03 09:12:30 | 76.00012 N, 16.83357 E | RRS James Clark Ross JR16006 |
| 2052293 | Water sample data | 2017-08-03 09:12:30 | 76.00012 N, 16.83357 E | RRS James Clark Ross JR16006 |
| 2056337 | Water sample data | 2017-08-03 09:12:30 | 76.00012 N, 16.83357 E | RRS James Clark Ross JR16006 |
| 2056583 | Water sample data | 2017-08-03 09:12:30 | 76.00012 N, 16.83357 E | RRS James Clark Ross JR16006 |
| 1980779 | Water sample data | 2017-08-03 09:13:00 | 76.00012 N, 16.83357 E | RRS James Clark Ross JR16006 |
| 1981734 | Water sample data | 2017-08-03 09:13:00 | 76.00012 N, 16.83357 E | RRS James Clark Ross JR16006 |
| 1918907 | CTD or STD cast | 2018-07-03 14:30:00 | 75.9998 N, 16.83 E | RRS James Clark Ross JR17006 |
| 2042840 | Water sample data | 2018-07-03 14:47:30 | 75.99805 N, 16.86163 E | RRS James Clark Ross JR17006 |
| 2081863 | Water sample data | 2018-07-03 14:47:30 | 75.99805 N, 16.86163 E | RRS James Clark Ross JR17006 |
| 1965943 | Water sample data | 2018-07-03 14:48:00 | 75.99805 N, 16.86163 E | RRS James Clark Ross JR17006 |
