Metadata Report for BODC Series Reference Number 2027806
Metadata Summary
Problem Reports
Data Access Policy
Narrative Documents
Project Information
Data Activity or Cruise Information
Fixed Station Information
BODC Quality Flags
SeaDataNet Quality Flags
Metadata Summary
Data Description |
|||||||||||||||||||||||||||||
|
|||||||||||||||||||||||||||||
Data Identifiers |
|||||||||||||||||||||||||||||
|
|||||||||||||||||||||||||||||
Time Co-ordinates(UT) |
|||||||||||||||||||||||||||||
|
|||||||||||||||||||||||||||||
Spatial Co-ordinates | |||||||||||||||||||||||||||||
|
|||||||||||||||||||||||||||||
Parameters |
|||||||||||||||||||||||||||||
|
|||||||||||||||||||||||||||||
|
|||||||||||||||||||||||||||||
Problem Reports
No Problem Report Found in the Database
Data Access Policy
Open Data
These data have no specific confidentiality restrictions for users. However, users must acknowledge data sources as it is not ethical to publish data without proper attribution. Any publication or other output resulting from usage of the data should include an acknowledgment.
If the Information Provider does not provide a specific attribution statement, or if you are using Information from several Information Providers and multiple attributions are not practical in your product or application, you may consider using the following:
"Contains public sector information licensed under the Open Government Licence v1.0."
Narrative Documents
Kongsberg EM122 12kHz Multibeam Echosounder
The EM122 is designed to perform seabed mapping to full ocean depth with a high resolution, coverage and accuracy. Beam focusing is applied both during reception and transmission. The system has up to 288 beams/432 soundings per swath with pointing angles, which are automatically adjusted according to achievable coverage or operator defined limits.
This model uses both Continuous Wave and Frequency Modulated sweep pulses with pulse compression on reception, in order to increase the maximum useful swath width. The transmit fan is split in several individual sectors, with independent active steering, in order to compensate for the vessel movements.
In multiplying mode, two swaths per ping cycle are generated, with up to 864 soundings. The beam spacing is equidistant or equiangular and the transmit fan is duplicated and transmitted with a small difference in along track tilt, which takes into account depth coverage and vessel speed, to give a constant sounding separation along track. In high density mode, more than one sounding per beam can be produced, such that horizontal resolution is increased and is almost constant over the whole swath.
The EM122 transducers are modular linear arrays in a Mills cross configuration with separate units for transmit and receive. If used to deliver sub-bottom profiling capabilities with a very narrow beamwidth, this system is known as SBP120 Sub-Bottom Profiler.
The specification sheet can be accessed here Kongsberg EM122.
Specifications
| Operational frequency | 12 Hz |
| Depth range | 20 to 11000 m |
| Swath width | 6 x depth, to approximately 30 km |
| Pulse forms | Continuous Wave and Frequency Modulated chirp |
| Swath profiles per ping | 1 or 2 |
| Sounding pattern | equidistant on bottom/equiangular |
| Depth resolution of soundings | 1 cm |
| Sidelobe suppression | -25 dB |
| Suppression of sounding artefacts | 9 frequency coded transmit sectors |
| Beam focusing | On transmit (per sector) and on reception (dynamic) |
| Swath width control | manual or automatic, all soundings intact even with reduced swath width |
| Motion compensation | |
| Yaw | ± 10° |
| Pitch | ± 10° |
| Roll | ± 15° |
EM122 versions
| System version | 0.5x1 | 1x1 | 1x2 | 2x2 | 2x4 | 4x4 |
| Transmit array (°) | 150x0.5 | 150x1 | 150x1 | 150x2 | 150x2 | 150x4 |
| Receive array (°) | 1x30 | 1x30 | 2x30 | 2x30 | 4x30 | 4x30 |
| No of beams/swath | 288 | 288 | 288 | 288 | 144 | 144 |
| Max no of soundings/swath | 432 | 432 | 432 | 432 | 216 | 216 |
| Max no of swaths/ping | 2 | 2 | 2 | 1 | 1 | 1 |
| Max no of soundings/ping | 864 | 864 | 864 | 432 | 216 | 216 |
DY108(109) CLASS Marine Protected Area Bathymetry: Processing by BODC
The multibeam bathymetry data from DY108(109) in the North Sea were supplied to BODC as ASCII XYZ files from the Kongsberg EM122 system. The dataset was transferred into a common format, a netCDF subset. The following table shows how the variables within the files were mapped to the appropriate BODC parameter codes:
| Original parameter name | Original Units | BODC Parameter Code | BODC Units | Comments |
|---|---|---|---|---|
| Latitude | Degrees | ALATGP01 | Degrees | - |
| Longitude | Degrees | ALONGP01 | Degrees | - |
| Seafloor height | Metres | MBTHHGHT | Metres | - |
Following transfer, the data are screened visually, using BODC's in-house visualisation software, and any spikes or instrument malfunctions are clearly labelled with quality control flags.
DY108(109) CLASS Marine Protected Areas Bathymetry: Originator's Data Processing
Sampling strategy
Multibeam bathymetry data were collected at the Darwin Mounds Marine Protected Area (MPA) in the northern Rockall Trough region of the North Atlantic, approximately 160 km northwest of Cape Wrath, Scotland. The mapping was completed with the aim of continuing the repeated observation of the Darwin Mounds MPA and monitoring of its cold-water coral habitat. This dataset was collected during cruise DY108(109) under the NERC-funded Climate Linked Atlantic Sector Science (CLASS) Programme.
Multibeam bathymetry data were collected using shipboard Kongsberg EM122 in deeper waters between 6th September and 2nd October 2019. The Kongsberg EM710 instrument was used sparingly for times in shallower water, such as the Solent during passage, and The Minch when sheltering from bad weather. The processed EM710 data have not been supplied to BODC.
Data Acquisition and Initial Processing
The 12 kHz Kongsberg EM122 system was set to DEEP mode and to have equidistant sampling. Some depth filters were applied during acquisition as the system often lost lock on the seafloor without it. Sound velocity profiles were calculated from CTD profiles during the cruise, calculated using the Chen and Millero formula, and entered into the systems. The offsets, lever arms and calibration values were inserted into the acquisition system from the previous trials cruise DY107.
Processing of the bathymetry data was performed using Caris HIPS and SIPS software v9.1, using a vessel file of zero offsets and no attitude corrections. Tide was estimated using NOC's POLPRED software and added as a tide correction file and applied to the EM122 data. However, being a deep-water system it was assumed 1 percent depth errors were considerably higher than the tidal range of 1.5m. The data were quite noisy but easily edited using the swath and subset editors within Caris.
A small amount of interpolation was equired to fill small gaps due to poor data caused by bad weather. The mounds themselves were not visible on the map due to their minimal height in comparison with the vertical error in the multibeam sysytem, estimated to be about 5-10m (1 percent). Bathymetric grids were produced at 100m, 50m and 25m resolution using the CUBE method (IHO S44 Order 2 using density and locale). The 100m grid was exported in Geographic decimal degrees and supplied to BODC.
Further information is available in the cruise report
Project Information
Marine LTSS: CLASS (Climate Linked Atlantic Sector Science)
Introduction
CLASS is a five year (2018 to 2023) programme, funded by the Natural Environment Research Council (NERC) and extended until March 2024.
Scientific Rationale
The ocean plays a vital role in sustaining life on planet Earth, providing us with both living resources and climate regulation. The trajectory of anthropogenically driven climate change will be substantially controlled by the ocean due to its absorption of excess heat and carbon from the atmosphere, with consequent impacts on ocean resources that remain poorly understood. In an era of rapid planetary change, expanding global population and intense resource exploitation, it is vital that there are internationally coordinated ocean observing and prediction systems so policy makers can make sound evidence-based decisions about how to manage our interaction with the ocean. CLASS will underpin the UK contribution to these systems, documenting and understanding change in the marine environment, evaluating the impact of climate change and effectiveness of conservation measures and predicting the future evolution of marine environments. Over the five-year period CLASS will enhance the cost-effectiveness of observing systems by migrating them towards cutting edge autonomous technologies and developing new sensors. Finally, CLASS will create effective engagement activities ensuring academic partners have transparent access to NERC marine science capability through graduate training partnerships and access to shipborne, lab based and autonomous facilities, and modelling capabilities.
Data Activity or Cruise Information
Cruise
| Cruise Name | DY108 (DY109) |
| Departure Date | 2019-09-06 |
| Arrival Date | 2019-10-02 |
| Principal Scientist(s) | Blair Thornton (Southampton Marine and Maritime Institute), Veerle A Huvenne (National Oceanography Centre, Southampton) |
| Ship | RRS Discovery |
Complete Cruise Metadata Report is available here
Fixed Station Information
Fixed Station Information
| Station Name | Darwin Mounds Marine Protected Area, Special Area of Conservation |
| Category | Offshore area |
| Latitude | 59° 45.50' N |
| Longitude | 7° 13.00' W |
| Water depth below MSL | 1130.0 m |
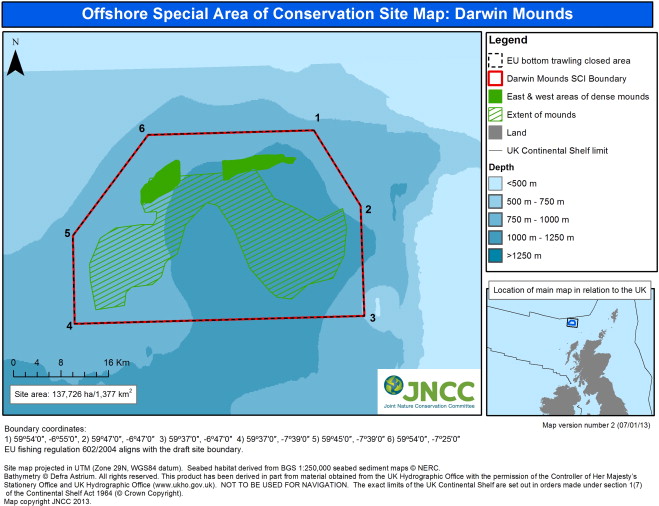
Fixed Station - Darwin Mounds Marine Protected Area (MPA) Special Area of Conservation (SAC)
The Darwin Mounds are located approximately 160 km north-west of Cape Wrath, Scotland, at the north end of the Rockall Trough. The site was designated a Marine Protected Area (MPA) in June 2002 and was formally assigned a Special Area of Conservation (SAC) from March 2018. The site area is approximately 1377 km2 and the water depth ranges from 710 - 1129 m. The site consists of a large number of coral-topped 'sand volcanoes' composed of sand overlying mud. The individual mounds are up to 75 m wide and 5 m high and are morphologically unique in UK waters. The mounds themselves are unusual geological features that are thought to have been formed by fluid expulsion from the seabed. The mounds are most elevated to the north of the site and diminish in height to the south. There are two denser regions of mounds in the north-east and north-west of the site. The north-east field of the Darwin Mounds measures approximately 13 km by 9 km and contains approximately 150 mounds, whereas the north-west field measures approximately 13 km by 4 km and contains approximately 75 mounds.
The mounds in the northern part of the site show an acoustic signature of a 'tail' which generally lies to the south-west of the mound feature consisting of elongate to oval patches up to 500 m long. The 'tail' feature of the mounds is thought to be unique globally. The tails are not topographically distinct from the surrounding seabed but are covered with a fine veneer of sand. They support substantial numbers of the xenophyophore Syringammina fragilissima (a single-celled organism that can grow up to 20 cm in diameter), in densities greater than the surrounding seabed.
On the majority of the mounds there are also multiple colonies of Lophelia pertusa growing, which in many cases have formed thickets which arise from the surface of the mound. This site was the first observed record of cold-water coral reefs growing on sand at the time of discovery. Like the topography of the mounds, the frequency of coral communities diminishes towards the south of the mound field. Although the reef habitat on top of the mounds is formed primarily from Lophelia pertusa, another cold-water coral Madrepora oculata is also present. The thickets of cold-water corals provide a habitat for echiuran worms, brittlestars, brisingiid starfish and sponges. Various fish have been observed among the mounds, but not at higher densities than the wider environment.
For further information see the JNCC website. Image available to download here.
Sampling History
| D248 (2000) | CD123 (2000) | JC060 (2011) | JC136 (2016) | DY108(109) (2019) | DY120 (2020) | |
|---|---|---|---|---|---|---|
| ROV video/photography | N | N | Y | Y | Y | N |
| AUV video/photography | N | N | Y | Y | Y | N |
| Bathysnap video/photography | Y | Y | N | N | N | N |
| WASP video/photography | N | Y | N | N | N | N |
| SHRIMP video/photography | Y | N | N | N | N | N |
| Shipboard Multibeam Bathymetry | N | N | Y | Y | Y | Y |
| AUV Multibeam Bathymetry | N | N | Y | Y | Y | N |
| AUV Sidescan Sonar | N | N | Y | N | Y | N |
| TOBI Sidescan Sonar | Y | N | N | N | N | N |
| CTD casts | Y | N | Y | Y | Y | Y |
| SAPS | Y | N | N | N | N | N |
| Megacorer | Y | Y | Y | N | Y | N |
| Box corer | Y | Y | Y | N | Y | N |
| Piston corer | Y | N | N | N | N | N |
| Gravity corer | N | Y | N | N | N | N |
| Moored ADCP | Y | N | N | Y | Y | Y |
| Moored sediment trap | N | N | N | N | Y | Y |
| Moored SBE37 MicroCAT | N | N | N | N | Y | Y |
Related Fixed Station activities are detailed in Appendix 1
BODC Quality Control Flags
The following single character qualifying flags may be associated with one or more individual parameters with a data cycle:
| Flag | Description |
|---|---|
| Blank | Unqualified |
| < | Below detection limit |
| > | In excess of quoted value |
| A | Taxonomic flag for affinis (aff.) |
| B | Beginning of CTD Down/Up Cast |
| C | Taxonomic flag for confer (cf.) |
| D | Thermometric depth |
| E | End of CTD Down/Up Cast |
| G | Non-taxonomic biological characteristic uncertainty |
| H | Extrapolated value |
| I | Taxonomic flag for single species (sp.) |
| K | Improbable value - unknown quality control source |
| L | Improbable value - originator's quality control |
| M | Improbable value - BODC quality control |
| N | Null value |
| O | Improbable value - user quality control |
| P | Trace/calm |
| Q | Indeterminate |
| R | Replacement value |
| S | Estimated value |
| T | Interpolated value |
| U | Uncalibrated |
| W | Control value |
| X | Excessive difference |
SeaDataNet Quality Control Flags
The following single character qualifying flags may be associated with one or more individual parameters with a data cycle:
| Flag | Description |
|---|---|
| 0 | no quality control |
| 1 | good value |
| 2 | probably good value |
| 3 | probably bad value |
| 4 | bad value |
| 5 | changed value |
| 6 | value below detection |
| 7 | value in excess |
| 8 | interpolated value |
| 9 | missing value |
| A | value phenomenon uncertain |
| B | nominal value |
| Q | value below limit of quantification |
Appendix 1: Darwin Mounds Marine Protected Area, Special Area of Conservation
Related series for this Fixed Station are presented in the table below. Further information can be found by following the appropriate links.
If you are interested in these series, please be aware we offer a multiple file download service. Should your credentials be insufficient for automatic download, the service also offers a referral to our Enquiries Officer who may be able to negotiate access.
| Series Identifier | Data Category | Start date/time | Start position | Cruise |
|---|---|---|---|---|
| 2201209 | Hydrography time series at depth | 2019-09-23 08:15:55 | 59.8637 N, 7.05 W | RRS Discovery DY108 (DY109) |
| 2201210 | Hydrography time series at depth | 2019-09-23 08:17:48 | 59.8637 N, 7.05 W | RRS Discovery DY108 (DY109) |
| 2228824 | Currents -subsurface Eulerian | 2020-10-23 09:39:00 | 59.8613 N, 7.04434 W | RRS Discovery DY120 |
| 2206748 | Hydrography time series at depth | 2020-10-23 11:00:01 | 59.8613 N, 7.04434 W | RRS Discovery DY120 |
| 2228836 | Currents -subsurface Eulerian | 2021-01-01 00:00:00 | 59.8613 N, 7.04434 W | RRS Discovery DY120 |
| 2228848 | Currents -subsurface Eulerian | 2022-01-01 00:00:00 | 59.8613 N, 7.04434 W | RRS Discovery DY120 |
