Metadata Report for BODC Series Reference Number 737929
Metadata Summary
Problem Reports
Data Access Policy
Narrative Documents
Project Information
Data Activity or Cruise Information
Fixed Station Information
BODC Quality Flags
SeaDataNet Quality Flags
Metadata Summary
Data Description |
|||||||||||||||||||||||||||||||||||||||||||||
|
|||||||||||||||||||||||||||||||||||||||||||||
Data Identifiers |
|||||||||||||||||||||||||||||||||||||||||||||
|
|||||||||||||||||||||||||||||||||||||||||||||
Time Co-ordinates(UT) |
|||||||||||||||||||||||||||||||||||||||||||||
|
|||||||||||||||||||||||||||||||||||||||||||||
Spatial Co-ordinates | |||||||||||||||||||||||||||||||||||||||||||||
|
|||||||||||||||||||||||||||||||||||||||||||||
Parameters |
|||||||||||||||||||||||||||||||||||||||||||||
|
|||||||||||||||||||||||||||||||||||||||||||||
|
|||||||||||||||||||||||||||||||||||||||||||||
Problem Reports
No Problem Report Found in the Database
CD173 CTD Data Quality Report
Temperature, salinity and sigma-theta
For downcasts of profiles CTD011, CTD013, CTD076 and CTD100, residual effects of the correction for winch veer can be seen in the salinity data. No flags were applied but the user should treat these data with caution.
Chlorophyll
Many casts have negative concentrations present, especially below the thermocline, which is likely to be due to bias in the calibration applied. All negative values have been flagged suspect.
The bias in the calibration is as a result of the chlorophyll calibration samples being sourced at depths < 100 m. No samples were taken in deeper water where chlorophyll concentrations are much lower. By limiting the calibration dataset to samples from shallow water, the calibration was forced to be biased in favour of higher concentrations (which are encountered near to the surface), causing the chlorophyll calibration to underestimate concentrations in deeper waters.
Beam transmission
Near-surface values were flagged as unrealistic in approximately 10% of the casts.
Oxygen concentration and saturation
Near-surface values were flagged as unrealistic in numerous casts.
Data Access Policy
Open Data
These data have no specific confidentiality restrictions for users. However, users must acknowledge data sources as it is not ethical to publish data without proper attribution. Any publication or other output resulting from usage of the data should include an acknowledgment.
If the Information Provider does not provide a specific attribution statement, or if you are using Information from several Information Providers and multiple attributions are not practical in your product or application, you may consider using the following:
"Contains public sector information licensed under the Open Government Licence v1.0."
Narrative Documents
Sea-Bird Dissolved Oxygen Sensor SBE 43 and SBE 43F
The SBE 43 is a dissolved oxygen sensor designed for marine applications. It incorporates a high-performance Clark polarographic membrane with a pump that continuously plumbs water through it, preventing algal growth and the development of anoxic conditions when the sensor is taking measurements.
Two configurations are available: SBE 43 produces a voltage output and can be incorporated with any Sea-Bird CTD that accepts input from a 0-5 volt auxiliary sensor, while the SBE 43F produces a frequency output and can be integrated with an SBE 52-MP (Moored Profiler CTD) or used for OEM applications. The specifications below are common to both.
Specifications
| Housing | Plastic or titanium |
| Membrane | 0.5 mil- fast response, typical for profile applications 1 mil- slower response, typical for moored applications |
| Depth rating | 600 m (plastic) or 7000 m (titanium) 10500 m titanium housing available on request |
| Measurement range | 120% of surface saturation |
| Initial accuracy | 2% of saturation |
| Typical stability | 0.5% per 1000 h |
Further details can be found in the manufacturer's specification sheet.
Instrument Description
CTD Unit and Auxiliary Sensors
The CTD configuration comprised a stainless steel Sea-Bird Electronics 9plus system (s/n #09P-37898-0782), with accompanying Sea-Bird Electronics 11plus V2 Deck Unit (s/n #11P-24680-0587). The CTD was fitted with a Chelsea Alphatracka MKII transmissometer, a Chelsea Aquatracka MKIII fluorometer, a Sequoia Scientific Laser In-Situ Scattering and Transmissometry (LISST) particle analyser, a National Marine Facilities (NMF) SUV6 in-situ nitrate spectrophotometer, a Chelsea Instruments Fasttracka Fast Repetition Rate Fluorometer (FRRF) and an RD Instruments Workhorse Mariner Lowered Acoustic Doppler Current Profiler (LADCP). All instruments were attached to a Sea-Bird SBE 32 full size carousel (s/n #32-37898-0518) containing 24 x 20-litre stainless steel rosette bottles. The table below lists more detailed information about the various sensors.
The FRRF, LISST and Workhorse Mariner LADCP were self-logging instruments. All other instruments logged to the Sea-Bird 911plus deck unit.
| Sensor Unit | Model | Serial Number | Full Specification | Calibration (YYYY-MM-DD) | Next Calibration (YYYY-MM-DD) | Comments |
|---|---|---|---|---|---|---|
| CTD Underwater Unit | SBE 9+ | 09P-37898-0782 | Sea-Bird 911plus | - | - | - |
| Pressure transducer | Digiquartz 410K-105 | 94756 (0782) | 410K-105 | 2004-12-30 | 2008-01-05 | - |
| Conductivity sensor | SBE 4 | 04C-2164 | SBE 04C | 2005-04-29 | 2005-10-29 | Primary |
| Conductivity sensor | SBE 4 | 04C-2165 | SBE 04C | 2005-04-29 | 2005-10-29 | Secondary |
| Temperature sensor | SBE 3+ | 03P-4105 | SBE 03+ | 2005-02-22 | 2005-08-22 | Primary |
| Temperature sensor | SBE 3+ | 03P-4151 | SBE 03+ | 2005-02-22 | 2005-08-22 | Secondary |
| Dissolved oxygen | SBE 43 | 43-0363 | SBE 43 | 2005-02-21 | 2007-02-21 | - |
| Chlorophyll fluorometer | Chelsea Instruments Aquatracka MK III | 88/2050/095 | Aquatracka MK III | Not supplied | Not supplied | Emplaced on cast 2, replaced LI-COR PAR* sensor |
| Transmissometer | Chelsea Instruments Alphatracka MK II | 04-4223-001 | Alphatracka MK II | Not supplied | Not supplied | 0.25 m path |
| FRRF | Chelsea Instruments Fasttracka | 182043 | Fasttracka | 2004-10-19 | Not supplied | Includes pressure and PAR logging. Removed for casts > 200 m depth |
| LI-COR | LI 192SA | 33 | LI 192 | Not supplied | Not supplied | Attached to CTD for cast 1 only |
| LADCP | RD Instruments 300 kHz Workhorse Mariner | 5414 (downward master) 1855 (upward slave) | Workhorse Monitor | - | - | - |
| Optical nitrate sensor | NMF SUV6 | - | SUV6 | Not supplied | Not supplied | Removed for casts > 200 m depth |
| LISST | not known | not known | not known | not known | not known | Deployed on CTD frame for University of Wales, Bangor (UWB) |
* PAR = Photosynthetically Active Radiation
Sensor Change
The LI-COR PAR sensor was only present for cast CTD001. It was removed to fit the Chelsea Instruments Aquatracka MK III fluorometer. The FRRF was deployed with its associated PAR sensor, so light data are available from the FRRF dataset. The Chelsea Instruments Aquatracka MK III fluorometer was not present for cast CTD001 as it was on a non-standard channel at the start of the cruise which was thence used for the NMF SUV6.
Sea-Bird Electronics SBE 911 and SBE 917 series CTD profilers
The SBE 911 and SBE 917 series of conductivity-temperature-depth (CTD) units are used to collect hydrographic profiles, including temperature, conductivity and pressure as standard. Each profiler consists of an underwater unit and deck unit or SEARAM. Auxiliary sensors, such as fluorometers, dissolved oxygen sensors and transmissometers, and carousel water samplers are commonly added to the underwater unit.
Underwater unit
The CTD underwater unit (SBE 9 or SBE 9 plus) comprises a protective cage (usually with a carousel water sampler), including a main pressure housing containing power supplies, acquisition electronics, telemetry circuitry, and a suite of modular sensors. The original SBE 9 incorporated Sea-Bird's standard modular SBE 3 temperature sensor and SBE 4 conductivity sensor, and a Paroscientific Digiquartz pressure sensor. The conductivity cell was connected to a pump-fed plastic tubing circuit that could include auxiliary sensors. Each SBE 9 unit was custom built to individual specification. The SBE 9 was replaced in 1997 by an off-the-shelf version, termed the SBE 9 plus, that incorporated the SBE 3 plus (or SBE 3P) temperature sensor, SBE 4C conductivity sensor and a Paroscientific Digiquartz pressure sensor. Sensors could be connected to a pump-fed plastic tubing circuit or stand-alone.
Temperature, conductivity and pressure sensors
The conductivity, temperature, and pressure sensors supplied with Sea-Bird CTD systems have outputs in the form of variable frequencies, which are measured using high-speed parallel counters. The resulting count totals are converted to numeric representations of the original frequencies, which bear a direct relationship to temperature, conductivity or pressure. Sampling frequencies for these sensors are typically set at 24 Hz.
The temperature sensing element is a glass-coated thermistor bead, pressure-protected inside a stainless steel tube, while the conductivity sensing element is a cylindrical, flow-through, borosilicate glass cell with three internal platinum electrodes. Thermistor resistance or conductivity cell resistance, respectively, is the controlling element in an optimized Wien Bridge oscillator circuit, which produces a frequency output that can be converted to a temperature or conductivity reading. These sensors are available with depth ratings of 6800 m (aluminium housing) or 10500 m (titanium housing). The Paroscientific Digiquartz pressure sensor comprises a quartz crystal resonator that responds to pressure-induced stress, and temperature is measured for thermal compensation of the calculated pressure.
Additional sensors
Optional sensors for dissolved oxygen, pH, light transmission, fluorescence and others do not require the very high levels of resolution needed in the primary CTD channels, nor do these sensors generally offer variable frequency outputs. Accordingly, signals from the auxiliary sensors are acquired using a conventional voltage-input multiplexed A/D converter (optional). Some Sea-Bird CTDs use a strain gauge pressure sensor (Senso-Metrics) in which case their pressure output data is in the same form as that from the auxiliary sensors as described above.
Deck unit or SEARAM
Each underwater unit is connected to a power supply and data logging system: the SBE 11 (or SBE 11 plus) deck unit allows real-time interfacing between the deck and the underwater unit via a conductive wire, while the submersible SBE 17 (or SBE 17 plus) SEARAM plugs directly into the underwater unit and data are downloaded on recovery of the CTD. The combination of SBE 9 and SBE 17 or SBE 11 are termed SBE 917 or SBE 911, respectively, while the combinations of SBE 9 plus and SBE 17 plus or SBE 11 plus are termed SBE 917 plus or SBE 911 plus.
Specifications
Specifications for the SBE 9 plus underwater unit are listed below:
| Parameter | Range | Initial accuracy | Resolution at 24 Hz | Response time |
|---|---|---|---|---|
| Temperature | -5 to 35°C | 0.001°C | 0.0002°C | 0.065 sec |
| Conductivity | 0 to 7 S m-1 | 0.0003 S m-1 | 0.00004 S m-1 | 0.065 sec (pumped) |
| Pressure | 0 to full scale (1400, 2000, 4200, 6800 or 10500 m) | 0.015% of full scale | 0.001% of full scale | 0.015 sec |
Further details can be found in the manufacturer's specification sheet.
Chelsea Technologies Group Aquatracka MKIII fluorometer
The Chelsea Technologies Group Aquatracka MKIII is a logarithmic response fluorometer. Filters are available to enable the instrument to measure chlorophyll, rhodamine, fluorescein and turbidity.
It uses a pulsed (5.5 Hz) xenon light source discharging along two signal paths to eliminate variations in the flashlamp intensity. The reference path measures the intensity of the light source whilst the signal path measures the intensity of the light emitted from the specimen under test. The reference signal and the emitted light signals are then applied to a ratiometric circuit. In this circuit, the ratio of returned signal to reference signal is computed and scaled logarithmically to achieve a wide dynamic range. The logarithmic conversion accuracy is maintained at better than one percent of the reading over the full output range of the instrument.
Two variants of the instrument are available, both manufactured in titanium, capable of operating in depths from shallow water down to 2000 m and 6000 m respectively. The optical characteristics of the instrument in its different detection modes are visible below:
| Excitation | Chlorophyll a | Rhodamine | Fluorescein | Turbidity |
|---|---|---|---|---|
| Wavelength (nm) | 430 | 500 | 485 | 440* |
| Bandwidth (nm) | 105 | 70 | 22 | 80* |
| Emission | Chlorophyll a | Rhodamine | Fluorescein | Turbidity |
| Wavelength (nm) | 685 | 590 | 530 | 440* |
| Bandwidth (nm) | 30 | 45 | 30 | 80* |
* The wavelengths for the turbidity filters are customer selectable but must be in the range 400 to 700 nm. The same wavelength is used in the excitation path and the emission path.
The instrument measures chlorophyll a, rhodamine and fluorescein with a concentration range of 0.01 µg l-1 to 100 µg l-1. The concentration range for turbidity is 0.01 to 100 FTU (other wavelengths are available on request).
The instrument accuracy is ± 0.02 µg l-1 (or ± 3% of the reading, whichever is greater) for chlorophyll a, rhodamine and fluorescein. The accuracy for turbidity, over a 0 - 10 FTU range, is ± 0.02 FTU (or ± 3% of the reading, whichever is greater).
Further details are available from the Aquatracka MKIII specification sheet.
Chelsea Technologies Group ALPHAtracka and ALPHAtracka II transmissometers
The Chelsea Technologies Group ALPHAtracka (the Mark I) and its successor, the ALPHAtracka II (the Mark II), are both accurate (< 0.3 % fullscale) transmissometers that measure the beam attenuation coefficient at 660 nm. Green (565 nm), yellow (590 nm) and blue (470 nm) wavelength variants are available on special order.
The instrument consists of a Transmitter/Reference Assembly and a Detector Assembly aligned and spaced apart by an open support frame. The housing and frame are both manufactured in titanium and are pressure rated to 6000 m depth.
The Transmitter/Reference housing is sealed by an end cap. Inside the housing an LED light source emits a collimated beam through a sealed window. The Detector housing is also sealed by an end cap. A signal photodiode is placed behind a sealed window to receive the collimated beam from the Transmitter.
The primary difference between the ALPHAtracka and ALPHAtracka II is that the Alphatracka II is implemented with surface-mount technology; this has enabled a much smaller diameter pressure housing to be used while retaining exactly the same optical train as in the Mark I. Data from the Mark II version are thus fully compatible with that already obtained with the Mark I. The performance of the Mark II is further enhanced by two electronic developments from Chelsea Technologies Group - firstly, all items are locked in a signal nulling loop of near infinite gain and, secondly, the signal output linearity is inherently defined by digital circuitry only.
Among other advantages noted above, these features ensure that the optical intensity of the Mark II, indicated by the output voltage, is accurately represented by a straight line interpolation between a reading near full-scale under known conditions and a zero reading when blanked off.
For optimum measurements in a wide range of environmental conditions, the Mark I and Mark II are available in 5 cm, 10 cm and 25 cm path length versions. Output is default factory set to 2.5 volts but can be adjusted to 5 volts on request.
Further details about the Mark II instrument are available from the Chelsea Technologies Group ALPHAtrackaII specification sheet.
Originator's Data Processing: CTD data from CD173
Sampling Strategy
A total of 133 CTD casts were attempted during the cruise in the Celtic Sea and across the North-west European shelf edge. 128 casts were completed with valid data collected on both the downcast and upcast. No data of scientific value were collected on cast 1 as this was the CTD shakedown cast, carried out to check instrument systems were all functioning. Casts 105, 106, 107 and the downcast of 108 were unsuccessful due to problems with the CTD hydrographic wire, which led to the wire needing to be repaired between cast 108 and cast 109. The upcast of cast 108 did however collect valid data. In total therefore, valid downcast or upcast profiles were recorded during 129 casts.
These casts were carried out as; transects across the shelf edge and along Jones Bank; single site casts; and repeated sampling over half and full tidal cycles at stations CS2, Bank 2, JB3 and OB (with the exception of station U2 which was repeatedly visited for single casts on 3 separate occasions). The table below shows the locations of the repeat visit stations, plus the dates they were visited.
| Site | Latitude | Longitude | Mean water depth (m) | Visit dates YYYY-MM-DD (UT) |
|---|---|---|---|---|
| CS2 | 48.552° N | 9.486° W | 201 | 2005-07-17 to 2005-07-18 (25 hour tidal cycle station) 2005-07-23 to 2005-07-24 (25 hour tidal cycle station) |
| Bank 2 | 49.8916° N | 7.8826° W | 114 | 2005-07-20 - 1 CTD profile 2005-07-26 to 2005-07-27 (25 hour tidal cycle station) 2005-07-31 to 2005-08-01 (25 hour tidal cycle station) |
| JB3 | 49.9327° N | 7.835° W | 118 | 2005-07-28 (13 hour tidal cycle station) |
| OB | 49.7493° N | 7.6663° W | 110 | 2005-08-01 to 2005-08-02 (25 hour tidal cycle station) |
| U2 | 49.223° N | 6.167° W | 120 | 2005-07-15 - 1 CTD profile 2005-07-19 - 1 CTD profile 2005-08-03 - 2 CTD profiles |
Rosette bottles were fired throughout each profile. From cast 58 onwards, water samples were taken from the rosette bottles in order to obtain independent salinity samples. Water samples were taken from the CTD rosette bottles during 16 casts for analysis of levels of Dissolved Organic Carbon (DOC), Total Dissolved Nitrogen (TDN), Total Dissolved Phosphorous (TDP) and amino acids by staff at National Oceanography Centre, Southampton (NOCS).
Dissolved oxygen water samples were taken from the CTD rosette bottles fired at 5 depths between 120 m and 2 m at casts 14, 20, 35, 40, 47, 53, 72, 74, 76, 80, 81, 84, 91, 96, 110, 120, 123, 128 and 133. These samples were analysed at NOCS.
After all CTD casts, between four to ten water samples were collected from rosette bottles fired at a range of depths throughout the water column. These samples were analysed at NOCS to provide chlorophyll-a concentrations.
Water samples were taken from mid-depth bottles fired during casts 11, 47, 85, 120 and 128 and from surface bottles during cast 28 to provide information on phytoplankton 15N and13C uptake rates. The analysis was performed by NOCS.
Water samples were taken from rosette bottles fired at the surface, mid-to-low surface mixed layer, upper thermocline and subsurface fluorescence maximum during pre-dawn CTD casts (numbers 6, 11, 16, 19, 28, 47, 72, 81, 84, 120, 128 and 133). These samples were analysed by NOCS for primary productivity and for cross-comparison with the deployed Chelsea Instruments Fastracka.
Nutrient data were collected throughout the water column during all CTD casts and analysed at NOCS.
Data Processing
The CTD data recorded during cruise CD173 were processed by UKORS (after September 2005, this became the National Marine Facilities [NMF], part of NOCS) using Sea-Bird Seasave software v. 5.32. Output parameters were generated using the DATCNV module as follows:
(i) Time, Elapsed [seconds]
(ii) Depth [salt water, m]
(iii) Pressure [db]
(iv) Primary Temperature [ITS-90, deg C]
(v) Primary Conductivity [mS/cm]
(vi) Primary Salinity [PSU]
(vii) Secondary Temperature [ITS-90, deg C]
(viii) Secondary Conductivity [mS/cm]
(ix) Secondary Salinity [PSU]
(x) Fluorescence Chlorophyll Concentration [ug/l]
(xi) Oxygen concentration [umol/Kg]
(xii) Beam Transmission [%]
No further processing with Sea-Bird software was carried out on the data.
The cruise PSO inspected the data prior to performing their own in-house processing. During this inspection, a major problem with the temperature and salinity data was identified . The problem showed up as a consistent apparent spiking in temperature and salinity as the CTD passed through the pycnocline, in a way not normally expected from a CTD. The problem was, after discussion with ship personnel, identified as most likely being due to lack of efficient flushing of the CTD rosette during profiling. The solution to this problem chosen by the PSO was to identify the low points of each spike, based on the 10 lowest secondary temperature sensor readings within each 0.5 m depth interval. The secondary sensor was chosen as it was located towards the edge of the instrument package and would therefore be less affected by the instrument flushing problem. All other data were taken from the scans that had the lowest 10 temperatures - this meant that the supplied salinity was based on temperature and conductivity from the secondary sensors. The time channel, pressure, primary temperature, primary conductivity and primary salinity were excluded from the dataset supplied to BODC. Once the valid data were identified, they were bin averaged over 1 m intervals. A full description of the flushing problem can be seen on pages 17 - 18 of the CD 173 Cruise Report.
Field Calibrations
The CTD data for cruise CD173 received by BODC have had the following calibrations applied to them, either by UKORS / NMF or by the cruise PSO.
Temperature
The temperature sensors on the SeaBird S9+ CTD underwater unit (s/n #03P-4105 and s/n #03P-4151) were not calibrated against an independent temperature source. UKORS / NMF regularly performed re-calibrations of the sensors, with the last calibration for both #03P-4105 and #03P-4151 prior to cruise CD173 being February 2005, only 5 months beforehand. It was therefore not deemed necessary by the PSO to perform any further calibration of the temperature sensors.
Salinity
28 independent salinity samples obtained from the CTD rosette bottles from 25 July 2005 to 06 August 2005 were compared to the un-calibrated CTD salinity values. Two samples (casts 66 and 114, both at 34 m) were excluded as outliers. The offset between the salinity bottle samples and raw CTD salinity was examined and led to a calibration equation based on 26 observations as follows: calibrated CTD salinity = raw CTD salinity - 0.007, accurate to +/- 0.003 (PSS78). Further information on the salinity calibration is available on pages 18 and 19 of the CD 173 Cruise Report.
Chlorophyll
The raw CTD chlorophyll data were compared to the chlorophyll data collected from the bottle samples and analysed by NOCS. The outcome of the comparison was that two separate calibrations were required, one for the shelf edge water and one for the Celtic Sea shelf water. The two calibration equations are:
At the shelf edge:
Chlorophyll-a = 1.4 * CTD chlorophyll - 0.1 µg l-1
RMS error = ± 0.2 µg l-1
On the shelf:
Chlorophyll-a = 1.8 * CTD chlorophyll + 0.0 µg l-1
RMS error = ± 0.1 µg l-1
The above calibrations are not applicable to cast 2 as it contained an incorrect calibration file. Further details on the chlorophyll calibration can be seen on pages 19, 20 and 59 - 63 of theCD 173 Cruise Report.
Dissolved Oxygen
The dissolved oxygen concentrations recorded by the CTD were in units of µmol kg-1. These were converted by the PSO to values of µmol l-1 by multiplication by a general density factor (1025/1000). These converted values were compared to dissolved oxygen concentrations in µmol l-1 from water samples using the Winkler titration method, analysed by NOCS. A significant relationship between the two values was found at 95% confidence. The equation was manipulated by the PSO to display units of µmol kg-1 by multiplying the offset by (1000/1025), allowing a calibration to be derived as follows: calibrated dissolved oxygen = 1 * CTD dissolved oxygen + 9.0 µmol kg-1. The RMS error in the calibration is +/- 4.0 µmol kg-1. Full details on the dissolved oxygen calibration procedure are visible in pages 74 - 76 of the CD 173 Cruise Report.
Processing undertaken by BODC: CTD data from CD173
The data arrived at BODC in 264 ASCII format .dat files representing the down and up-casts for all but one of the CTD casts carried out during the cruise. No data were supplied for cast 1 as this was the CTD shakedown cast, carried out to check instrument systems were all functioning. No data of scientific value were collected on the cast.
The downcast data for 128 of the 132 supplied casts were re-formatted to the BODC internal QXF format using transfer function 401. For cast 108, the up-cast data, not the down-cast data, were re-formatted as the down-cast did not start until 66 m depth. Casts 105, 106 and 107 have not been re-formatted as the data in these files were compromised by a problem with the hydrographic wire controlling the CTD.
The table below shows how the variables in the .dat files were mapped to the appropriate BODC parameter codes. The table also provides detail on any data manipulation carried out by BODC, any derivation of variables and the reasons for any exclusion of data supplied by the Originator.
| Originator's Parameter Identifier | Units of Originator's Parameter | Description | BODC Parameter Code | Units of BODC Parameter | Comments (including any conversions/derivations done) |
|---|---|---|---|---|---|
| depth | m | Depth of CTD in metres | DEPHPR01 | m | Multiplied originator values by -1 as they were supplied as negatives. |
| temp01 | ° C | Temperature of water column | TEMPST01 | ° C | Calibrated by UKORS / NMF prior to cruise. |
| sal01 | PSU | PSS78 water column salinity | PSALCC01 | dimensionless | Calibrated by PSO against independent salinity analysed by Guildline Autosal salinometer. |
| sigt01 | kg m-3 | Sigma-t | Not applicable | Not applicable | Not loaded as sigma-theta derived by BODC |
| chl | mg m-3 | Fluorescence chlorophyll | CPHLPL01 | mg m-3 | 1 mg m-3 = 1 µg l-1 (CTD measurement units). Calibrated against in-situ chlorophyll samples obtained through fluorescence analysis. |
| dox | µmol kg-1 | Dissolved oxygen concentration | DOXYSC01 | µmol l-1 | Converted from µmol kg-1 to µmol l-1 by dividing by TOKGPR01 factor. Calibrated against titration samples analysed using Winkler method. |
| dox% | % | Oxygen saturation | - | - | Not loaded as oxygen saturation derived by BODC |
| trans | % | Light transmittance | POPTDR01 | % | - |
| - | - | - | SIGTPR01 | kg m-3 | Derived by BODC. Sigma-theta calculated using Fofonoff and Millard (1983). Derivation includes latitude dependent depth to pressure conversion. |
| - | - | - | OXYSSC01 | % | Derived by BODC using Benson and Krause (1984) |
| - | - | - | TOKGPR01 | l kg-1 | Derived by BODC. Conversion factor (volume to mass) for water column from computation of sigma-theta reciprocal. |
The reformatted data were visualised using the in-house EDSERPLO software. Suspect data were marked by adding any appropriate quality control flag, absent data were assigned the absent data value and flagged accordingly.
References
Benson, BB. and Krause, DK. Jr., 1984. The concentration and isotopic fractionation of oxygen dissolved in freshwater and seawater in equilibrium with the atmosphere. Limnol. Oceanogr., 29(3), 620-632
Fofonoff, NP. and Millard, RC. Jr., 1983. Algorithms for computations of fundamental properties of seawater. UNESCO Technical Papers in Marine Science No 44, 53pp.
General Data Screening carried out by BODC
BODC screen both the series header qualifying information and the parameter values in the data cycles themselves.
Header information is inspected for:
- Irregularities such as unfeasible values
- Inconsistencies between related information, for example:
- Times for instrument deployment and for start/end of data series
- Length of record and the number of data cycles/cycle interval
- Parameters expected and the parameters actually present in the data cycles
- Originator's comments on meter/mooring performance and data quality
Documents are written by BODC highlighting irregularities which cannot be resolved.
Data cycles are inspected using time or depth series plots of all parameters. Currents are additionally inspected using vector scatter plots and time series plots of North and East velocity components. These presentations undergo intrinsic and extrinsic screening to detect infeasible values within the data cycles themselves and inconsistencies as seen when comparing characteristics of adjacent data sets displaced with respect to depth, position or time. Values suspected of being of non-oceanographic origin may be tagged with the BODC flag denoting suspect value; the data values will not be altered.
The following types of irregularity, each relying on visual detection in the plot, are amongst those which may be flagged as suspect:
- Spurious data at the start or end of the record.
- Obvious spikes occurring in periods free from meteorological disturbance.
- A sequence of constant values in consecutive data cycles.
If a large percentage of the data is affected by irregularities then a Problem Report will be written rather than flagging the individual suspect values. Problem Reports are also used to highlight irregularities seen in the graphical data presentations.
Inconsistencies between the characteristics of the data set and those of its neighbours are sought and, where necessary, documented. This covers inconsistencies such as the following:
- Maximum and minimum values of parameters (spikes excluded).
- The occurrence of meteorological events.
This intrinsic and extrinsic screening of the parameter values seeks to confirm the qualifying information and the source laboratory's comments on the series. In screening and collating information, every care is taken to ensure that errors of BODC making are not introduced.
Project Information
Physical-Biological Control of New Production within the Seasonal Thermocline
This project was a NERC responsive-mode project which was co-funded by the Defence Science and Technology Laboratory and ran from 2003 to 2006. The key institutes and scientists involved were:
| Institute | Scientific personnel |
|---|---|
| Proudman Oceanographic Laboratory (POL) | Jonathan Sharples |
| National Oceanography Centre, Southampton (NOCS) | Patrick Holligan Mark Moore |
| University of Wales, Bangor (UWB) | John Simpson Tom Rippeth |
Research Aim
The main aim of this research was to investigate the generation and dissipation of turbulence in the thermocline, and to quantify how the resulting mixing (supplying nutrients and controlling the light experienced by the algae) affected the growth of phytoplankton within the sub-surface chlorophyll maximum (SCM).
Research Objectives
The objective of the research was to test the general hypothesis that, in seasonally-stratified shelf waters, temporal and spatial variability of the rate of 'new' production is determined by the degree of coupling between physical and biological processes within the seasonal thermocline. In particular it has been suggested that physiological adaptation by phytoplankton making up the subsurface chlorophyll maximum drives a biological pump for extracting nitrate from the bottom mixed layer that is sensitive to internal mixing and to external climatological factors.
Research Approach
The sampling and experimental strategy was based on established methods for obtaining compatible, high-resolution vertical profiles (alternate CTD and FLY) and sections (SeaSoar) of physical, chemical, and biological parameters, allowing quantification of vertical fluxes and primary production on tidal and internal wave time scales. The cruise schedule (with associated mooring deployments) for the project is below.
Cruise Schedule
| Cruise ID | Ship | Sampling Region | Cruise Dates | Main measurements |
|---|---|---|---|---|
| JR98 | RRS James Clark Ross | St Georges Channel, Celtic Sea and shelf edge | 25/07/03 - 14/08/03 | CTD casts, SeaSoar transects (CTD, chlorophyll, fluorescence), FRRF, ship ADCP, primary productivity, nutrients, trace metals, phytoplankton uptake rates, algal photophysiology, oxygen concentration, particle size, optics, mooring deployments |
| PD32_03 | RV Prince Madog | Celtic Sea and shelf edge | 27/07/03 - 13/08/03 | 5 x FLY 25 hour tidal cycle stations, particle size analysis, particle settling velocity, CTD casts, mooring deployments |
| CD173 | RRS Charles Darwin | Celtic Sea and shelf edge | 15/07/05 - 06/08/05 | CTD casts, chlorophyll, oxygen concentration, FLY profiles, SeaSoar tows (CTD, chlorophyll, FRRF), phytoplankton pigments, nutrients, primary productivity, phytoplankton uptake rates, FRRF profiles, optics, particle size analysis, mooring deployments |
| PD27_05 | RV Prince Madog | Celtic Sea and shelf edge | 22/07/05 - 06/08/05 | FLY profiles, mooring deployments |
Moorings
| Station ID | Latitude | Longitude | Depth (m) | Mooring | Deployment date | Recovery date | Deployment vessel |
|---|---|---|---|---|---|---|---|
| CS3 | 51.471 | -6.428 | 95 | Seabed frame 300 kHz ADCP | 01/08/03 | 11/08/03 | RV Prince Madog |
| CS3 | 51.471 | -6.428 | 95 | Seabed frame 1200 kHz ADCP | 01/08/03 | 11/08/03 | RV Prince Madog |
| CS3 | 51.474 | -6.437 | 95 | Mid-water subsurface 300 kHz ADCP | 01/08/03 | 11/08/03 | RV Prince Madog |
| CS3 | 51.469 | -6.437 | 95 | Thermistor chain from 5 - 45 m depth | 01/08/03 | 11/08/03 | RV Prince Madog |
| ACW | 51.266 | -5.741 | 85 | Seabed frame 300 kHz ADCP | 06/08/03 | 08/08/03 | RV Prince Madog |
| CS2 | 48.532 | -9.463 | 200 | Surface temperature toroid | 28/07/03 | 12/08/03 | RRS James Clark Ross |
| CS2 | 48.532 | -9.463 | 200 | Thermistor chain throughout water column | 28/07/03 | 12/08/03 | RRS James Clark Ross |
| CS2 | 48.532 | -9.463 | 200 | Sub-suface 600 kHz ADCP (90 m) | 28/07/03 | 12/08/03 | RRS James Clark Ross |
| CS2 | 48.532 | -9.463 | 200 | Aanderaa RCM7 current meter/CTD (12 mab)* | 28/07/03 | 12/08/03 | RRS James Clark Ross |
| CS2 | 48.532 | -9.463 | 200 | Seabed frame 150 kHz ADCP | 28/07/03 | 12/08/03 | RRS James Clark Ross |
| CS2 | 48.532 | -9.463 | 200 | Seabed frame 300 kHz ADCP | 28/07/03 | 12/08/03 | RRS James Clark Ross |
| U2 | 49.236 | -6.166 | 121 | Sub-suface 300 kHz ADCP (5 mab)* | 15/07/05 | 03/08/05 | RRS Charles Darwin |
| U2 | 49.233 | -6.167 | 120 | Thermistor chain throughout water column | 19/07/05 | Mooring lost | RRS Charles Darwin |
| CS2 | 48.571 | -9.509 | 200 | Thermistor chain throughout water column | 17/07/05 | 24/07/05 | RRS Charles Darwin |
| CS2 | 48.573 | -9.51 | 194 | Sub-suface 300 kHz ADCP (100 m) | 17/07/05 | 24/07/05 | RRS Charles Darwin |
| CS2 | 48.572 | -9.508 | 196 | Seabed frame 300 kHz ADCP | 17/07/05 | 24/07/05 | RRS Charles Darwin |
| CS2 | 48.571 | -9.507 | 202 | Seabed frame 150 kHz ADCP | 17/07/05 | 24/07/05 | RRS Charles Darwin |
| Bank 1 | 49.938 | -7.792 | 118 | Thermistor chain throughout water column | 26/07/05 | Mooring lost | RRS Charles Darwin |
| Bank 1 | 49.936 | -7.792 | 118 | Seabed frame 300 kHz ADCP | 27/07/05 | Recovered by trawler 29/07/05 | RRS Charles Darwin |
| Bank 2 | 49.895 | -7.872 | 114 | Thermistor chain throughout water column | 20/07/05 | 04/08/05 | RRS Charles Darwin |
| Bank 2 | 49.876 | -7.897 | 112 | Sub-surface 600 kHz ADCP (56 m) | 26/07/05 | 04/08/05 | RRS Charles Darwin |
| Bank 2 | 49.894 | -7.873 | 110 | Seabed frame 300 kHz ADCP | 26/07/05 | 04/08/05 | RRS Charles Darwin |
| Bank 3 | 49.851 | -7.952 | 78 | Thermistor chain throughout water column | 26/07/05 | 03/08/05 | RV Prince Madog |
| Bank 3 | 49.854 | -7.948 | 78 | Seabed frame 300 kHz ADCP | 26/07/05 | Mooring lost | RV Prince Madog |
* = metres above seabed
Project Outcomes
The main products of the research were:
- The first large scale interdisciplinary study of the dynamic processes that determine the properties of the SCM in NW European shelf waters.
- Substantive advances in quantifying internal mixing in NW European shelf seas, and in understanding how primary production is controlled by this small-scale turbulence.
- New parameterisations for internal vertical mixing, and the response of primary production, for use in coupled numerical models.
- Improved capability for estimating primary productivity in stratified waters by satellite remote sensing (ocean colour, sea surface temperature, wind mixing etc.)
- An overall development of our understanding of the dynamics of ecosystems that support important fisheries, and of our abilities in predicting ecological and biogeochemical responses to variations and changes in the climate of the marine environment.
Data Activity or Cruise Information
Cruise
| Cruise Name | CD173 |
| Departure Date | 2005-07-15 |
| Arrival Date | 2005-08-06 |
| Principal Scientist(s) | Jonathan Sharples (Proudman Oceanographic Laboratory) |
| Ship | RRS Charles Darwin |
Complete Cruise Metadata Report is available here
Fixed Station Information
Fixed Station Information
| Station Name | Bank2 |
| Category | Offshore area |
| Latitude | 49° 53.50' N |
| Longitude | 7° 52.96' W |
| Water depth below MSL | 114.0 m |
Physical-Biological Control of New Production within the Seasonal Thermocline: Fixed Station Bank2
This station is positioned in the centre of Jones Bank (see figure below), 100 km west of the Scilly Isles in the Celtic Sea on the north-west European shelf edge. It was first visited by the RRS Charles Darwin (CD173) in 2005.
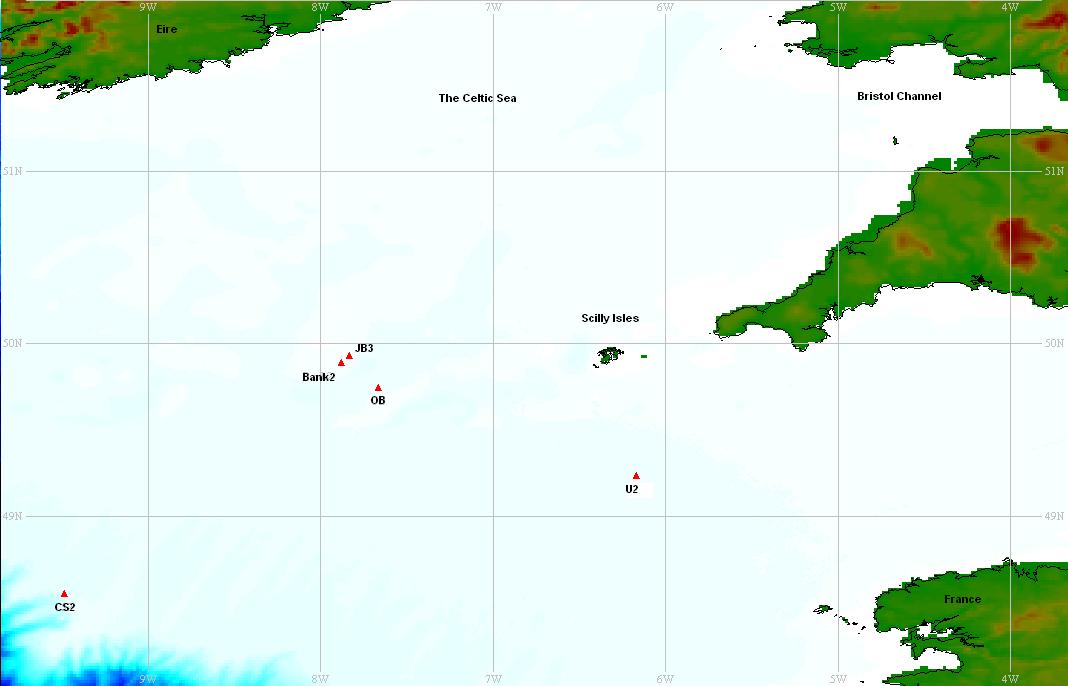
All activities that have occurred here lie within a box bounded by co-ordinates 49.9075° N, 7.8989° W at the northwest corner and 49.8757° N, 7.8662° W at the southeast corner. The mean depth within the box is 106 m.
The deployment and sampling history, to date, for this station is summarised below:
Key
ADCP = Acoustic Doppler Current Profiler
CTD = Conductivity, temperature, depth sensor
Moorings
| Latitude | Longitude | Depth (m) | Mooring (instrument depth) | Deployment date | Recovery date | Deployment vessel |
|---|---|---|---|---|---|---|
| 49.895° N | 7.872° W | 114 | Thermistor chain throughout water column | 20/07/05 | 04/08/05 | RRS Charles Darwin (CD173) |
| 49.876° N | 7.897° W | 112 | Sub-suface 600 kHz ADCP (56 m) | 26/07/05 | 04/08/05 | RRS Charles Darwin (CD173) |
| 49.894° N | 7.873° W | 110 | Seabed frame 300 kHz ADCP | 26/07/05 | 04/08/05 | RRS Charles Darwin (CD173) |
CTD Casts
| Latitude | Longitude | Depth (m) | Visit dates |
|---|---|---|---|
| 49.8916° N | 7.8826° W | 114 | 20/07/05 - 1 CTD profile 26 - 27/07/05 (25 hour tidal cycle station) 31/07/05 - 01/08/05 (25 hour tidal cycle station) |
Related Fixed Station activities are detailed in Appendix 1
BODC Quality Control Flags
The following single character qualifying flags may be associated with one or more individual parameters with a data cycle:
| Flag | Description |
|---|---|
| Blank | Unqualified |
| < | Below detection limit |
| > | In excess of quoted value |
| A | Taxonomic flag for affinis (aff.) |
| B | Beginning of CTD Down/Up Cast |
| C | Taxonomic flag for confer (cf.) |
| D | Thermometric depth |
| E | End of CTD Down/Up Cast |
| G | Non-taxonomic biological characteristic uncertainty |
| H | Extrapolated value |
| I | Taxonomic flag for single species (sp.) |
| K | Improbable value - unknown quality control source |
| L | Improbable value - originator's quality control |
| M | Improbable value - BODC quality control |
| N | Null value |
| O | Improbable value - user quality control |
| P | Trace/calm |
| Q | Indeterminate |
| R | Replacement value |
| S | Estimated value |
| T | Interpolated value |
| U | Uncalibrated |
| W | Control value |
| X | Excessive difference |
SeaDataNet Quality Control Flags
The following single character qualifying flags may be associated with one or more individual parameters with a data cycle:
| Flag | Description |
|---|---|
| 0 | no quality control |
| 1 | good value |
| 2 | probably good value |
| 3 | probably bad value |
| 4 | bad value |
| 5 | changed value |
| 6 | value below detection |
| 7 | value in excess |
| 8 | interpolated value |
| 9 | missing value |
| A | value phenomenon uncertain |
| B | nominal value |
| Q | value below limit of quantification |
Appendix 1: Bank2
Related series for this Fixed Station are presented in the table below. Further information can be found by following the appropriate links.
If you are interested in these series, please be aware we offer a multiple file download service. Should your credentials be insufficient for automatic download, the service also offers a referral to our Enquiries Officer who may be able to negotiate access.
| Series Identifier | Data Category | Start date/time | Start position | Cruise |
|---|---|---|---|---|
| 1174741 | PAR radiance and irradiance | 2005-07-20 13:32:48 | 49.896 N, 7.883 W | RRS Charles Darwin CD173 |
| 1174753 | PAR radiance and irradiance | 2005-07-20 13:41:39 | 49.896 N, 7.883 W | RRS Charles Darwin CD173 |
| 1174765 | PAR radiance and irradiance | 2005-07-20 13:46:09 | 49.896 N, 7.883 W | RRS Charles Darwin CD173 |
| 737493 | CTD or STD cast | 2005-07-20 14:02:00 | 49.89567 N, 7.88333 W | RRS Charles Darwin CD173 |
| 1174777 | PAR radiance and irradiance | 2005-07-20 15:46:35 | 49.896 N, 7.883 W | RRS Charles Darwin CD173 |
| 1174789 | PAR radiance and irradiance | 2005-07-20 15:54:47 | 49.896 N, 7.883 W | RRS Charles Darwin CD173 |
| 737690 | CTD or STD cast | 2005-07-26 14:03:00 | 49.89583 N, 7.87633 W | RRS Charles Darwin CD173 |
| 1174520 | PAR radiance and irradiance | 2005-07-26 14:45:27 | 49.896 N, 7.883 W | RRS Charles Darwin CD173 |
| 737708 | CTD or STD cast | 2005-07-26 15:15:00 | 49.89733 N, 7.87767 W | RRS Charles Darwin CD173 |
| 1174532 | PAR radiance and irradiance | 2005-07-26 15:39:28 | 49.896 N, 7.883 W | RRS Charles Darwin CD173 |
| 1174544 | PAR radiance and irradiance | 2005-07-26 15:48:30 | 49.896 N, 7.883 W | RRS Charles Darwin CD173 |
| 737721 | CTD or STD cast | 2005-07-26 16:12:00 | 49.892 N, 7.879 W | RRS Charles Darwin CD173 |
| 737733 | CTD or STD cast | 2005-07-26 18:03:00 | 49.89633 N, 7.87967 W | RRS Charles Darwin CD173 |
| 737745 | CTD or STD cast | 2005-07-26 19:00:00 | 49.89983 N, 7.87167 W | RRS Charles Darwin CD173 |
| 737757 | CTD or STD cast | 2005-07-26 20:08:00 | 49.89683 N, 7.87483 W | RRS Charles Darwin CD173 |
| 737769 | CTD or STD cast | 2005-07-26 21:08:00 | 49.89783 N, 7.87517 W | RRS Charles Darwin CD173 |
| 737770 | CTD or STD cast | 2005-07-26 22:01:00 | 49.89433 N, 7.87783 W | RRS Charles Darwin CD173 |
| 737782 | CTD or STD cast | 2005-07-26 22:57:00 | 49.89233 N, 7.87867 W | RRS Charles Darwin CD173 |
| 737794 | CTD or STD cast | 2005-07-26 23:54:00 | 49.8975 N, 7.8805 W | RRS Charles Darwin CD173 |
| 737801 | CTD or STD cast | 2005-07-27 00:56:00 | 49.90067 N, 7.88117 W | RRS Charles Darwin CD173 |
| 737813 | CTD or STD cast | 2005-07-27 01:56:00 | 49.89933 N, 7.881 W | RRS Charles Darwin CD173 |
| 737825 | CTD or STD cast | 2005-07-27 02:54:00 | 49.897 N, 7.87917 W | RRS Charles Darwin CD173 |
| 737837 | CTD or STD cast | 2005-07-27 04:15:00 | 49.89517 N, 7.884 W | RRS Charles Darwin CD173 |
| 737849 | CTD or STD cast | 2005-07-27 05:15:00 | 49.89883 N, 7.88033 W | RRS Charles Darwin CD173 |
| 737850 | CTD or STD cast | 2005-07-27 06:03:00 | 49.89383 N, 7.877 W | RRS Charles Darwin CD173 |
| 1174556 | PAR radiance and irradiance | 2005-07-27 06:33:44 | 49.896 N, 7.883 W | RRS Charles Darwin CD173 |
| 1174568 | PAR radiance and irradiance | 2005-07-27 06:41:58 | 49.896 N, 7.883 W | RRS Charles Darwin CD173 |
| 737862 | CTD or STD cast | 2005-07-27 07:14:00 | 49.90167 N, 7.8815 W | RRS Charles Darwin CD173 |
| 1174581 | PAR radiance and irradiance | 2005-07-27 09:15:13 | 49.896 N, 7.883 W | RRS Charles Darwin CD173 |
| 1174593 | PAR radiance and irradiance | 2005-07-27 09:19:59 | 49.896 N, 7.883 W | RRS Charles Darwin CD173 |
| 1174600 | PAR radiance and irradiance | 2005-07-27 09:25:02 | 49.896 N, 7.883 W | RRS Charles Darwin CD173 |
| 737874 | CTD or STD cast | 2005-07-27 10:22:00 | 49.89083 N, 7.88217 W | RRS Charles Darwin CD173 |
| 737886 | CTD or STD cast | 2005-07-27 10:59:00 | 49.8905 N, 7.88367 W | RRS Charles Darwin CD173 |
| 737898 | CTD or STD cast | 2005-07-27 12:04:00 | 49.897 N, 7.88533 W | RRS Charles Darwin CD173 |
| 737905 | CTD or STD cast | 2005-07-27 12:58:00 | 49.893 N, 7.886 W | RRS Charles Darwin CD173 |
| 1174612 | PAR radiance and irradiance | 2005-07-27 13:34:52 | 49.896 N, 7.883 W | RRS Charles Darwin CD173 |
| 1174624 | PAR radiance and irradiance | 2005-07-27 13:40:51 | 49.896 N, 7.883 W | RRS Charles Darwin CD173 |
| 737917 | CTD or STD cast | 2005-07-27 13:58:00 | 49.90117 N, 7.89167 W | RRS Charles Darwin CD173 |
| 738226 | CTD or STD cast | 2005-07-31 03:17:00 | 49.90483 N, 7.86883 W | RRS Charles Darwin CD173 |
| 738238 | CTD or STD cast | 2005-07-31 05:26:00 | 49.89233 N, 7.88217 W | RRS Charles Darwin CD173 |
| 738251 | CTD or STD cast | 2005-07-31 06:06:00 | 49.8965 N, 7.88267 W | RRS Charles Darwin CD173 |
| 738263 | CTD or STD cast | 2005-07-31 07:00:00 | 49.88683 N, 7.87483 W | RRS Charles Darwin CD173 |
| 1174636 | PAR radiance and irradiance | 2005-07-31 07:39:22 | 49.896 N, 7.883 W | RRS Charles Darwin CD173 |
| 1174648 | PAR radiance and irradiance | 2005-07-31 07:46:03 | 49.896 N, 7.883 W | RRS Charles Darwin CD173 |
| 738275 | CTD or STD cast | 2005-07-31 07:59:00 | 49.8865 N, 7.8805 W | RRS Charles Darwin CD173 |
| 738287 | CTD or STD cast | 2005-07-31 08:55:00 | 49.88817 N, 7.88133 W | RRS Charles Darwin CD173 |
| 738299 | CTD or STD cast | 2005-07-31 09:57:00 | 49.88517 N, 7.88383 W | RRS Charles Darwin CD173 |
| 1174661 | PAR radiance and irradiance | 2005-07-31 10:24:11 | 49.896 N, 7.883 W | RRS Charles Darwin CD173 |
| 1174673 | PAR radiance and irradiance | 2005-07-31 10:30:05 | 49.896 N, 7.883 W | RRS Charles Darwin CD173 |
| 1174685 | PAR radiance and irradiance | 2005-07-31 10:36:05 | 49.896 N, 7.883 W | RRS Charles Darwin CD173 |
| 738306 | CTD or STD cast | 2005-07-31 10:57:00 | 49.88217 N, 7.88517 W | RRS Charles Darwin CD173 |
| 738318 | CTD or STD cast | 2005-07-31 12:01:00 | 49.88583 N, 7.886 W | RRS Charles Darwin CD173 |
| 738331 | CTD or STD cast | 2005-07-31 13:02:00 | 49.882 N, 7.889 W | RRS Charles Darwin CD173 |
| 738343 | CTD or STD cast | 2005-07-31 14:00:00 | 49.88883 N, 7.88533 W | RRS Charles Darwin CD173 |
| 1174697 | PAR radiance and irradiance | 2005-07-31 14:36:00 | 49.896 N, 7.883 W | RRS Charles Darwin CD173 |
| 1174704 | PAR radiance and irradiance | 2005-07-31 14:42:41 | 49.896 N, 7.883 W | RRS Charles Darwin CD173 |
| 738355 | CTD or STD cast | 2005-07-31 14:58:00 | 49.89033 N, 7.88917 W | RRS Charles Darwin CD173 |
| 738367 | CTD or STD cast | 2005-07-31 16:02:00 | 49.889 N, 7.881 W | RRS Charles Darwin CD173 |
| 738379 | CTD or STD cast | 2005-07-31 17:08:00 | 49.8855 N, 7.87383 W | RRS Charles Darwin CD173 |
| 1174716 | PAR radiance and irradiance | 2005-07-31 17:31:58 | 49.896 N, 7.883 W | RRS Charles Darwin CD173 |
| 1174728 | PAR radiance and irradiance | 2005-07-31 17:38:12 | 49.896 N, 7.883 W | RRS Charles Darwin CD173 |
| 738380 | CTD or STD cast | 2005-07-31 18:01:00 | 49.88767 N, 7.881 W | RRS Charles Darwin CD173 |
| 738392 | CTD or STD cast | 2005-07-31 18:56:00 | 49.89117 N, 7.87083 W | RRS Charles Darwin CD173 |
| 738411 | CTD or STD cast | 2005-07-31 19:56:00 | 49.89333 N, 7.882 W | RRS Charles Darwin CD173 |
| 738423 | CTD or STD cast | 2005-07-31 20:55:00 | 49.895 N, 7.8845 W | RRS Charles Darwin CD173 |
| 738435 | CTD or STD cast | 2005-07-31 21:55:00 | 49.89617 N, 7.8825 W | RRS Charles Darwin CD173 |
| 738447 | CTD or STD cast | 2005-07-31 22:56:00 | 49.89733 N, 7.88017 W | RRS Charles Darwin CD173 |
| 738459 | CTD or STD cast | 2005-07-31 23:58:00 | 49.89367 N, 7.882 W | RRS Charles Darwin CD173 |
| 738460 | CTD or STD cast | 2005-08-01 04:02:00 | 49.89217 N, 7.8805 W | RRS Charles Darwin CD173 |
