Metadata Report for BODC Series Reference Number 967779
Metadata Summary
Problem Reports
Data Access Policy
Narrative Documents
Project Information
Data Activity or Cruise Information
Fixed Station Information
BODC Quality Flags
SeaDataNet Quality Flags
Metadata Summary
Data Description |
|||||||||||||||||||||||||||||||||||||||||||||||||||||
|
|||||||||||||||||||||||||||||||||||||||||||||||||||||
Data Identifiers |
|||||||||||||||||||||||||||||||||||||||||||||||||||||
|
|||||||||||||||||||||||||||||||||||||||||||||||||||||
Time Co-ordinates(UT) |
|||||||||||||||||||||||||||||||||||||||||||||||||||||
|
|||||||||||||||||||||||||||||||||||||||||||||||||||||
Spatial Co-ordinates | |||||||||||||||||||||||||||||||||||||||||||||||||||||
|
|||||||||||||||||||||||||||||||||||||||||||||||||||||
Parameters |
|||||||||||||||||||||||||||||||||||||||||||||||||||||
|
|||||||||||||||||||||||||||||||||||||||||||||||||||||
|
|||||||||||||||||||||||||||||||||||||||||||||||||||||
Problem Reports
No Problem Report Found in the Database
Data Quality Report
Due to a zeroing problem with the fluorometer, spurious chlorophyll concentrations were occasionally observed at depth. Any concentrations exceeding 0.1mg/m3 at depths of 200 metres or more have been flagged suspect.
Data Access Policy
Open Data
These data have no specific confidentiality restrictions for users. However, users must acknowledge data sources as it is not ethical to publish data without proper attribution. Any publication or other output resulting from usage of the data should include an acknowledgment.
If the Information Provider does not provide a specific attribution statement, or if you are using Information from several Information Providers and multiple attributions are not practical in your product or application, you may consider using the following:
"Contains public sector information licensed under the Open Government Licence v1.0."
Narrative Documents
Neil Brown MK3 CTD
The Neil Brown MK3 conductivity-temperature-depth (CTD) profiler consists of an integral unit containing pressure, temperature and conductivity sensors with an optional dissolved oxygen sensor in a pressure-hardened casing. The most widely used variant in the 1980s and 1990s was the MK3B. An upgrade to this, the MK3C, was developed to meet the requirements of the WOCE project.
The MK3C includes a low hysteresis, titanium strain gauge pressure transducer. The transducer temperature is measured separately, allowing correction for the effects of temperature on pressure measurements. The MK3C conductivity cell features a free flow, internal field design that eliminates ducted pumping and is not affected by external metallic objects such as guard cages and external sensors.
Additional optional sensors include pH and a pressure-temperature fluorometer. The instrument is no longer in production, but is supported (repair and calibration) by General Oceanics.
Specifications
These specification apply to the MK3C version.
| Pressure | Temperature | Conductivity | |
| Range | 6500 m 3200 m (optional) | -3 to 32°C | 1 to 6.5 S cm-1 |
| Accuracy | 0.0015% FS 0.03% FS < 1 msec | 0.0005°C 0.003°C < 30 msec | 0.0001 S cm-1 0.0003 S cm-1 < 30 msec |
Further details can be found in the specification sheet.
Aquatracka fluorometer
The Chelsea Instruments Aquatracka is a logarithmic response fluorometer. It uses a pulsed (5.5 Hz) xenon light source discharging between 320 and 800 nm through a blue filter with a peak transmission of 420 nm and a bandwidth at half maximum of 100 nm. A red filter with sharp cut off, 10% transmission at 664 nm and 678 nm, is used to pass chlorophyll-a fluorescence to the sample photodiode.
The instrument may be deployed either in a through-flow tank, on a CTD frame or moored with a data logging package.
Further details can be found in the manufacturer's specification sheet.
Chelsea Technologies Photosynthetically Active Radiation (PAR) Irradiance Sensor
This sensor was originally designed to assist the study of marine photosynthesis. With the use of logarithmic amplication, the sensor covers a range of 6 orders of magnitude, which avoids setting up the sensor range for the expected signal level for different ambient conditions.
The sensor consists of a hollow PTFE 2-pi collector supported by a clear acetal dome diverting light to a filter and photodiode from which a cosine response is obtained. The sensor can be used in moorings, profiling or deployed in towed vehicles and can measure both upwelling and downwelling light.
Specifications
| Operation depth | 1000 m |
| Range | 2000 to 0.002 µE m-2 s-1 |
| Angular Detection Range | ± 130° from normal incidence |
| Relative Spectral Sensitivity | flat to ± 3% from 450 to 700 nm down 8% of 400 nm and 36% at 350 nm |
Further details can be found in the manufacturer's specification sheet.
SeaTech Transmissometer
Introduction
The transmissometer is designed to accurately measure the the amount of light transmitted by a modulated Light Emitting Diode (LED) through a fixed-length in-situ water column to a synchronous detector.
Specifications
- Water path length: 5 cm (for use in turbid waters) to 1 m (for use in clear ocean waters).
- Beam diameter: 15 mm
- Transmitted beam collimation: <3 milliradians
- Receiver acceptance angle (in water): <18 milliradians
- Light source wavelength: usually (but not exclusively) 660 nm (red light)
Notes
The instrument can be interfaced to Aanderaa RCM7 current meters. This is achieved by fitting the transmissometer in a slot cut into a customized RCM4-type vane.
A red LED (660 nm) is used for general applications looking at water column sediment load. However, green or blue LEDs can be fitted for specilised optics applications. The light source used is identified by the BODC parameter code.
Further details can be found in the manufacturer's Manual.
RRS Discovery 210 (D210) and RRS Discovery 212 (D212) CTD Data Documentation
Introduction
During the two ARABESQUE cruises (D210, August - September1994 and D 212, October - November 1994), nearly 300 CTD casts were taken. This document describes the CTD data from both cruises. It includes measurements made from the standard CTD unit (salinity derived from conductivity, temperature and depth) and from additional instrumentation attached to the CTD frame (a fluorometer, transmissometer, dissolved oxygen electrode and downwelling and upwelling PAR sensors). This document details the protocols used during data acquisition and processing.
Please note that all times given are in GMT which is local ship time minus four hours.
Instrumentation and Rig Geometry
The 289 CTD profiles were taken with an RVS Neil Brown Systems Mk3B CTD incorporating a pressure sensor, conductivity cell, platinum resistance thermometer and a Beckman dissolved oxygen sensor. The CTD unit was mounted vertically in the centre of a protective cage approximately 1.5 m square. Attached to the bars of the frame was a Chelsea Instruments Aquatracka fluorometer and a SeaTech red light (661 nm) transmissometer with a 25 cm pathlength.
A General Oceanics rosette sampler fitted with 12, 10 litre Niskin or lever action Niskin bottles was mounted above the frame. The bases of the bottles were 0.75 m above the pressure head with their tops 1.55 m above it. One of the bottles was fitted with a holder for up to three digital reversing thermometers mounted 1.38 m above the CTD temperature sensor.
Lowering rates were generally in the range of 0.5-1.0 m/sec but could be up to 1.5 m/sec. Bottle samples were acquired on the ascent of all casts. Reversing thermometer readings were taken on 186 of the 289 casts.
Data Acquisition
The CTD sampled at a frequency of 32 Hz. These data were reduced in real time to a 1-second time series by the RVS Level A microcomputer system. These data were logged as raw counts on the Level C workstation via a Level B data buffer.
On-Board Data Processing
RVS software on the Level C (a SUN workstation) was used to convert the raw counts into engineering units (Volts for the transmissometer and fluorometer, ml/l for oxygen,mmho.cm-1 for conductivity and °C for temperature).
Salinity (Practical Salinity Units, as defined by the Practical Salinity Scale (Fofonoff and Millard 1982)) was calculated from the conductivity ratios (conductivity / 42.914) and a time lagged temperature.
Data were written onto Quarter Inch Cartridge tapes in RVS internal format and submitted to BODC for post-cruise processing and data-banking.
Post-Cruise Processing
Reformatting
The data were converted into the BODC internal format to allow the use of in-house software tools, notably the workstation graphics editor. In addition to reformatting, the transfer program applied the following modifications to the data:
Dissolved oxygen was converted from ml/l to M by multiplying the values by 44.66.
The raw transmissometer voltages were corrected for light source decay using a correction ratio computed from light readings in air taken during the cruise and the manufacturer's figure for the new instrument (4.802 V). The correction was applied as follows:
| Cruise | From | To | Air Reading (V) |
| D210 | 27/08/94 18:05 | 29/08/94 01:46 | 4.770 |
| 29/08/94 01:46 | 30/08/94 03:39 | 4.773 | |
| 30/08/94 03:40 | 01/09/94 04:24 | 4.763 | |
| 01/09/94 04:25 | 02/09/94 00:09 | 4.761 | |
| 02/09/94 00:10 | 04/09/94 06:21 | 4.758 | |
| 04/09/94 06:22 | 06/09/94 08:48 | 4.763 | |
| 06/09/94 08:49 | 11/09/94 06:54 | 4.758 | |
| 11/09/94 06:55 | 14/09/94 11:28 | 4.766 | |
| 14/09/94 11:29 | 27/09/94 07:21 | 4.758 | |
| 27/09/94 07:22 | 30/09/94 09:23 | 4.761 | |
| D212 | 16/11/94 12:56 | 15/12/94 11:40 | 4.763 |
Transmissometer voltages were converted to percentage transmission by multiplying them by 20 and attenuance computed using algorithm:
- attenuance = 4 ln (percent transmittance / 100)
Editing
Using a custom in-house graphics editor, the downcasts and upcasts were differentiated and the limits of the downcasts were manually flagged. Spikes on any of the downcast channels were manually flagged 'suspect' by modification of the associated quality control flag. An instrument spike was defined as a single value or small number of values which showed an inexplicable variation of more than the recommended target precision for that particular parameter. 'Flagging' involved setting a single character quality control flag to denote the status of the data; in this way none of the original data values were edited or deleted during quality control. The following quality control flags were used:
- G - good data
- S - suspect data (instrument spike or malfunction)
- N - null data (not measured)
The pressure ranges over which the bottle samples were taken were logged by manual interaction with the editor. Usually, the marked reaction of the oxygen sensor to the bottle firing sequence was used to determine this. These pressure ranges were subsequently used, in conjunction with a geometrical correction for the position of the water bottles with respect to the CTD pressure transducer, to determine the pressure range of data to be averaged for calibration purposes.
Once screened, the CTD downcasts were loaded into a database under the Oracle relational database management system and further edited as follows:
- on all deep (>300 metres) casts, the upwelling and downwelling PAR channels were all set to suspect as the light meters were taken off for deep casts.
Calibration
Calibration procedures involved comparing the raw output against discrete calibration samples taken concurrently. Particular care was taken to ensure maximum temporal coverage of calibration samples, in order that any time-dependent instrument drift could be fully corrected. Errant calibration points were rejected only if sampling occurred over a considerable gradient and there was reasonable doubt whether the CTD was sampling the same water as the discrete calibration sample. Simple linear regression or multiple linear regression was used to establish the calibration algorithms, apart from in the case of the Aquatrakka fluorometer where the voltage was regressed against log-transformed chlorophyll concentrations. All calibrations described here have been applied to the data.
Pressure
The pressure offset was determined by looking at the pressures recorded when the CTD was clearly logging in air (readily apparent from the conductivity channel). A mean air value (standard deviation of 0.3 db) was determined for all the data from cruise D210, giving the correction:
- Pcorrected = Pobserved - 0.82 db
For cruise D212, two different pressure corrections were used (standard deviations of 0.29 and 0.27db respectively) as follows:
- Pcorr = Pobs - 0.25 db - for casts A1(6,9,16,18,22), A2(6), A7(27), GOM2(3)
- Pcorr = Pobs - 0.35 db - for all other casts
Temperature
The CTD temperatures were in excellent agreement with the digital reversing thermometer readings. Hence no temperature calibration has been applied.
Salinity
Salinity was calibrated against 173 water bottle samples measured on the Guildline 55358 Autolab Salinometer during the two cruises. Samples were obtained from 172 of the 289 casts, usually at the maximum depth of the cast.
Samples were collected in glass bottles filled to just below the neck and sealed with plastic stoppers. Batches of samples were left for at least 24 hours to reach thermal equilibrium in the constant temperature laboratory containing the salinometer before analysis. The corrections applied were:
- Scorrected = Sobserved + 0.0116 (s d = 0.02) - for cruise D210
- Scorrected = Sobserved + 0.03555 (s d= 0.021) - for cruise D212
Oxygen
The dissolved oxygen sensor was calibrated against 1032 water bottle samples analysed following the Winkler titration procedures outlined in Carpenter (1965). The samples were taken from 86 of the 289 casts, normally at several depths. The probe was stable throughout the cruise and therefore a single calibration has been applied to each cruise:
- Ocorrected = Oraw * 2.18 + 1.38 (R2 = 95.2%: n=533)
- Ocorrected = Oraw * 2.82 - 1.04 (R2 = 96.7%: n=499)
Oxygen saturation present in the data files was computed using the algorithm presented in Benson and Krause (1984).
Chlorophyll
Chlorophyll was measured with a Chelsea Mk2 Aquatrakka fluorometer calibrated against discrete samples taken from 654 shallow (< 300 metres) CTD bottles. Samples were filtered through Whatman GF/F filters and frozen in liquid nitrogen until analysed onboard. The frozen filters were extracted in 2-5 ml of 90% acetone and aliquot injected onto a C-8 reverse phase column.Analysis was carried out by reverse phase HPLC. The resultant concentrations of chlorophyll and diavinyl chlorophyll a were summed to give a total calibration concentration. The resulting calibration equations are:
- chlorophyll (mg/m3) = exp (-1.75 + 0.794 * raw-voltage) (R2 = 54.8%)
- chlorophyll (mg/m3) = exp (-3.12 + 1.73 * raw-voltage) (R2 = 65.35%)
In both cases, no significant quenching effects were observed; therefore there is no light term in either calibration.
Data Reduction
Once all screening and calibration procedures were completed, the data set was binnedto 2 db (casts deeper than 100 db) or 1 db (casts shallower than 100 db). The binningalgorithm excluded any data points flagged suspect and attempted linear interpolationover gaps up to 3 bins wide. If any gaps larger than this were encountered, the data in thegaps were set null.Downcast values corresponding to the bottle firing depths were incorporated into thedatabase. Oxygen saturations have been computed using the algorithm of Benson and Krause (1984).
Project Information
ARABESQUE
ARABESQUE was a multidisciplinary oceanographic research project focused on the Arabian Sea and Northwest Indian Ocean during the monsoon and intermonsoon season in 1994. Funding for ARABESQUE was provided by the Ministry of Defence/ Defence Research Agency Joint Grant TQ/10/3/2 and Amersham International as well as the Natural Environment Research Council. ARABESQUE was almost entirely field based with extensive physical, chemical and biological measurements made in the Gulf of Oman, the Arabian Sea and the Northwest Indian Ocean. The aim of the project was to study the upper ocean microbial biogeochemistry in the Arabian Sea. Its focus was carbon and nitrogen cycling processes linked to climate change. The project was a UK contribution to the Joint Global Ocean Flux Study (JGOFS) Process Studies of the Arabian Sea. ARABESQUE was organised by Plymouth Marine Laboratory (PML).
Objectives
The detailed scientific objectives of ARABESQUE were to quantify the seasonal influence of the Monsoon winds in the Arabian Sea on:
-
Upwelling of nutrients and the resultant production and fate of phytoplankton, in terms of size-fractionated, new and regenerated production
-
Vertical and on-shelf gradients of heterotrophic, methanogenic and denitrifying bacteria
-
Distribution of chemotaxonomic pigments with links to optical properties of seawater
-
The Dissolved Inorganic and Organic Carbon cycle
-
Air-sea exchange of Sulphur and Nitrogen biogases including dimethyl sulphide, methylamines and methane
-
Sedimentation rates and the fate of organic matter through the oxygen depleted zone
A final objective was to calibrate satellite data on ocean colour so as to map the biogeochemistry of the northwestern Indian Ocean.
Fieldwork
The fieldwork programme consisted of two cruises of RRS Discovery. Cruise 210 (from 27 August to 4 October 1994) was timed to coincide with the South West Monsoon. Cruise 212 (from 16 November to 19 December 1994) took place during the intermonsoon period through to the onset of the North East Monsoon. The fieldwork programme included three repeated sections;
-
One section along the Gulf of Oman
-
A section at 8°N 67°E to 14° 30N 67°E
-
A major section from 8°N 67°E to the coast of Oman
Other one-off sections were also crossed in the area. Sections were covered by underway upper ocean measurements and by a total of 21 sites where CTD/water-bottle stations were taken, 14 of which were repeated.
Data Management
Data management services to the ARABESQUE project were provided by the British Oceanographic Data Centre, funded by the UK Natural Environment Research Council.
Data Activity or Cruise Information
Cruise
| Cruise Name | D212 |
| Departure Date | 1994-11-16 |
| Arrival Date | 1994-12-19 |
| Principal Scientist(s) | Peter H Burkill (Plymouth Marine Laboratory) |
| Ship | RRS Discovery |
Complete Cruise Metadata Report is available here
Fixed Station Information
Fixed Station Information
| Station Name | ARABESQUE Arabian Sea Station 2 (A2) |
| Category | Offshore location |
| Latitude | 17° 30.00' N |
| Longitude | 60° 30.00' E |
| Water depth below MSL | 3914.0 m |
ARABESQUE - Arabian Sea Station 2 (A2)
Site A2 is one of 20 ARABESQUE fixed stations illustrated in the map below.
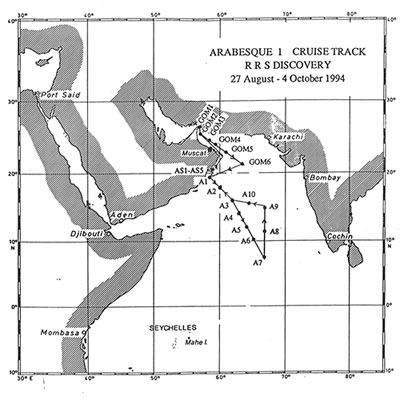
ARABESQUE fixed stations were visited by 2 cruises, namely: RRS Discovery 210 (D210) - 25 August to 05 October 1994 and RRS Discovery 212 (D212) - 16 November to 19 December 1994. The cruises operated in survey and station mode: station mode consisted of profiling, production and trap stations.
More information is available via the D210 and D212 cruise reports.
Related Fixed Station activities are detailed in Appendix 1
BODC Quality Control Flags
The following single character qualifying flags may be associated with one or more individual parameters with a data cycle:
| Flag | Description |
|---|---|
| Blank | Unqualified |
| < | Below detection limit |
| > | In excess of quoted value |
| A | Taxonomic flag for affinis (aff.) |
| B | Beginning of CTD Down/Up Cast |
| C | Taxonomic flag for confer (cf.) |
| D | Thermometric depth |
| E | End of CTD Down/Up Cast |
| G | Non-taxonomic biological characteristic uncertainty |
| H | Extrapolated value |
| I | Taxonomic flag for single species (sp.) |
| K | Improbable value - unknown quality control source |
| L | Improbable value - originator's quality control |
| M | Improbable value - BODC quality control |
| N | Null value |
| O | Improbable value - user quality control |
| P | Trace/calm |
| Q | Indeterminate |
| R | Replacement value |
| S | Estimated value |
| T | Interpolated value |
| U | Uncalibrated |
| W | Control value |
| X | Excessive difference |
SeaDataNet Quality Control Flags
The following single character qualifying flags may be associated with one or more individual parameters with a data cycle:
| Flag | Description |
|---|---|
| 0 | no quality control |
| 1 | good value |
| 2 | probably good value |
| 3 | probably bad value |
| 4 | bad value |
| 5 | changed value |
| 6 | value below detection |
| 7 | value in excess |
| 8 | interpolated value |
| 9 | missing value |
| A | value phenomenon uncertain |
| B | nominal value |
| Q | value below limit of quantification |
Appendix 1: ARABESQUE Arabian Sea Station 2 (A2)
Related series for this Fixed Station are presented in the table below. Further information can be found by following the appropriate links.
If you are interested in these series, please be aware we offer a multiple file download service. Should your credentials be insufficient for automatic download, the service also offers a referral to our Enquiries Officer who may be able to negotiate access.
| Series Identifier | Data Category | Start date/time | Start position | Cruise |
|---|---|---|---|---|
| 966094 | CTD or STD cast | 1994-09-11 01:04:00 | 17.50367 N, 60.49467 E | RRS Discovery D210 |
| 1653791 | Water sample data | 1994-09-11 01:29:00 | 17.5036 N, 60.49462 E | RRS Discovery D210 |
| 966101 | CTD or STD cast | 1994-09-11 02:02:00 | 17.50883 N, 60.48617 E | RRS Discovery D210 |
| 1851123 | Water sample data | 1994-09-11 03:31:00 | 17.50877 N, 60.48616 E | RRS Discovery D210 |
| 966113 | CTD or STD cast | 1994-09-11 06:55:00 | 17.52067 N, 60.497 E | RRS Discovery D210 |
| 1851135 | Water sample data | 1994-09-11 07:12:00 | 17.52068 N, 60.49696 E | RRS Discovery D210 |
| 964978 | CTD or STD cast | 1994-09-29 01:05:00 | 17.41083 N, 60.602 E | RRS Discovery D210 |
| 964991 | CTD or STD cast | 1994-09-29 04:38:00 | 17.50167 N, 60.50433 E | RRS Discovery D210 |
| 965005 | CTD or STD cast | 1994-09-29 06:54:00 | 17.4945 N, 60.50367 E | RRS Discovery D210 |
| 965017 | CTD or STD cast | 1994-09-29 08:22:00 | 17.49867 N, 60.49767 E | RRS Discovery D210 |
| 1851111 | Water sample data | 1994-09-29 08:43:00 | 17.49867 N, 60.49762 E | RRS Discovery D210 |
| 967755 | CTD or STD cast | 1994-11-29 00:55:00 | 17.49983 N, 60.50067 E | RRS Discovery D212 |
| 1300707 | Water sample data | 1994-11-29 01:25:00 | 17.49984 N, 60.50062 E | RRS Discovery D212 |
| 967767 | CTD or STD cast | 1994-11-29 02:00:00 | 17.50067 N, 60.49983 E | RRS Discovery D212 |
| 1300719 | Water sample data | 1994-11-29 03:42:00 | 17.50064 N, 60.49985 E | RRS Discovery D212 |
| 1868675 | Water sample data | 1994-11-29 03:42:00 | 17.50064 N, 60.49985 E | RRS Discovery D212 |
| 966985 | CTD or STD cast | 1994-11-29 06:32:00 | 17.50383 N, 60.5025 E | RRS Discovery D212 |
| 1300720 | Water sample data | 1994-11-29 06:52:00 | 17.50385 N, 60.50245 E | RRS Discovery D212 |
| 1868687 | Water sample data | 1994-11-29 06:52:00 | 17.50385 N, 60.50245 E | RRS Discovery D212 |
