Metadata Report for BODC Series Reference Number 1167117
Metadata Summary
Problem Reports
Data Access Policy
Narrative Documents
Project Information
Data Activity or Cruise Information
Fixed Station Information
BODC Quality Flags
SeaDataNet Quality Flags
Metadata Summary
Data Description |
|||||||||||||||||||||||||||||||||||||||||||||
|
|||||||||||||||||||||||||||||||||||||||||||||
Data Identifiers |
|||||||||||||||||||||||||||||||||||||||||||||
|
|||||||||||||||||||||||||||||||||||||||||||||
Time Co-ordinates(UT) |
|||||||||||||||||||||||||||||||||||||||||||||
|
|||||||||||||||||||||||||||||||||||||||||||||
Spatial Co-ordinates | |||||||||||||||||||||||||||||||||||||||||||||
|
|||||||||||||||||||||||||||||||||||||||||||||
Parameters |
|||||||||||||||||||||||||||||||||||||||||||||
|
|||||||||||||||||||||||||||||||||||||||||||||
|
|||||||||||||||||||||||||||||||||||||||||||||
Problem Reports
No Problem Report Found in the Database
Data Access Policy
Open Data
These data have no specific confidentiality restrictions for users. However, users must acknowledge data sources as it is not ethical to publish data without proper attribution. Any publication or other output resulting from usage of the data should include an acknowledgment.
If the Information Provider does not provide a specific attribution statement, or if you are using Information from several Information Providers and multiple attributions are not practical in your product or application, you may consider using the following:
"Contains public sector information licensed under the Open Government Licence v1.0."
Narrative Documents
Seapoint Chlorophyll Fluorometer
The Seapoint Chlorophyll Fluorometer (SCF) is a low power instrument for in situ measurements of chlorophyll a. The SCF uses modulated blue LED lamps and a blue excitation filter to excite chlorophyll a. The fluorescent light emitted by the chlorophyll a passes through a red emission filter and is detected by a silicon photodiode. The low level signal is then processed using synchronous demodulation circuitry which generates an output voltage proportional to chlorophyll a concentration. The SCF may be operated with or without a pump.
Sensor specifications, current at August 2006, are given in the table below. More information can be found at the manufacturer's web site.
Sensor Specifications
| Power requirements | 8 - 20 VDC, 15 mA avg., 27 mA pk. |
|---|---|
| Output | 0 - 5.0 VDC |
| Output Time Constant | 0.1 sec. |
| Power-up transient period | < 1 sec. |
| Excitation Wavelength | 470 nm CWL, 30 nm FWHM |
| Emission Wavelength | 685 nm CWL, 30 nm FWHM |
| Sensing Volume | 340 mm3 |
| Minimum Detectable Level | 0.02 µg l-1 |
| Gain | Sensitivity, V µg-1 l-1 | Range, µg l-1 | |
|---|---|---|---|
| Sensitivity/Range | 30x 10x 3x 1x | 1.0 0.33 0.1 0.033 | 5 15 50 150 |
Aanderaa Conductivity Sensors 3919/4119/4120
The Aanderaa Conductivity Sensors are based on an inductive principle. This provides for stable measurement without electrodes that are easily fouled and may wear out in the field.
All sensors are available in A and B versions; version B has enhanced accuracy compared to version A. Additionally, sensor 3919 is available in three depth ratings as well: 6000 m (3919DW; Deep Water), 2000 m (3919IW; Intermediate Water) and 300 m (3919SW; Shallow Water).
The sensors are compact fully integrated sensors for measuring the electrical conductivity of seawater. The 3919 model is designed to be mounted directly on the top-end plate of Recording Conductivity Sensor (RCM) 9/11 and Recording Doppler Current Profiler (RDCP) as well as for standalone operation via the SR10 or RS-232 interface. The 4119 model can be connected via cable to a AADI SR10/VR22 Data logger, and the 4120 model provides analog output to third party loggers.
Features of the conductivity sensors:
- Smart sensor technology - provides calibrated data directly
- Real-time integrated calculation of salinity, density and sound of speed
- Low maintenance needs
- Easy functionality check
- 3 depth ranges, maximum 6000 m.
- Internal pressure never exceeds 1 bar therefore electronics and sensors are unaffected by sea depth
- Output format: SR10, RS-232, Analog 0-5 V/ 4-20 mA
Sensor specifications may be viewed via the following link Aanderaa Conductivity Sensor 3919/4119/4120
Aanderaa Oxygen Optodes models 3835, 4130, 4175, 3830, 3930 and 3975
The Aanderaa Oxygen Optode is based on the ability of selected substances to act as dynamic fluorescence quenchers. The fluorescent indicator is a special platinum porphyrin complex embedded in a gas permeable foil that is exposed to the surrounding water.
A black optical isolation coating protects the complex from sunlight and fluorescent particles in the water. This sensing foil is attached to a window providing optical access for the measuring system from inside a watertight titanium housing.
The foil is excited by modulated blue light, and the phase of a returned red light is measured. By linearizing and temperature compensating, with an incorporated temperature sensor, the absolute O2 concentration can be determined. According to the manufacturer, the lifetime-based luminescence quenching principle offers the following advantages over electro-chemical sensors:
- Not stirring sensitive (it consumes no oxygen)
- Less affected by fouling
- Measures absolute oxygen concentrations without repeated calibrations
- Better long-term stability
- Less affected by pressure
- Pressure behaviour is predictable
- Faster response time
The 3835, 4130 and 4175 models are designed to operate down to 300 m, while there are two versions of the 3830, 3930 and 3975 models, designed to operate down to 2000 m and 6000 m, respectively. The sensors fit directly on to the top end-plate of Recording Current Meter RCM 9, and other Aanderaa instruments. Sensor specifications may be viewed via the following links: Aanderaa Oxygen Optodes 3835/4130/4175 and Aanderaa Oxygen Optodes 3830/3930/3975.
LI-COR LI-192 Underwater Quantum Sensor
The LI-192 Underwater Quantum Sensor is used to measure photosynthetic photon flux density and is cosine corrected. The sensor is often referred to as LI-192SA or LI-192SB (the LI-192SB model was superseded by LI-192SA). One of the main differences is that the LI-192SA model includes a built-in voltage output for interfacing with NexSens iSIC and SDL data loggers.
Sensor specifications, current at January 2012, are given in the table below. More information can be found in the manufacturer's LI-192SA andLI-192SB specification sheets.
Sensor Specifications
(Specifications apply to both models unless otherwise stated)
| Absolute Calibration | ± 5 % in air traceable to NBS. |
|---|---|
| Sensitivity | Typically 3 µA per 1000 µmol s-1 m-2 for LI-192SB and 4 µA per 1000 µmol s-1 m-2 for LI-192SA in water. |
| Linearity | Maximum deviation of 1 % up to 10,000 µmol s-1 m-2. |
| Stability | < ± 2 % change over a 1 year period. |
| Response Time | 10 µs. |
| Temperature Dependence | ± 0.15 % per °C maximum. |
| Cosine Correction | Optimized for both underwater and atmospheric use. |
| Azimuth | < ± 1 % error over 360 ° at 45 ° elevation. |
| Detector | High stability silicon photovoltaic detector (blue enhanced). |
| Sensor Housing | Corrosion resistant metal with acrylic diffuser for both saltwater and freshwater applications. Waterproof to withstand 800 psi (5500 kPa) (560 meters). |
Seapoint Turbidity Meter
The Seapoint Turbidity Meter detects light scattered by particles suspended in water, generating an output voltage proportional to turbidity or suspended solids. Range is selected by two digital lines which can be hard wired or microprocessor controlled, thereby choosing the appropriate range and resolution for measurement of extremely clean to very turbid waters. The offset voltage is within 1 mV of zero and requires no adjustment across gains. The optical design confines the sensing volume to within 5 cm of the sensor allowing near-bottom measurements and minimizing errant reflections in restricted spaces.
Sensor specifications, current at August 2006, are given in the table below.
Sensor Specifications
| Power requirements | 7 - 20 VDC, 3.5 mA avg., 6 mA pk. |
|---|---|
| Output | 0 - 5.0 VDC |
| Output Time Constant | 0.1 sec. |
| RMS Noise> | < 1 mV |
| Power-up transient period | < 1 sec. |
| Light Source Wavelength | 880 nm |
| Sensing Distance (from windows) | < 5 cm (approx.) |
| Linearity | < 2% deviation 0 - 750 FTU |
| Gain | Sensitivity (mV FTU-1) | Range (FTU) | |
|---|---|---|---|
| Sensitivity/Range | 100x 20x 5x 1x | 200 40 10 2 | 25 125 500 ** |
** output is non-linear above 750 FTU.
Further details can be found in the manufacturer's specification sheet.
Data processing by originator
Instruments and methods for all North Dogger SmartBuoy deployments are described by Greenwood et al. (2010). The thermocline-depth rig on the SmartBuoy mooring was equipped with the following instruments:
| Instrument | Serial number | Depth | Parameters |
|---|---|---|---|
| Seapoint chlorophyll fluorometer | 2757 | 25 m | Chlorophyll fluorescence |
| Aanderaa Optode | 219 | 25 m | Oxygen concentration, cell temperature |
| LiCor PAR Sensor | 32 | 25 m | PAR |
| Aanderaa conductivity sensor | 173 | 25 m | Salinity, temperature |
| Seapoint optical back scatter meter | 10480 | 25 m | Suspended particulates |
In situ measurements
In situ sensors were mounted at 25 m depth on the mooring. A solid state data logger (ESM-2) designed and built by Centre for Environment, Fisheries and Aquaculture Science (Cefas, UK) was used for data acquisition and sensor control. Measurements were recorded at a frequency of 1 Hz for turbidity, chlorophyll fluorescence and temperature and conductivity from FSI sensors and at 5 Hz for Aanderaa optode and Aanderaa conductivity sensors, with a burst frequency of 2 per hour and a burst duration of between 5 and 10 min depending on the length of mooring deployment.
The in situ chorophyll, oxygen, salinity and suspended particulates data were bench calibrated against commercial standards and natural seawater.
Discrete sample collection and analysis
Discrete samples for calibration were collected by CTD rosette sampler, during visits to the mooring. Data from CTD samples have not been merged into the mooring data set.
References
Greenwood N., Parker E.R., Fernand L., Sivyer D.B., Weston K., Painting S.J., Kröger S., Forster R.M., Lees H.E., Mills D.K., Laane R.W.P.M., 2010. Detection of low bottom water oxygen concentrations in the North Sea; implications for monitoring and assessment of ecosystem health. Biogeosciences, 7, 1357-1373.
Processing by BODC
The processed and quality-controlled data were supplied to BODC in a bulk, ASCII format file. Accompanying files provided instrument metadata. The data were converted into BODC's standard format, with one file for each rig deployment. The data were visually screened, taking into account comparisons between related parameters, and the environmental context. No major data issues were identified, but there may be some gaps in the data series, due to instrument failures.
Project Information
No Project Information held for the Series
Data Activity or Cruise Information
Data Activity
| Start Date (yyyy-mm-dd) | 2007-02-25 |
| End Date (yyyy-mm-dd) | 2007-04-23 |
| Organization Undertaking Activity | Centre for Environment, Fisheries and Aquaculture Science Lowestoft Laboratory |
| Country of Organization | United Kingdom |
| Originator's Data Activity Identifier | NDOGGER_FEB07_APR07 |
| Platform Category | subsurface mooring |
North Dogger SmartBuoy, February to April 2007
This SmartBuoy mooring was deployed by CEFAS north of Dogger Bank, 55° 40.27'N, 2° 17.88'E.
| Rig position: | 55° 40.27'N, 2° 17.88'E |
|---|---|
| Deployed: | 25th February 2007 from Cefas Endeavour cruise 3/07 |
| Recovered: | 23rd April 2007 from Cefas Endeavour cruise 8/07 |
Two sensor suites were deployed on the mooring, one near-surface and one at thermocline depth.
Instruments deployed on the mooring
| Depth | Instrument | Serial Number |
|---|---|---|
| 1 m | Seapoint chlorophyll fluorometer | 2821 |
| 1 m | LiCor PAR Sensor | 49 |
| 2 m | LiCor PAR Sensor | 17 |
| 1 m | FSI CT Module | 1991 |
| 1 m | NAS-2E nutrient sensor | 1819 |
| 1 m | Seapoint optical back scatter meter | 10030 |
| 1 m | WMS-1 AquaMonitor | 2255 |
| 25 m | Seapoint chlorophyll fluorometer | 2757 |
| 25 m | Aanderaa Optode | 219 |
| 25 m | LiCor PAR Sensor | 32 |
| 25 m | Aanderaa conductivity sensor | 173 |
| 25 m | Seapoint optical back scatter meter | 10480 |
Related Data Activity activities are detailed in Appendix 1
Cruise
| Cruise Name | 3/07 |
| Departure Date | 2007-02-21 |
| Arrival Date | 2007-02-27 |
| Principal Scientist(s) | Liam Fernand (Centre for Environment, Fisheries and Aquaculture Science Lowestoft Laboratory) |
| Ship | RV Cefas Endeavour |
Complete Cruise Metadata Report is available here
Fixed Station Information
Fixed Station Information
| Station Name | Cefas North Dogger |
| Category | Offshore location |
| Latitude | 55° 40.27' N |
| Longitude | 2° 17.88' E |
| Water depth below MSL | 80.0 m |
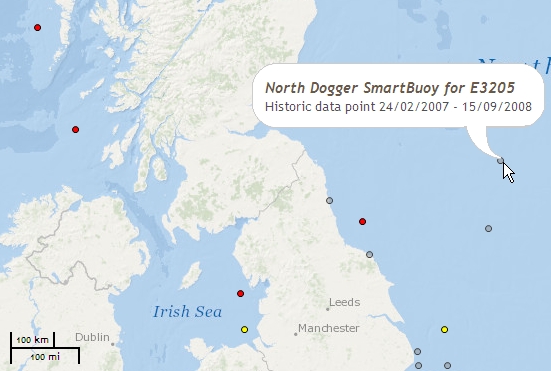
Cefas North Dogger SmartBuoy mooring site
Cefas maintained a SmartBuoy mooring site at the north of Dogger Bank, 55°40.27'N, 2°17.88'E, in approximately 80 m of water, from 24/02/2007 to 15/09/2008.
Normally two sensor suites were deployed on the mooring during each deployment: one near-surface (about 1 m); and one at thermocline depth (25 m or 31 m).
The near-surface frame was typically equipped as follows:
| Instrument | Description |
|---|---|
| NAS-3X in situ nutrient analyser | Hourly in situ measurements of nitrate/nitrate concentration |
| WMS-2 water sampler | Daily water samples for laboratory analysis of nutrient concentrations. |
| Fluorometer | 30-minute measurements of chlorophyll fluorescence. |
| PAR sensors | 30-minute measurements of Photosynthetically Active Radiation (PAR). Often sensors were mounted at two or three depths to give near-surface profiles indicating light attenuance. |
| Optical backscatter | 30-minute measurements of suspended particulate concentrations |
| Conductivity cell | 30-minute measurements of conductivity and salinity |
| Temperature probe | 30-minute measurements of water temperature |
The mid-tether frame was typically equipped as follows:
| Instrument | Description |
|---|---|
| Optode | In situ oxygen sensor. 30-minute measurements of oxygen concentration. |
| Fluorometer | 30-minute measurements of chlorophyll fluorescence. |
| PAR sensors | 30-minute measurements of Photosynthetically Active Radiation (PAR) at one depth |
| Optical backscatter | 30-minute measurements of suspended particulate concentrations |
| Conductivity cell | 30-minute measurements of conductivity and salinity |
| Temperature probe | 30-minute measurements of water temperature |
The SmartBuoy mooring was first deployed on Cefas Endeavour cruise 3/07. Data were relayed to shore every two hours. The mooring was deployed for several months at a time, after which it was serviced, sensors replaced or repositioned, samples recovered, and then it would be re-deployed. In total, there were seven individual deployments at the North Dogger site:
| Deployment | Recovery | Notes | ||
|---|---|---|---|---|
| Date | Cruise | Date | Cruise | |
| 25/02/2007 | 3/07 | 23/04/2007 | 8/07 | Sensors at 1 m and 25 m |
| 23/04/2007 | 8/07 | 21/05/2007 | 10/07 | Sensors at 1 m only |
| 21/05/2007 | 10/07 | 19/09/2007 | 17/07 | Sensors at 1 m and 31 m |
| 19/09/2007 | 17/07 | 31/10/2007 | 19/07 | Sensors at 1 m and 31 m |
| 31/10/2007 | 19/07 | 20/01/2008 | 1/08 | Sensors at 1 m and 31 m |
| 20/01/2008 | 1/08 | 28/04/2008 | 8/08 | Sensors at 1 m and 31 m |
| 28/04/2008 | 8/08 | 14/09/2008 | 16/08 | Sensors at 1 m and 31 m |
SmartBuoy deployments at the North Dogger site were funded by Marine Ecosystem Connections: essential indicators of healthy, productive and biologically diverse seas, a project funded by the UK Government's Department for Environment, Food and Rural Affairs (Defra project code ME3205).
Related Fixed Station activities are detailed in Appendix 2
BODC Quality Control Flags
The following single character qualifying flags may be associated with one or more individual parameters with a data cycle:
| Flag | Description |
|---|---|
| Blank | Unqualified |
| < | Below detection limit |
| > | In excess of quoted value |
| A | Taxonomic flag for affinis (aff.) |
| B | Beginning of CTD Down/Up Cast |
| C | Taxonomic flag for confer (cf.) |
| D | Thermometric depth |
| E | End of CTD Down/Up Cast |
| G | Non-taxonomic biological characteristic uncertainty |
| H | Extrapolated value |
| I | Taxonomic flag for single species (sp.) |
| K | Improbable value - unknown quality control source |
| L | Improbable value - originator's quality control |
| M | Improbable value - BODC quality control |
| N | Null value |
| O | Improbable value - user quality control |
| P | Trace/calm |
| Q | Indeterminate |
| R | Replacement value |
| S | Estimated value |
| T | Interpolated value |
| U | Uncalibrated |
| W | Control value |
| X | Excessive difference |
SeaDataNet Quality Control Flags
The following single character qualifying flags may be associated with one or more individual parameters with a data cycle:
| Flag | Description |
|---|---|
| 0 | no quality control |
| 1 | good value |
| 2 | probably good value |
| 3 | probably bad value |
| 4 | bad value |
| 5 | changed value |
| 6 | value below detection |
| 7 | value in excess |
| 8 | interpolated value |
| 9 | missing value |
| A | value phenomenon uncertain |
| B | nominal value |
| Q | value below limit of quantification |
Appendix 1: NDOGGER_FEB07_APR07
Related series for this Data Activity are presented in the table below. Further information can be found by following the appropriate links.
If you are interested in these series, please be aware we offer a multiple file download service. Should your credentials be insufficient for automatic download, the service also offers a referral to our Enquiries Officer who may be able to negotiate access.
| Series Identifier | Data Category | Start date/time | Start position | Cruise |
|---|---|---|---|---|
| 1167105 | Multiple data types -data buoy | 2007-02-25 16:00:00 | 55.68333 N, 2.28 E | RV Cefas Endeavour 3/07 |
Appendix 2: Cefas North Dogger
Related series for this Fixed Station are presented in the table below. Further information can be found by following the appropriate links.
If you are interested in these series, please be aware we offer a multiple file download service. Should your credentials be insufficient for automatic download, the service also offers a referral to our Enquiries Officer who may be able to negotiate access.
| Series Identifier | Data Category | Start date/time | Start position | Cruise |
|---|---|---|---|---|
| 1167105 | Multiple data types -data buoy | 2007-02-25 16:00:00 | 55.68333 N, 2.28 E | RV Cefas Endeavour 3/07 |
| 1167129 | Multiple data types -data buoy | 2007-04-23 16:00:00 | 55.68333 N, 2.28 E | RV Cefas Endeavour 8/07 |
| 1167246 | Multiple data types -data buoy | 2007-04-23 16:00:00 | 55.68333 N, 2.28 E | RV Cefas Endeavour 8/07 |
| 1167130 | Multiple data types -data buoy | 2007-05-21 13:00:00 | 55.68333 N, 2.28 E | RV Cefas Endeavour 10/07 |
| 1167142 | Multiple data types -data buoy | 2007-05-21 13:00:00 | 55.68333 N, 2.28 E | RV Cefas Endeavour 10/07 |
| 1167154 | Multiple data types -data buoy | 2007-09-19 18:30:00 | 55.68333 N, 2.28 E | RV Cefas Endeavour 17/07 |
| 1167166 | Multiple data types -data buoy | 2007-09-19 18:30:00 | 55.68333 N, 2.28 E | RV Cefas Endeavour 17/07 |
| 1167178 | Multiple data types -data buoy | 2007-10-31 15:00:00 | 55.68333 N, 2.28 E | RV Cefas Endeavour 19/07 |
| 1167191 | Multiple data types -data buoy | 2007-10-31 15:00:00 | 55.68333 N, 2.28 E | RV Cefas Endeavour 19/07 |
| 1167209 | Multiple data types -data buoy | 2008-01-20 14:00:00 | 55.68333 N, 2.28 E | RV Cefas Endeavour 1/08 |
| 1167210 | Multiple data types -data buoy | 2008-01-20 14:00:00 | 55.68333 N, 2.28 E | RV Cefas Endeavour 1/08 |
| 1167222 | Multiple data types -data buoy | 2008-04-28 12:30:00 | 55.68333 N, 2.28 E | RV Cefas Endeavour 8/08 |
| 1167234 | Multiple data types -data buoy | 2008-04-28 12:30:00 | 55.68333 N, 2.28 E | RV Cefas Endeavour 8/08 |
