Metadata Report for BODC Series Reference Number 1167105
Metadata Summary
Problem Reports
Data Access Policy
Narrative Documents
Project Information
Data Activity or Cruise Information
Fixed Station Information
BODC Quality Flags
SeaDataNet Quality Flags
Metadata Summary
Data Description |
|||||||||||||||||||||||||||||||||||||||||||||||||||||||||
|
|||||||||||||||||||||||||||||||||||||||||||||||||||||||||
Data Identifiers |
|||||||||||||||||||||||||||||||||||||||||||||||||||||||||
|
|||||||||||||||||||||||||||||||||||||||||||||||||||||||||
Time Co-ordinates(UT) |
|||||||||||||||||||||||||||||||||||||||||||||||||||||||||
|
|||||||||||||||||||||||||||||||||||||||||||||||||||||||||
Spatial Co-ordinates | |||||||||||||||||||||||||||||||||||||||||||||||||||||||||
|
|||||||||||||||||||||||||||||||||||||||||||||||||||||||||
Parameters |
|||||||||||||||||||||||||||||||||||||||||||||||||||||||||
|
|||||||||||||||||||||||||||||||||||||||||||||||||||||||||
|
|||||||||||||||||||||||||||||||||||||||||||||||||||||||||
Problem Reports
No Problem Report Found in the Database
Data Access Policy
Open Data
These data have no specific confidentiality restrictions for users. However, users must acknowledge data sources as it is not ethical to publish data without proper attribution. Any publication or other output resulting from usage of the data should include an acknowledgment.
If the Information Provider does not provide a specific attribution statement, or if you are using Information from several Information Providers and multiple attributions are not practical in your product or application, you may consider using the following:
"Contains public sector information licensed under the Open Government Licence v1.0."
Narrative Documents
NAS-2E in situ Nutrient Analyser
The NAS-2E in situ Nutrient Analyser is a submersible instrument for the automated measurement of dissolved nutrient concentrations in marine and fresh waters. It employs colorimetric wet-chemistry to determine nutrient concentrations by measuring the light absorbance of a coloured dye produced by a chemical reaction. The instrument, manufactured by WS Ocean Systems Ltd., Hans, UK, is designed for deployment on moorings. Versions have been developed for nitrate+nitrite, phosphate and silicate. The use of standard wet-chemistry techniques ensure comparability with laboratory results.
References for manufacturer's standard chemical methods are:
- Nitrate and Nitrite: adapted from Armstrong, Stearns and Strickland (1967), modified by Stainton (1974)
- Silicate: adapted from Grasshoff et al. (1983) and Hydes (1984)
- Phosphate: adapted from Murphy and Riley (1962)
although these may be altered by the user.
The system utilizes a syringe pump and rotary valve to acquire and react discrete water samples. For nitrate+nitrite analysis, the samples is first passed over a copper-cadmium column to reduce nitrate to nitrite before reacting with the reagents to form the dye. Once the reaction takes place the sample is injected into the colorimeter where optical beam attenuation is measured. An integral system controller drives the syringe and valve via stepper motors and records the colorimeter readings.
The analysis routines include blank measurements for turbidity and optical fouling. An on-board calibration standard is periodically analysed to ensure the continuous integrity of the results. Programmable controls allows the operator to develop and program alternative chemical routines. All raw data are recorded as voltages representing beam transmission through the sample within the colorimeter pathlength. Following recovery of the instrument, raw data are downloaded to a PC and converted to absorbance units and nutrient concentration using manufacturer's calibration and on- board blank and standard readings.
Manufacturer's specification:
| Wavelength | 560 nm | 880 nm |
|---|---|---|
| Accuracy | 2% of range | 5% of range |
| Sensitivity | 0.5% of range | 2.5% of range |
Level of detection (PL = colorimeter path length):
| Nitrate (µM) | 0-300 with 5 mm PL |
|---|---|
| 0-60 with 10 mm PL | |
| 0-10 with 20 mm PL | |
| 0-5 with 40 mm PL | |
| Silicate (µM) | 0-60 with 10 mm PL |
| 0-10 with 20 mm PL | |
| Phosphate (µM) | 0-3 with 20 mm PL |
| 0-1 with 40 mm PL |
Skalar San+ Autoanalyzer
The San+ Autoanalyzer is an Automated Wet Chemistry Analyzer (Continuous Flow Analyzer) which has been designed as a modular system to measure a variety of water chemistry characteristics, such as nutrient concentrations in seawater. Individual modules are tailored to specific needs. It uses Continuous Flow Analysis (CFA), allowing up to 16 analytical measurements to be made on a single sample simultaneously. The system comprises a sampler, chemistry section, detector and specialist software.
Chemistry section
The San+ includes a chemistry section which has hundreds of applications. It houses up to five chemistry cartridges with built-in dosing pump and air injection systems, up to five interchangeable cartridges with build-in photometric detectors and five separate waste receptacles. The throughput of the analyser depends upon application and can vary from 25 to 120 analyses per hour. It has a double diameter pump deck for accurate dosing with 32 pump tubes, two separated pump decks for 2 x 2 channel concept, and controlled synchronised eight channel air injection with separate built-in compressor for increased flow stability and fast start-up. It has easy access to chemistry cartridges with flexible ultra low carry-over connections between dialysers, reactors, coils, flow cells and other components, leak detection, 3-cuffs long life pump tubes, and has manually operated and automatic rinsing valves for easy automatic start up and overnight operation.
Detectors
The San+ range of detectors comprises dual channel colorimetric detectors, the unique matrix correction detector with automatic background correction for difficult sample matrixes, but also covers a range of detectors for I.R., U.V., fluorimetry, ISE, flame photometry, refractometers, density meters, etc.
Software
The San+ 'Flow Access' windows software package controls the complete analyser, with auto start-up, function control, and auto-scaling, pre-and post run sample dilutions, result calculation and statistics. Up to 16 channels can be handled simultaneously, with multiple samplers, and chemistries can be grouped for analysis.
The San+ is also known as San++.
Falmouth Scientific Inc. OEM CT sensor
The OEM CT sensor is designed to provide high accuracy conductivity and temperature measurements in a package that can be readily integrated into user systems. The CT sensor relies on an inductively coupled conductivity sensor, with a large inside diameter that eliminates the need for pumps. A high grade Platinum Resistance Thermometer is used to measure temperature.
Sensor specifications are given in the table below. Since 2009 this instrument has been manufactured by Teledyne RD Instruments as a Citadel CT-EK Sensor. More information about the instrument can be found on the Teledyne Citadel specification sheet.
Sensor Specifications
| Instrument Parameter | Small CT Cell Conductivity | Large CT Cell Conductivity | Temperature | |
|---|---|---|---|---|
| Range | 0 to 70 mS cm-1 | 0 to 70 mS cm-1 | -2 to 35 degrees C | |
| Accuracy | ±0.020 mS cm-1 | ±0.010 mS cm-1 | ±0.050 degrees C | |
| Stability | ±0.005 mS cm-1 mo-1 | ±0.003 mS cm-1 | ±0.005 degrees C mo-1 | |
| Response | 20 cm @ 1 m s-1 | 15 cm @ 1 m s-1 | 20 seconds internal, 1 second external |
| Power Input | 50 mW @ 6 VDC, voltage range 6 - 14 VDC |
|---|---|
| Logic | 2 0 - 5 VDC control lines |
| Output Impedance | 500 ohms |
Seapoint Chlorophyll Fluorometer
The Seapoint Chlorophyll Fluorometer (SCF) is a low power instrument for in situ measurements of chlorophyll a. The SCF uses modulated blue LED lamps and a blue excitation filter to excite chlorophyll a. The fluorescent light emitted by the chlorophyll a passes through a red emission filter and is detected by a silicon photodiode. The low level signal is then processed using synchronous demodulation circuitry which generates an output voltage proportional to chlorophyll a concentration. The SCF may be operated with or without a pump.
Sensor specifications, current at August 2006, are given in the table below. More information can be found at the manufacturer's web site.
Sensor Specifications
| Power requirements | 8 - 20 VDC, 15 mA avg., 27 mA pk. |
|---|---|
| Output | 0 - 5.0 VDC |
| Output Time Constant | 0.1 sec. |
| Power-up transient period | < 1 sec. |
| Excitation Wavelength | 470 nm CWL, 30 nm FWHM |
| Emission Wavelength | 685 nm CWL, 30 nm FWHM |
| Sensing Volume | 340 mm3 |
| Minimum Detectable Level | 0.02 µg l-1 |
| Gain | Sensitivity, V µg-1 l-1 | Range, µg l-1 | |
|---|---|---|---|
| Sensitivity/Range | 30x 10x 3x 1x | 1.0 0.33 0.1 0.033 | 5 15 50 150 |
LI-COR LI-192 Underwater Quantum Sensor
The LI-192 Underwater Quantum Sensor is used to measure photosynthetic photon flux density and is cosine corrected. The sensor is often referred to as LI-192SA or LI-192SB (the LI-192SB model was superseded by LI-192SA). One of the main differences is that the LI-192SA model includes a built-in voltage output for interfacing with NexSens iSIC and SDL data loggers.
Sensor specifications, current at January 2012, are given in the table below. More information can be found in the manufacturer's LI-192SA andLI-192SB specification sheets.
Sensor Specifications
(Specifications apply to both models unless otherwise stated)
| Absolute Calibration | ± 5 % in air traceable to NBS. |
|---|---|
| Sensitivity | Typically 3 µA per 1000 µmol s-1 m-2 for LI-192SB and 4 µA per 1000 µmol s-1 m-2 for LI-192SA in water. |
| Linearity | Maximum deviation of 1 % up to 10,000 µmol s-1 m-2. |
| Stability | < ± 2 % change over a 1 year period. |
| Response Time | 10 µs. |
| Temperature Dependence | ± 0.15 % per °C maximum. |
| Cosine Correction | Optimized for both underwater and atmospheric use. |
| Azimuth | < ± 1 % error over 360 ° at 45 ° elevation. |
| Detector | High stability silicon photovoltaic detector (blue enhanced). |
| Sensor Housing | Corrosion resistant metal with acrylic diffuser for both saltwater and freshwater applications. Waterproof to withstand 800 psi (5500 kPa) (560 meters). |
Seapoint Turbidity Meter
The Seapoint Turbidity Meter detects light scattered by particles suspended in water, generating an output voltage proportional to turbidity or suspended solids. Range is selected by two digital lines which can be hard wired or microprocessor controlled, thereby choosing the appropriate range and resolution for measurement of extremely clean to very turbid waters. The offset voltage is within 1 mV of zero and requires no adjustment across gains. The optical design confines the sensing volume to within 5 cm of the sensor allowing near-bottom measurements and minimizing errant reflections in restricted spaces.
Sensor specifications, current at August 2006, are given in the table below.
Sensor Specifications
| Power requirements | 7 - 20 VDC, 3.5 mA avg., 6 mA pk. |
|---|---|
| Output | 0 - 5.0 VDC |
| Output Time Constant | 0.1 sec. |
| RMS Noise> | < 1 mV |
| Power-up transient period | < 1 sec. |
| Light Source Wavelength | 880 nm |
| Sensing Distance (from windows) | < 5 cm (approx.) |
| Linearity | < 2% deviation 0 - 750 FTU |
| Gain | Sensitivity (mV FTU-1) | Range (FTU) | |
|---|---|---|---|
| Sensitivity/Range | 100x 20x 5x 1x | 200 40 10 2 | 25 125 500 ** |
** output is non-linear above 750 FTU.
Further details can be found in the manufacturer's specification sheet.
Data processing by originator
Instruments and methods for all North Dogger SmartBuoy deployments are described by Greenwood et al. (2010). The near-surface rig on the SmartBuoy mooring was equipped with the following instruments:
| Instrument | Serial number | Depth | Parameters |
|---|---|---|---|
| Seapoint chlorophyll fluorometer | 2821 | 1 m | Chlorophyll fluorescence |
| LiCor PAR Sensor | 49 | 1 m | PAR |
| LiCor PAR Sensor | 17 | 2 m | PAR |
| FSI CT Module | 1991 | 1 m | Salinity, temperature |
| NAS-2E nutrient sensor | 1819 | 1 m | Total oxidised nitrogen |
| Seapoint optical back scatter meter | 10030 | 1 m | Suspended particulates |
| WMS-1 AquaMonitor | 2255 | 1 m | Samples for analysis ashore |
In situ measurements
In situ sensors were mounted at 1 m depth, or 1 m and 2 m for the PAR sensors. A solid state data logger (ESM-2) designed and built by Centre for Environment, Fisheries and Aquaculture Science (Cefas, UK) was used for data acquisition and sensor control. Measurements were recorded at a frequency of 1 Hz, with a burst frequency of two per hour, and a burst duration of between 5 and 10 minutes.
The in situ nitrogen and suspended particulates data were calibrated against coincidental discrete sample data. The in situ fluorometer and salinity measurements were bench calibrated.
Discrete sample collection and analysis
The SmartBuoy mooring was equipped with an Aquamonitor water sampling device, for automated collection of water samples during the course of the deployment. These samples were analysed ashore and used to calibrate the in situ sensor data. The nutrient data and suspended particulate concentrations from discrete sample analysis were merged into the mooring data set. Additional discrete samples for calibration were collected by CTD rosette sampler, during visits to the mooring. Data from CTD samples have not been merged into the mooring data set.
Suspended particulates analysis: Known volumes were passed through pre-weighed 0.4 µm polycarbonate filters and rinsed with 2 times 50 ml ultrapure water. The filters were then dried at room temperature in a desiccator, and weighed until the filter weight remained constant.
Nutrient analysis: Nutrient analysis was by the method described by Greenwood et al. (2011). A subsample was filtered under low vacuum through a GF/F filter (Whatman, UK), placed in a HDPE sample bottle, and preserved with mercuric chloride (final concentration, 0.02 g L-1). Samples were refrigerated until analysis for concentration of total oxidised nitrogen (nitrate + nitrite) and silicate using a Skalar SAN plus continuous flow analyser. Sample concentrations were compared to in-house standards prepared in natural seawater and commercial seawater standards. Quality of results is assured by participation in QUASIMEME.
References
Greenwood N., Parker E.R., Ferrnand L., Sivyer D.B., Weston K., Painting S.J., Kröger S., Forster R.M., Lees H.E., Mills D.K., Laane R.W.P.M., 2010. Detection of low bottom water oxygen concentrations in the North Sea; implications for monitoring and assessment of ecosystem health. Biogeosciences, 7, 1357-1373.
Greenwood N., Hydes D.J., Mahaffey C., Wither A., Jon Barry J., Sivyer D.B., Pearce D.J., Hartman S.E., Andres O., Lees H.E., 2011. Spatial and temporal variability in nutrient concentrations in Liverpool Bay, a temperate latitude region of freshwater influence. Ocean Dynamics, 61, 2181-2199.
Processing by BODC
The processed and quality-controlled data were supplied to BODC in a bulk, ASCII format file. Accompanying files provided instrument metadata. The data were converted into BODC's standard format, with one file for each rig deployment. The data were visually screened, taking into account comparisons between related parameters, and the environmental context. No major data issues were identified, but there may be some gaps in the data series, due to instrument failures.
EnviroTech Aqua Monitor automatic water sampler
Aqua Monitor is a water sampler for use in a variety of deployment scenarios. The device enables the collection of up to fifty discrete water samples for post recovery laboratory analysis. The instrument may be programmed for autonomous time series sampling or for operation in "slave" mode within an integrated system. Applications include sampling for nutrients, phytoplankton, salinity, suspended-load, tracers and contaminants.
More information can be found here.
Project Information
No Project Information held for the Series
Data Activity or Cruise Information
Data Activity
| Start Date (yyyy-mm-dd) | 2007-02-25 |
| End Date (yyyy-mm-dd) | 2007-04-23 |
| Organization Undertaking Activity | Centre for Environment, Fisheries and Aquaculture Science Lowestoft Laboratory |
| Country of Organization | United Kingdom |
| Originator's Data Activity Identifier | NDOGGER_FEB07_APR07 |
| Platform Category | subsurface mooring |
North Dogger SmartBuoy, February to April 2007
This SmartBuoy mooring was deployed by CEFAS north of Dogger Bank, 55° 40.27'N, 2° 17.88'E.
| Rig position: | 55° 40.27'N, 2° 17.88'E |
|---|---|
| Deployed: | 25th February 2007 from Cefas Endeavour cruise 3/07 |
| Recovered: | 23rd April 2007 from Cefas Endeavour cruise 8/07 |
Two sensor suites were deployed on the mooring, one near-surface and one at thermocline depth.
Instruments deployed on the mooring
| Depth | Instrument | Serial Number |
|---|---|---|
| 1 m | Seapoint chlorophyll fluorometer | 2821 |
| 1 m | LiCor PAR Sensor | 49 |
| 2 m | LiCor PAR Sensor | 17 |
| 1 m | FSI CT Module | 1991 |
| 1 m | NAS-2E nutrient sensor | 1819 |
| 1 m | Seapoint optical back scatter meter | 10030 |
| 1 m | WMS-1 AquaMonitor | 2255 |
| 25 m | Seapoint chlorophyll fluorometer | 2757 |
| 25 m | Aanderaa Optode | 219 |
| 25 m | LiCor PAR Sensor | 32 |
| 25 m | Aanderaa conductivity sensor | 173 |
| 25 m | Seapoint optical back scatter meter | 10480 |
Related Data Activity activities are detailed in Appendix 1
Cruise
| Cruise Name | 3/07 |
| Departure Date | 2007-02-21 |
| Arrival Date | 2007-02-27 |
| Principal Scientist(s) | Liam Fernand (Centre for Environment, Fisheries and Aquaculture Science Lowestoft Laboratory) |
| Ship | RV Cefas Endeavour |
Complete Cruise Metadata Report is available here
Fixed Station Information
Fixed Station Information
| Station Name | Cefas North Dogger |
| Category | Offshore location |
| Latitude | 55° 40.27' N |
| Longitude | 2° 17.88' E |
| Water depth below MSL | 80.0 m |
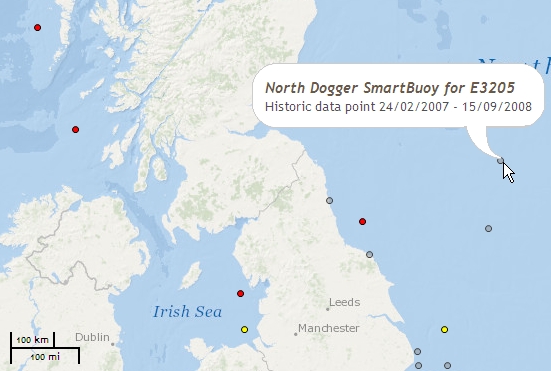
Cefas North Dogger SmartBuoy mooring site
Cefas maintained a SmartBuoy mooring site at the north of Dogger Bank, 55°40.27'N, 2°17.88'E, in approximately 80 m of water, from 24/02/2007 to 15/09/2008.
Normally two sensor suites were deployed on the mooring during each deployment: one near-surface (about 1 m); and one at thermocline depth (25 m or 31 m).
The near-surface frame was typically equipped as follows:
| Instrument | Description |
|---|---|
| NAS-3X in situ nutrient analyser | Hourly in situ measurements of nitrate/nitrate concentration |
| WMS-2 water sampler | Daily water samples for laboratory analysis of nutrient concentrations. |
| Fluorometer | 30-minute measurements of chlorophyll fluorescence. |
| PAR sensors | 30-minute measurements of Photosynthetically Active Radiation (PAR). Often sensors were mounted at two or three depths to give near-surface profiles indicating light attenuance. |
| Optical backscatter | 30-minute measurements of suspended particulate concentrations |
| Conductivity cell | 30-minute measurements of conductivity and salinity |
| Temperature probe | 30-minute measurements of water temperature |
The mid-tether frame was typically equipped as follows:
| Instrument | Description |
|---|---|
| Optode | In situ oxygen sensor. 30-minute measurements of oxygen concentration. |
| Fluorometer | 30-minute measurements of chlorophyll fluorescence. |
| PAR sensors | 30-minute measurements of Photosynthetically Active Radiation (PAR) at one depth |
| Optical backscatter | 30-minute measurements of suspended particulate concentrations |
| Conductivity cell | 30-minute measurements of conductivity and salinity |
| Temperature probe | 30-minute measurements of water temperature |
The SmartBuoy mooring was first deployed on Cefas Endeavour cruise 3/07. Data were relayed to shore every two hours. The mooring was deployed for several months at a time, after which it was serviced, sensors replaced or repositioned, samples recovered, and then it would be re-deployed. In total, there were seven individual deployments at the North Dogger site:
| Deployment | Recovery | Notes | ||
|---|---|---|---|---|
| Date | Cruise | Date | Cruise | |
| 25/02/2007 | 3/07 | 23/04/2007 | 8/07 | Sensors at 1 m and 25 m |
| 23/04/2007 | 8/07 | 21/05/2007 | 10/07 | Sensors at 1 m only |
| 21/05/2007 | 10/07 | 19/09/2007 | 17/07 | Sensors at 1 m and 31 m |
| 19/09/2007 | 17/07 | 31/10/2007 | 19/07 | Sensors at 1 m and 31 m |
| 31/10/2007 | 19/07 | 20/01/2008 | 1/08 | Sensors at 1 m and 31 m |
| 20/01/2008 | 1/08 | 28/04/2008 | 8/08 | Sensors at 1 m and 31 m |
| 28/04/2008 | 8/08 | 14/09/2008 | 16/08 | Sensors at 1 m and 31 m |
SmartBuoy deployments at the North Dogger site were funded by Marine Ecosystem Connections: essential indicators of healthy, productive and biologically diverse seas, a project funded by the UK Government's Department for Environment, Food and Rural Affairs (Defra project code ME3205).
Related Fixed Station activities are detailed in Appendix 2
BODC Quality Control Flags
The following single character qualifying flags may be associated with one or more individual parameters with a data cycle:
| Flag | Description |
|---|---|
| Blank | Unqualified |
| < | Below detection limit |
| > | In excess of quoted value |
| A | Taxonomic flag for affinis (aff.) |
| B | Beginning of CTD Down/Up Cast |
| C | Taxonomic flag for confer (cf.) |
| D | Thermometric depth |
| E | End of CTD Down/Up Cast |
| G | Non-taxonomic biological characteristic uncertainty |
| H | Extrapolated value |
| I | Taxonomic flag for single species (sp.) |
| K | Improbable value - unknown quality control source |
| L | Improbable value - originator's quality control |
| M | Improbable value - BODC quality control |
| N | Null value |
| O | Improbable value - user quality control |
| P | Trace/calm |
| Q | Indeterminate |
| R | Replacement value |
| S | Estimated value |
| T | Interpolated value |
| U | Uncalibrated |
| W | Control value |
| X | Excessive difference |
SeaDataNet Quality Control Flags
The following single character qualifying flags may be associated with one or more individual parameters with a data cycle:
| Flag | Description |
|---|---|
| 0 | no quality control |
| 1 | good value |
| 2 | probably good value |
| 3 | probably bad value |
| 4 | bad value |
| 5 | changed value |
| 6 | value below detection |
| 7 | value in excess |
| 8 | interpolated value |
| 9 | missing value |
| A | value phenomenon uncertain |
| B | nominal value |
| Q | value below limit of quantification |
Appendix 1: NDOGGER_FEB07_APR07
Related series for this Data Activity are presented in the table below. Further information can be found by following the appropriate links.
If you are interested in these series, please be aware we offer a multiple file download service. Should your credentials be insufficient for automatic download, the service also offers a referral to our Enquiries Officer who may be able to negotiate access.
| Series Identifier | Data Category | Start date/time | Start position | Cruise |
|---|---|---|---|---|
| 1167117 | Multiple data types -data buoy | 2007-02-25 16:00:00 | 55.68333 N, 2.28 E | RV Cefas Endeavour 3/07 |
Appendix 2: Cefas North Dogger
Related series for this Fixed Station are presented in the table below. Further information can be found by following the appropriate links.
If you are interested in these series, please be aware we offer a multiple file download service. Should your credentials be insufficient for automatic download, the service also offers a referral to our Enquiries Officer who may be able to negotiate access.
| Series Identifier | Data Category | Start date/time | Start position | Cruise |
|---|---|---|---|---|
| 1167117 | Multiple data types -data buoy | 2007-02-25 16:00:00 | 55.68333 N, 2.28 E | RV Cefas Endeavour 3/07 |
| 1167129 | Multiple data types -data buoy | 2007-04-23 16:00:00 | 55.68333 N, 2.28 E | RV Cefas Endeavour 8/07 |
| 1167246 | Multiple data types -data buoy | 2007-04-23 16:00:00 | 55.68333 N, 2.28 E | RV Cefas Endeavour 8/07 |
| 1167130 | Multiple data types -data buoy | 2007-05-21 13:00:00 | 55.68333 N, 2.28 E | RV Cefas Endeavour 10/07 |
| 1167142 | Multiple data types -data buoy | 2007-05-21 13:00:00 | 55.68333 N, 2.28 E | RV Cefas Endeavour 10/07 |
| 1167154 | Multiple data types -data buoy | 2007-09-19 18:30:00 | 55.68333 N, 2.28 E | RV Cefas Endeavour 17/07 |
| 1167166 | Multiple data types -data buoy | 2007-09-19 18:30:00 | 55.68333 N, 2.28 E | RV Cefas Endeavour 17/07 |
| 1167178 | Multiple data types -data buoy | 2007-10-31 15:00:00 | 55.68333 N, 2.28 E | RV Cefas Endeavour 19/07 |
| 1167191 | Multiple data types -data buoy | 2007-10-31 15:00:00 | 55.68333 N, 2.28 E | RV Cefas Endeavour 19/07 |
| 1167209 | Multiple data types -data buoy | 2008-01-20 14:00:00 | 55.68333 N, 2.28 E | RV Cefas Endeavour 1/08 |
| 1167210 | Multiple data types -data buoy | 2008-01-20 14:00:00 | 55.68333 N, 2.28 E | RV Cefas Endeavour 1/08 |
| 1167222 | Multiple data types -data buoy | 2008-04-28 12:30:00 | 55.68333 N, 2.28 E | RV Cefas Endeavour 8/08 |
| 1167234 | Multiple data types -data buoy | 2008-04-28 12:30:00 | 55.68333 N, 2.28 E | RV Cefas Endeavour 8/08 |
