Metadata Report for BODC Series Reference Number 1980767
Metadata Summary
Problem Reports
Data Access Policy
Narrative Documents
Project Information
Data Activity or Cruise Information
Fixed Station Information
BODC Quality Flags
SeaDataNet Quality Flags
Metadata Summary
Data Description |
|||||||||||||||||||||||||||||||||||||||||
|
|||||||||||||||||||||||||||||||||||||||||
Data Identifiers |
|||||||||||||||||||||||||||||||||||||||||
|
|||||||||||||||||||||||||||||||||||||||||
Time Co-ordinates(UT) |
|||||||||||||||||||||||||||||||||||||||||
|
|||||||||||||||||||||||||||||||||||||||||
Spatial Co-ordinates | |||||||||||||||||||||||||||||||||||||||||
|
|||||||||||||||||||||||||||||||||||||||||
Parameters |
|||||||||||||||||||||||||||||||||||||||||
|
|||||||||||||||||||||||||||||||||||||||||
Definition of BOTTFLAG | |||||||||||||||||||||||||||||||||||||||||
| BOTTFLAG | Definition |
|---|---|
| 0 | The sampling event occurred without any incident being reported to BODC. |
| 1 | The filter in an in-situ sampling pump physically ruptured during sample resulting in an unquantifiable loss of sampled material. |
| 2 | Analytical evidence (e.g. surface water salinity measured on a sample collected at depth) indicates that the water sample has been contaminated by water from depths other than the depths of sampling. |
| 3 | The feedback indicator on the deck unit reported that the bottle closure command had failed. General Oceanics deck units used on NERC vessels in the 80s and 90s were renowned for reporting misfires when the bottle had been closed. This flag is also suitable for when a trigger command is mistakenly sent to a bottle that has previously been fired. |
| 4 | During the sampling deployment the bottle was fired in an order other than incrementing rosette position. Indicative of the potential for errors in the assignment of bottle firing depth, especially with General Oceanics rosettes. |
| 5 | Water was reported to be escaping from the bottle as the rosette was being recovered. |
| 6 | The bottle seals were observed to be incorrectly seated and the bottle was only part full of water on recovery. |
| 7 | Either the bottle was found to contain no sample on recovery or there was no bottle fitted to the rosette position fired (but SBE35 record may exist). |
| 8 | There is reason to doubt the accuracy of the sampling depth associated with the sample. |
| 9 | The bottle air vent had not been closed prior to deployment giving rise to a risk of sample contamination through leakage. |
Definition of Rank |
|
|
Problem Reports
No Problem Report Found in the Database
Data Access Policy
Open Data
These data have no specific confidentiality restrictions for users. However, users must acknowledge data sources as it is not ethical to publish data without proper attribution. Any publication or other output resulting from usage of the data should include an acknowledgment.
If the Information Provider does not provide a specific attribution statement, or if you are using Information from several Information Providers and multiple attributions are not practical in your product or application, you may consider using the following:
"Contains public sector information licensed under the Open Government Licence v1.0."
Narrative Documents
Niskin Bottle
The Niskin bottle is a device used by oceanographers to collect subsurface seawater samples. It is a plastic bottle with caps and rubber seals at each end and is deployed with the caps held open, allowing free-flushing of the bottle as it moves through the water column.
Standard Niskin
The standard version of the bottle includes a plastic-coated metal spring or elastic cord running through the interior of the bottle that joins the two caps, and the caps are held open against the spring by plastic lanyards. When the bottle reaches the desired depth the lanyards are released by a pressure-actuated switch, command signal or messenger weight and the caps are forced shut and sealed, trapping the seawater sample.
Lever Action Niskin
The Lever Action Niskin Bottle differs from the standard version, in that the caps are held open during deployment by externally mounted stainless steel springs rather than an internal spring or cord. Lever Action Niskins are recommended for applications where a completely clear sample chamber is critical or for use in deep cold water.
Clean Sampling
A modified version of the standard Niskin bottle has been developed for clean sampling. This is teflon-coated and uses a latex cord to close the caps rather than a metal spring. The clean version of the Levered Action Niskin bottle is also teflon-coated and uses epoxy covered springs in place of the stainless steel springs. These bottles are specifically designed to minimise metal contamination when sampling trace metals.
Deployment
Bottles may be deployed singly clamped to a wire or in groups of up to 48 on a rosette. Standard bottles and Lever Action bottles have a capacity between 1.7 and 30 L. Reversing thermometers may be attached to a spring-loaded disk that rotates through 180° on bottle closure.
JR16006 CTD Bottle Particulate Organic Carbon and Nitrogen Samples
Originator's Protocol for Data Acquisition and Analysis
Particulate organic carbon (POC) and particulate organic nitrogen (PON) samples were taken from 17 stations along the Barents Sea Changing Arctic Ocean transect (B2 - B18) during cruise JR16006, between 8th July and 5 th August 2017. Bottle samples were taken using Niskin bottles on a 24 way rosette sampler attached to an SBE 911plus CTD unit. Samples to measure POC and PON were taken at six depths representing decreasing light (photosynthetically active radiation) levels. Water was collected from the Pelagic CTD from the same six bottles as those sampled for primary productivity. The water was pre-screened with a 200 µm mesh at the end of blacked out acid washed silicone tubing and collected into 10 litre acid washed carboys and stored in black bags either in the cold room or on deck in a low light area. Location of the collected water for storage until processing was dependent on the temperature of the surface water at the point of collection. 0.5 to 1 litre volumes were filtered through an ashed 25 mm GF/F filter using acid washed filtration units. The filters were removed using methanol dipped tweezers and transferred to a sterile micro-centrifuge tube. Samples were duplicated, bagged up for each station, and taken directly to the -20°C freezer. Upon the return of the James Clark Ross to port, POC and PON samples were shipped to The Scottish Association for Marine Science for analysis using a PDZ Europa 20-20 isotope ratio mass spectrometer.
Prior to analysis, the sample GF/F filters were dried in an oven at 60°C then fumed over concentrated hydrochloric acid for one hour to remove inorganic carbon, before packing in tin capsules. The dried tin capsule sample of POC + PON was combusted through a column of chromium oxide using helium as the carrier gas (60 ml/min) at 1000°C, where organic carbon is converted to CO2 and organic nitrogen to nitrogen oxides. A layer of silver wool removed any sulphur. The gases then pass through a reduction column of copper oxide at 600°C where excess oxygen is absorbed and nitrogen oxides are reduced to elemental nitrogen. Water is removed by a trap containing anhydrous magnesium perchlorate. A gas chromatograph further separates the components of interest, which then pass into a mass spectrometer where the isotope species are detected and the total content of nitrogen and carbon calculated. L-Isoleucine (cas no. 73-32-5) was used as the standard with a calibration range of 5 to 100 µg of nitrogen and 25 to 514 µg of carbon. For blank determination, three GF/F filters were processed the same as sample filters and analysed in the batch run. The average was subtracted from each of the sample results for blank correction.
For more information please see the cruise report.
BODC Data Processing Procedures
The POC and PON data were supplied to BODC in .xlsx format. Data were then loaded into BODC's database using established BODC data banking procedures.
The originator's variables were mapped to appropriate BODC parameter codes as follows:
| Originator's Variable | Originator's Units | BODC Parameter Code | BODC Standard Deviation Code | BODC Units | Comment |
|---|---|---|---|---|---|
| Average POC µg L-1 | µg L-1 | CORGCAP1 | SDCORGP1 | µmol L-1 | A conversion was applied based on ICES standards, from µg/l to µmol/l by dividing the values by the molecular weight of carbon (12.01078). |
| Average PON µg L-1 | µg L-1 | NTOTCAP1 | SDNTOTP1 | µmol L-1 | A conversion was applied based on ICES standards, from µg/l to µmol/l by dividing the values by the molecular weight of nitrogen (14.00672). |
The raw data in µg L -1 are available on request.
PDZ Europa 20-20 isotope ratio mass spectrometer
The 20-20 isotope mass spectrometer brochure was not available however, based on evidence from other websites and the 20-22 mass spectrometer brochure the key features are very similar and are as follows:
120° extended geometry with an 11 cm radius magnetic sector giving an effective 21 cm radius dispersion and double direction focusing. Additional high dispersion long spur with 98.8° sector which creates a distance of 24 cm between the focal points for m/z 2 and 3. This leads to an abundance sensitivity at m/z 3 of <1 ppm which eliminates helium tailing in to the D/H collector.
Truly universal Faraday triple collectors for simultaneous collection of adjacent masses in the range 28,29,30 - 64,65,66 with no adjustment of collectors or amplifiers. Additional single Faraday collector and high gain amplifier for m/z 3 on the hydrogen spur.
The desired combination of the 4 collectors is selected through the software. Software switchable variable gain amplifiers and 50v amplifier outputs are available as options.
Optional extended geometry system to incorporate up to 12 collectors for custom applications.
Asymmetric extended geometry to give true stigmatic focussing with twice the dispersion of normal geometry with the same radius sector.
Shorter path length than traditional extended geometry to decrease ion/molecule interactions and so ensure 100% transmission through the analyser and a sensitivity which is higher than any other commercial IRMS (<1000 molecules/ion for CO2).
Small analyser footprint and wide flat peak shape reduce the effect of temperature drift therefore removing the need for peak centring during analysis.
Design allows greater tolerance of the known variables of ion optics making the manufacture of the analyser more reproducible and less sensitive to magnet positioning.
True differential pumping by turbo-molecular pumps with a high compression ratio for both He and H2, to remove the detrimental effect of abundance sensitivity during continuous flow applications and eliminate memory.
With a mass range covering 2 to 96 AMU it is suitable for the analysis of light stable isotopes in all the commonly measured gases; H2, N2, NO, N2O, O2, CO, CO2, SO and SO2.
Triple port reference gas injection system. Suitable for calibrating each sample, using a reference gas instead of an internal standard and for easy tuning of the mass spectrometer. Size, type and positioning of reference gas pulses are under software control.
Data acquisition system uses state of the art highly stable and linear high frequency converters which produce integral slices with zero dead time and quantisation below the beam statistical noise floor at all signal levels.
The 20-22 isotope ratio mass spectrometer brochure may provide more information.
Project Information
Changing Arctic Ocean: Implications for marine biology and biogeochemistry
Changing Arctic Ocean (CAO) is a £16 million, five year (2017-2022) research programme initially funded by the Natural Environment Research Council (NERC). The aim of the CAO programme is to understand how change in the physical environment (ice and ocean) will affect the large-scale ecosystem structure and biogeochemical functioning of the Arctic Ocean, the potential major impacts and provide projections for future ecosystem services. In July 2018, additional projects were added to the programme that were jointly funded by NERC and the German Federal Ministry of Education and Research.
Background
The Arctic Ocean is responding to global climate change in ways that are not yet fully understood and in some cases, not yet identified. The impacts of change in the Arctic are global in range and international in importance. To achieve the aim, the programme has two key research challenges:
- To develop quantified understanding of the structure and functioning of Arctic ecosystems.
- To understand the sensitivity of Arctic ecosystem structure, functioning and services to multiple stressors and the development of projections of the impacts of change.
The decision to fund the CAO project was both scientific and political and is the second largest research programme funded by NERC.
The programme involves 33 organisations, the majority of which are research institutions in the UK and Germany, and over 170 scientists. The programme consists of four large projects with an additional 12 research projects added in July 2018.
Further information can be found on the Changing Arctic Ocean website.
Participants
There are 33 organisations involved in the Changing Arctic Ocean project, these are:
- Alfred Wegener Institut (AWI)
- Bangor University
- British Antarctic Survey (BAS)
- Centre for Environment, Fisheries and Aquaculture Science (CEFAS)
- Durham University
- GEOMAR
- Helmholtz-Zentrum Geesthacht Centre for Materials and Coastal Research
- Lancaster University
- Marine Biological Association (MBA)
- Max Planck Institute for the Science of Human History
- National Oceanography Centre (NOC)
- Newcastle University
- Northumbria University
- Ocean Atmosphere Systems GmbH
- Plymouth Marine Laboratory (PML)
- Scottish Association for Marine Science (SAMS)
- Scottish Universities Environmental Research Centre (SUERC)
- Université Libre de Bruxelles
- University College London (UCL)
- University of Bristol
- University of East Anglia (UEA)
- University of Edinburgh
- University of Glasgow
- University of Huddersfield
- University of Leeds
- University of Liverpool
- University of Manchester
- University of Oldenburg
- University of Oxford
- University of Southampton
- University of St Andrews
- University of Stirling
- University of Strathclyde
In addition to the core organisation, there are a number of international collaborators.
Research Details
The four large projects funded by NERC are:
- Arctic Productivity in the seasonal Ice Zone (Arctic PRIZE)
- Can we detect changes in Arctic ecosystems? (ARISE)
- The Changing Arctic Ocean Seafloor (ChAOS) - How changing sea ice conditions impact biological communities, biogeochemical processes and ecosystems
- Mechanistic understanding of the role of diatoms in the success of the Arctic Calanus complex and implications for a warmer Arctic (DIAPOD)
The additional 12 projects added in July 2018 funded jointly by NERC and the German Federal Ministry of Education and Research are:
- Advective Pathways of nutrients and key Ecological substances in the Arctic (APEAR)
- How will changing freshwater export and terrestrial permafrost thaw influence the Arctic Ocean? (CACOON)
- Chronobiology of changing Arctic Sea Ecosystems (CHASE)
- Potential benefits and risks of borealisation for fish stocks and ecosystems in a changing Arctic Ocean (Coldfish)
- Diatom Autecological Responses with Changes To Ice Cover (Diatom-ARCTIC)
- Ecosystem functions controlled by sea ice and light in a changing Arctic (Eco-Light)
- Effects of ice stressors and pollutants on the Arctic marine cryosphere (EISPAC)
- Linking Oceanography and Multi-specific, spatially-Variable Interactions of seabirds and their prey in the Arctic (LOMVIA)
- Understanding the links between pelagic microbial ecosystems and organic matter cycling in the changing Arctic (Micro-ARC)
- Microbes to Megafauna Modelling of Arctic Seas (MiMeMo)
- Primary productivity driven by escalating Arctic nutrient fluxes? (PEANUTS)
- Pathways and emissions of climate-relevant trace gases in a changing Arctic Ocean (PETRA)
Fieldwork and Data Collection
The programme consists of seven core cruises that survey areas in the Barents Sea and the Fram Strait on board the NERC research vessel RRS James Clark Ross. Measurements will include temperature, salinity, dissolved oxygen, dissolved inorganic carbon, total alkalinity, inorganic nutrients, oxygen and carbon isotopes and underway meteorological and surface ocean observations. In addition to ship based cruise datasets gliders, moorings and animal tags are part of the fieldwork. Further data are collected from model runs.
Data Activity or Cruise Information
Data Activity
| Start Date (yyyy-mm-dd) | 2017-07-30 |
| End Date (yyyy-mm-dd) | 2017-07-30 |
| Organization Undertaking Activity | National Oceanography Centre, Liverpool |
| Country of Organization | United Kingdom |
| Originator's Data Activity Identifier | JR16006_CTD_CTD038 |
| Platform Category | lowered unmanned submersible |
BODC Sample Metadata Report for JR16006_CTD_CTD038
| Sample reference number | Nominal collection volume(l) | Bottle rosette position | Bottle firing sequence number | Minimum pressure sampled (dbar) | Maximum pressure sampled (dbar) | Depth of sampling point (m) | Bottle type | Sample quality flag | Bottle reference | Comments |
|---|---|---|---|---|---|---|---|---|---|---|
| 1256105 | 20.00 | 1 | 1 | 278.00 | Niskin bottle | No problem reported | ||||
| 1256108 | 20.00 | 2 | 2 | 278.00 | Niskin bottle | No problem reported | ||||
| 1256111 | 20.00 | 3 | 3 | 267.80 | Niskin bottle | No problem reported | ||||
| 1256114 | 20.00 | 4 | 4 | 267.80 | Niskin bottle | No problem reported | ||||
| 1256117 | 20.00 | 5 | 5 | 199.30 | Niskin bottle | No problem reported | ||||
| 1256120 | 20.00 | 6 | 6 | 179.00 | Niskin bottle | No problem reported | ||||
| 1256123 | 20.00 | 7 | 7 | 118.90 | Niskin bottle | No problem reported | ||||
| 1256126 | 20.00 | 8 | 8 | 119.00 | Niskin bottle | No problem reported | ||||
| 1256129 | 20.00 | 9 | 9 | 74.10 | Niskin bottle | No problem reported | ||||
| 1256132 | 20.00 | 10 | 10 | 59.60 | Niskin bottle | No problem reported | ||||
| 1256135 | 20.00 | 11 | 11 | 47.60 | Niskin bottle | No problem reported | ||||
| 1256138 | 20.00 | 12 | 12 | 47.60 | Niskin bottle | No problem reported | ||||
| 1256141 | 20.00 | 13 | 13 | 47.60 | Niskin bottle | No problem reported | ||||
| 1256144 | 20.00 | 14 | 14 | 39.00 | Niskin bottle | No problem reported | ||||
| 1256147 | 20.00 | 15 | 15 | 39.00 | Niskin bottle | No problem reported | ||||
| 1256150 | 20.00 | 16 | 16 | 34.40 | Niskin bottle | No problem reported | ||||
| 1256153 | 20.00 | 17 | 17 | 34.40 | Niskin bottle | No problem reported | ||||
| 1256156 | 20.00 | 18 | 18 | 21.10 | Niskin bottle | No problem reported | ||||
| 1256159 | 20.00 | 19 | 19 | 21.10 | Niskin bottle | No problem reported | ||||
| 1256162 | 20.00 | 20 | 20 | 15.40 | Niskin bottle | No problem reported | ||||
| 1256165 | 20.00 | 21 | 21 | 5.00 | Niskin bottle | No problem reported | ||||
| 1256168 | 20.00 | 22 | 22 | 2.20 | Niskin bottle | No problem reported | ||||
| 1256171 | 20.00 | 23 | 23 | 2.20 | Niskin bottle | No problem reported | ||||
| 1256174 | 20.00 | 24 | 24 | 2.20 | Niskin bottle | No problem reported |
Please note:the supplied parameters may not have been sampled from all the bottle firings described in the table above. Cross-match the Sample Reference Number above against the SAMPRFNM value in the data file to identify the relevant metadata.
Related Data Activity activities are detailed in Appendix 1
Cruise
| Cruise Name | JR16006 |
| Departure Date | 2017-06-30 |
| Arrival Date | 2017-08-15 |
| Principal Scientist(s) | Jo Hopkins (National Oceanography Centre, Liverpool) |
| Ship | RRS James Clark Ross |
Complete Cruise Metadata Report is available here
Fixed Station Information
Fixed Station Information
| Station Name | CAO-B14 |
| Category | Offshore location |
| Latitude | 76° 30.00' N |
| Longitude | 30° 30.00' E |
| Water depth below MSL | 294.0 m |
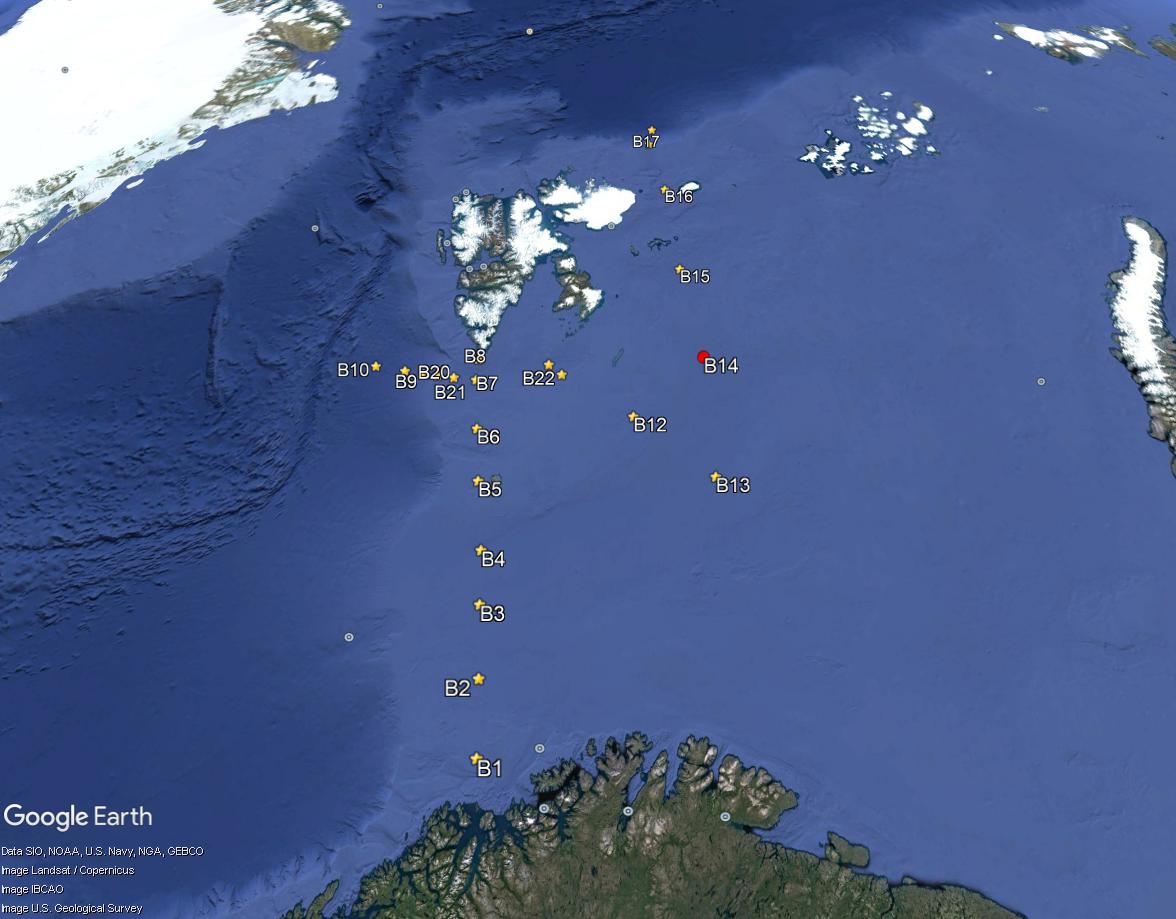
Changing Arctic Ocean Fixed Station B14
This station is one of several sites sampled on the Barents Sea as part of the Changing Arctic Ocean programme. The station has a mean water depth 294 m at the following co-ordinates:
| Latitude | Longitude |
|---|---|
| 76.5° N | 30.5° E |
The position of this station relative to the other Changing Arctic Ocean sites can be seen from the figure below (in red).
Sampling History
| JR16006 | JR17007 | |
|---|---|---|
| CTD casts | 2 | 1 |
| Box cores | 17 | 23 |
| Multi-core | 4 | 3 |
| Net trawls | 8 | |
| Shallow Underwater Camera System (SUCS) | 1 | |
| Stand Alone Pump Systems (SAPS) | 1 | |
| Zooplankton net hauls | 4 | |
| Epibenthic Sledge (apparatus towed over the seabed to collect zoobenthos) | 8 |
Related Fixed Station activities are detailed in Appendix 2
BODC Quality Control Flags
The following single character qualifying flags may be associated with one or more individual parameters with a data cycle:
| Flag | Description |
|---|---|
| Blank | Unqualified |
| < | Below detection limit |
| > | In excess of quoted value |
| A | Taxonomic flag for affinis (aff.) |
| B | Beginning of CTD Down/Up Cast |
| C | Taxonomic flag for confer (cf.) |
| D | Thermometric depth |
| E | End of CTD Down/Up Cast |
| G | Non-taxonomic biological characteristic uncertainty |
| H | Extrapolated value |
| I | Taxonomic flag for single species (sp.) |
| K | Improbable value - unknown quality control source |
| L | Improbable value - originator's quality control |
| M | Improbable value - BODC quality control |
| N | Null value |
| O | Improbable value - user quality control |
| P | Trace/calm |
| Q | Indeterminate |
| R | Replacement value |
| S | Estimated value |
| T | Interpolated value |
| U | Uncalibrated |
| W | Control value |
| X | Excessive difference |
SeaDataNet Quality Control Flags
The following single character qualifying flags may be associated with one or more individual parameters with a data cycle:
| Flag | Description |
|---|---|
| 0 | no quality control |
| 1 | good value |
| 2 | probably good value |
| 3 | probably bad value |
| 4 | bad value |
| 5 | changed value |
| 6 | value below detection |
| 7 | value in excess |
| 8 | interpolated value |
| 9 | missing value |
| A | value phenomenon uncertain |
| B | nominal value |
| Q | value below limit of quantification |
Appendix 1: JR16006_CTD_CTD038
Related series for this Data Activity are presented in the table below. Further information can be found by following the appropriate links.
If you are interested in these series, please be aware we offer a multiple file download service. Should your credentials be insufficient for automatic download, the service also offers a referral to our Enquiries Officer who may be able to negotiate access.
| Series Identifier | Data Category | Start date/time | Start position | Cruise |
|---|---|---|---|---|
| 1980940 | Water sample data | 2017-07-30 09:15:00 | 76.49941 N, 30.28704 E | RRS James Clark Ross JR16006 |
| 1981722 | Water sample data | 2017-07-30 09:15:00 | 76.49941 N, 30.28704 E | RRS James Clark Ross JR16006 |
| 2043277 | Water sample data | 2017-07-30 09:15:00 | 76.49941 N, 30.28704 E | RRS James Clark Ross JR16006 |
| 2052256 | Water sample data | 2017-07-30 09:15:00 | 76.49941 N, 30.28704 E | RRS James Clark Ross JR16006 |
| 2056294 | Water sample data | 2017-07-30 09:15:00 | 76.49941 N, 30.28704 E | RRS James Clark Ross JR16006 |
| 2056534 | Water sample data | 2017-07-30 09:15:00 | 76.49941 N, 30.28704 E | RRS James Clark Ross JR16006 |
Appendix 2: CAO-B14
Related series for this Fixed Station are presented in the table below. Further information can be found by following the appropriate links.
If you are interested in these series, please be aware we offer a multiple file download service. Should your credentials be insufficient for automatic download, the service also offers a referral to our Enquiries Officer who may be able to negotiate access.
| Series Identifier | Data Category | Start date/time | Start position | Cruise |
|---|---|---|---|---|
| 1837965 | CTD or STD cast | 2017-07-30 09:00:00 | 76.4994 N, 30.287 E | RRS James Clark Ross JR16006 |
| 1980940 | Water sample data | 2017-07-30 09:15:00 | 76.49941 N, 30.28704 E | RRS James Clark Ross JR16006 |
| 1981722 | Water sample data | 2017-07-30 09:15:00 | 76.49941 N, 30.28704 E | RRS James Clark Ross JR16006 |
| 2043277 | Water sample data | 2017-07-30 09:15:00 | 76.49941 N, 30.28704 E | RRS James Clark Ross JR16006 |
| 2052256 | Water sample data | 2017-07-30 09:15:00 | 76.49941 N, 30.28704 E | RRS James Clark Ross JR16006 |
| 2056294 | Water sample data | 2017-07-30 09:15:00 | 76.49941 N, 30.28704 E | RRS James Clark Ross JR16006 |
| 2056534 | Water sample data | 2017-07-30 09:15:00 | 76.49941 N, 30.28704 E | RRS James Clark Ross JR16006 |
| 1837977 | CTD or STD cast | 2017-07-31 11:04:00 | 76.4462 N, 29.3272 E | RRS James Clark Ross JR16006 |
| 1965906 | Water sample data | 2018-06-29 08:29:00 | 76.50003 N, 29.99997 E | RRS James Clark Ross JR17006 |
| 1980583 | Water sample data | 2018-06-29 08:29:00 | 76.50003 N, 29.99997 E | RRS James Clark Ross JR17006 |
| 2042815 | Water sample data | 2018-06-29 08:29:00 | 76.50003 N, 29.99997 E | RRS James Clark Ross JR17006 |
| 2081826 | Water sample data | 2018-06-29 08:29:00 | 76.50003 N, 29.99997 E | RRS James Clark Ross JR17006 |
| 1926711 | CTD or STD cast | 2018-07-25 01:54:10 | 76.5 N, 30.5003 E | RRS James Clark Ross JR17007 |
| 1965390 | Water sample data | 2018-07-25 02:12:00 | 76.50003 N, 30.50026 E | RRS James Clark Ross JR17007 |
| 1966006 | Water sample data | 2018-07-25 02:12:00 | 76.50003 N, 30.50026 E | RRS James Clark Ross JR17007 |
| 2143358 | Water sample data | 2018-07-25 02:12:00 | 76.50003 N, 30.50026 E | RRS James Clark Ross JR17007 |
| 2022666 | CTD or STD cast | 2019-07-12 17:49:01 | 76.4959 N, 30.5002 E | RRS James Clark Ross JR18006 |
| 2022678 | CTD or STD cast | 2019-07-12 23:18:27 | 76.5066 N, 30.5016 E | RRS James Clark Ross JR18006 |
| 2001902 | Water sample data | 2019-07-12 23:36:00 | 76.50658 N, 30.50156 E | RRS James Clark Ross JR18006 |
| 2014630 | Water sample data | 2019-07-12 23:36:25 | 76.50658 N, 30.50156 E | RRS James Clark Ross JR18006 |
| 2022691 | CTD or STD cast | 2019-07-13 01:19:08 | 76.5066 N, 30.5016 E | RRS James Clark Ross JR18006 |
| 2053038 | Water sample data | 2019-07-13 01:38:05 | 76.50656 N, 30.5015 E | RRS James Clark Ross JR18006 |
