Metadata Report for BODC Series Reference Number 2023031
Metadata Summary
Problem Reports
Data Access Policy
Narrative Documents
Project Information
Data Activity or Cruise Information
Fixed Station Information
BODC Quality Flags
SeaDataNet Quality Flags
Metadata Summary
Data Description |
|||||||||||||||||||||||||||||||||||||||||||||||||||||||||||||||||||||||||||||||||||||
|
|||||||||||||||||||||||||||||||||||||||||||||||||||||||||||||||||||||||||||||||||||||
Data Identifiers |
|||||||||||||||||||||||||||||||||||||||||||||||||||||||||||||||||||||||||||||||||||||
|
|||||||||||||||||||||||||||||||||||||||||||||||||||||||||||||||||||||||||||||||||||||
Time Co-ordinates(UT) |
|||||||||||||||||||||||||||||||||||||||||||||||||||||||||||||||||||||||||||||||||||||
|
|||||||||||||||||||||||||||||||||||||||||||||||||||||||||||||||||||||||||||||||||||||
Spatial Co-ordinates | |||||||||||||||||||||||||||||||||||||||||||||||||||||||||||||||||||||||||||||||||||||
|
|||||||||||||||||||||||||||||||||||||||||||||||||||||||||||||||||||||||||||||||||||||
Parameters |
|||||||||||||||||||||||||||||||||||||||||||||||||||||||||||||||||||||||||||||||||||||
|
|||||||||||||||||||||||||||||||||||||||||||||||||||||||||||||||||||||||||||||||||||||
|
|||||||||||||||||||||||||||||||||||||||||||||||||||||||||||||||||||||||||||||||||||||
Problem Reports
A significant offset (<5% at daily maxima) was observed between port and starboard sensor pairs. There was an 18 month difference between the re-calibration of the sensors. The starboard sensor was considered accurate as it was calibrated on the 03/09/2019 and was first installed on the 14/01/2020 prior to the start of the cruise. (BODC assessment).
RRS Discovery cruise DY112 meteorology quality control report
True wind
Minor wind shielding and entrapment observed and flagged. (BODC assessment)
Data Access Policy
Open Data
These data have no specific confidentiality restrictions for users. However, users must acknowledge data sources as it is not ethical to publish data without proper attribution. Any publication or other output resulting from usage of the data should include an acknowledgment.
If the Information Provider does not provide a specific attribution statement, or if you are using Information from several Information Providers and multiple attributions are not practical in your product or application, you may consider using the following:
"Contains public sector information licensed under the Open Government Licence v1.0."
Narrative Documents
Gill Instruments Windsonic Anemometer
The Gill Windsonic is a 2-axis ultrasonic wind sensor that monitors wind speed and direction using four transducers. The time taken for an ultrasonic pulse to travel from the North to the South transducers is measured and compared with the time for a pulse to travel from South to North. Travel times between the East and West transducers are similarly compared. The wind speed and direction are calculated from the differences in the times of flight along each axis. This calculation is independent of environmental factors such as temperature.
Specifications
| Ultrasonic output rate | 0.25, 0.5, 1, 2 or 4 Hz |
| Operating Temperature | -35 to 70°C |
| Operating Humidity | < 5 to 100% RH |
| Anemometer start up time | < 5 s |
| Wind speed | |
| Range | 0 to 60 m s-1 |
| Accuracy | ± 2% at 2 m s-1 |
| Resolution | 0.01 m s-1 |
| Response time | 0.25 s |
| Threshold | 0.01 m s-1 |
| Wind direction | |
| Range | 0 to 359° |
| Accuracy | ± 3° at 12 m s-1 |
| Resolution | 1° |
| Response time | 0.25 s |
Further details can be found in the manufacturer's specification sheet.
Kipp and Zonen Pyranometer Model CM6B
The CM6B pyranometer is intended for routine global solar radiation measurement research on a level surface. The CM6B features a sixty-four thermocouple junction (series connected) sensing element. The sensing element is coated with a highly stable carbon based non-organic coating, which delivers excellent spectral absorption and long term stability characteristics. The sensing element is housed under two concentric fitting Schott K5 glass domes.
Specifications
| Dimensions (W x H) | 150.0 mm x 91.5 mm |
|---|---|
| Weight | 850 grams |
| Operating Temperature | -40°C to +80°C |
| Spectral Range | 305 - 2800 nm (50% points) |
| Sensitivity | 9 -15 µV/W/m2 |
| Impedance (nominal) | 70 - 100 ohm |
| Response Time (95%) | 30 sec |
| Non-linearity | < ± 1.2% (<1000 W/m2) |
| Temperature dependence of sensitivity | < ± 2% (-10 to +40°C) |
| Zero-offset due to temperature changes | < ± 4 W/m2 at 5 K/h temperature change |
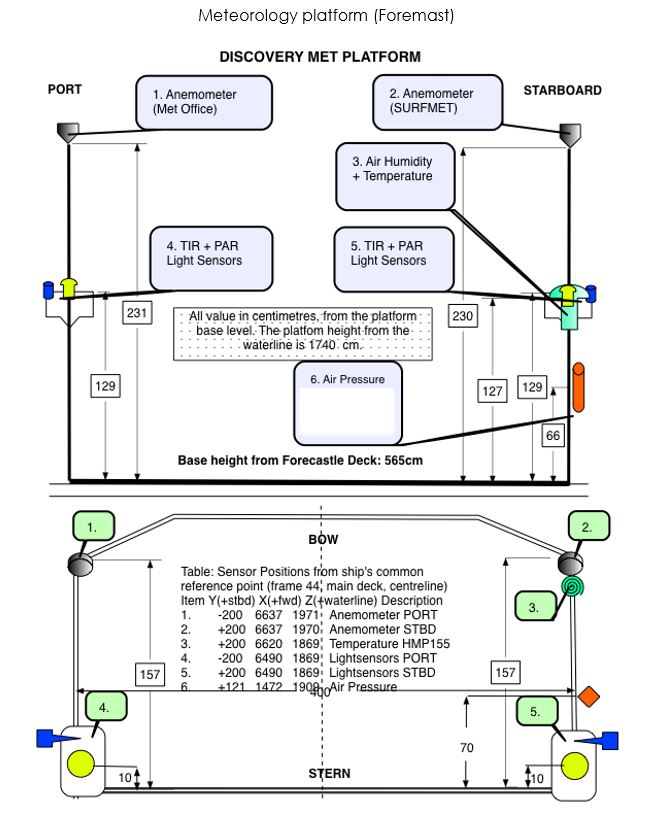
RRS Discovery cruise DY112 meteorology instrumentation
Instrumentation
The meteorological suite of sensors was located on the forecastle deck, at approximately 17.4 m above sea level. The anemometer orientation was 0° on the bow.
| Make/model | Serial number | Last calibration date | Orientation | Status | Comments |
|---|---|---|---|---|---|
| Skye PAR SKE510 | 28563 | 03-Sep-2019 | Starboard | ||
| Skye PAR SKE510 | 48927 | 30-Jan-2018 | Port | ||
| Kipp and Zonen TIR CM6B | 994132 | 18-Oct-2018 | Starboard | ||
| Kipp and Zonen TIR CM6B | 973134 | 06-Jun-2019 | Port | ||
| Gill Windsonic option 3 | 10280018 | 0 degrees on bow | No calibration required | ||
| Vaisala HMP155 | K0950057 | 15-Aug-2019 | No calibration required | ||
| Vaisala PTB210 | P1640265 | 14-Aug-2019 | No calibration required |
|
The NMF Surfmet system was run throughout the cruise, excepting times for cleaning, entering and leaving port and whilst alongside.
Skye Instruments PAR Energy Sensor Model SKE 510
The SKE 510 is suitable for measuring photosynthetically active radiation (PAR) from natural or artificial light sources. The sensor is fully waterproof and guaranteed submersible to 4m depth, and indoor versions are also available.
The instrument uses a blue-enhanced planar diffused silicon detector to measure energy (in W m-2) over the 400-700 nm waveband. It has a cosine-corrected head and a square spectral response. The sensor can operate over a temperature range of -35 to 70 °C and a humidity range of 0-100% RH.
Specifications
| Sensitivity (current) | 1.5µA or 100 W m-2 |
|---|---|
| Sensitivity (voltage) | 1mV or 100 W m-2 |
| Working Range | 0-5000 W m-2 |
| Linearity error | 0.2% |
| Absolute calibration error | typ. less than 3% 5% max |
| Response time - voltage output | 10 ns |
| Cosine error | 3% |
| Azimuth error | less than 1% |
| Temperature co-efficient | ±0.1% per °C |
| Internal resistance - voltage output | c. 300 ohms |
| Longterm stability | ±2% |
| Material | Dupont 'Delrin' |
| Dimensions | 34 mm diameter 38mm height |
| Cable | 2 core screened 7 - 2 - 2C |
| Sensor Passband | 400 - 700 nm |
| Detector | Silicon photocell |
| Filters | Glass type and/or metal interference |
Vaisala PTB210 Digital Barometer
The basic specifications for this pressure sensor are as follows:
- Manufacturer: Vaisala
- Type: Silicon capacitive sensor
- Model: PTB210
- Range: 900 - 1100 hPa
- Output: 0-5VDC
- Total Accuracy (20°C): ±0.30hPa
- Operating temperature: -40 to +60 deg C
- Weight: 110g
- Certification Ingress Protection: IP65
Further details can be found in the manufacturer's specification sheet.
Vaisala Temperature and Relative Humidity HMP Sensors
A family of sensors and instruments (sensors plus integral displays or loggers) for the measurement of air temperature and relative humidity. All are based on a probe containing a patent (HUMICAP) capacitive thin polymer film capacitanece humidity sensor and a Pt100 platinum resistance thermometer. The probes are available with a wide range of packaging, cabling and interface options all of which have designations of the form HMPnn or HMPnnn such as HMP45 and HMP230. Vaisala sensors are incorporated into weather stations and marketed by Campbell Scientific.
All versions operate at up to 100% humidity. Operating temperature ranges vary between models, allowing users to select the version best suited to their requirements.
Further details can be found in the manufacturer's specification sheets for the HMP 45 series, HMP 70 series and HMP 230 series.
RRS Discovery cruise DY112 meteorology data processing procedures
Originator's Data Processing
The data were logged by the TECHSAS (TECHnical and Scientific sensors Acquisition System) system into daily NetCDF files. The TECHSAS system is used as the main data logging system on NMF-SS operated reserach vessels. The daily TECHSAS NetCDF files provided to BODC were used for BODC processing. Data were additionally logged into the RVS Level-C format files which have been archived at BODC.
Files delivered to BODC
| Filename | Function | Format | Resolution | Start time | End time | Comments |
|---|---|---|---|---|---|---|
| *-Light-*-SM_*.SURFMETv3 | PAR, TIR, air pressure | TECHSAS | 1 Hz | 14-Jan-2020 14:59:33 | 24-Jan-2020 22:01:32 | |
| *-MET-*-SM_*.SURFMETv3 | Wind, air temp, humidity | TECHSAS | 1 Hz | 14-Jan-2020 14:59:33 | 24-Jan-2020 22:01:32 |
BODC Data Processing
The data were reformatted to BODC internal format using standard banking procedures. Data were averaged at 60 second intervals. The following table shows how variables within the file were mapped to appropriate BODC parameter codes:
| Source file | Originator's variable | Units | Description | BODC code | BODC unit | Converion | Comments |
|---|---|---|---|---|---|---|---|
| *-MET-*-SM_*.SURFMETv3 | speed | m/s | Relative wind speed | ERWSSS01 | m/s | ||
| *-MET-*-SM_*.SURFMETv3 | direct | degrees | Relative wind direction | ERWDSS01 | degrees | ||
| *-MET-*-SM_*.SURFMETv3 | airtemp | deg C | Air temperature | CDTAZZ01 | deg C | ||
| *-MET-*-SM_*.SURFMETv3 | humid | % | Relative humidity | CRELZZ01 | % | ||
| *-Light-*-SM_*.SURFMETv3 | pres | hPa | Air pressure | CAPHTU01 | mbar | 1 hPa = 1 mbar | |
| *-Light-*-SM_*.SURFMETv3 | ppar | V x 105 | Raw PAR (port) | DVLtrPSD | V | * 0.00001 | |
| *-Light-*-SM_*.SURFMETv3 | spar | V x 105 | Raw PAR (starboard) | DVLtrSSD | V | * 0.00001 | |
| *-Light-*-SM_*.SURFMETv3 | ptir | V x 105 | Raw TIR (port) | CVLtrP01 | V | * 0.00001 | |
| *-Light-*-SM_*.SURFMETv3 | stir | V x 105 | Raw TIR (starboard) | CVLtrS01 | V | * 0.00001 | |
| True wind speed | EWSBSS01 | m/s | Derived at BODC | ||||
| True wind direction | EWDASS01 | Degrees True | Derived at BODC | ||||
| PAR (port) | DWIRRPSD | W/m-2 | Derived at BODC | ||||
| PAR (starboard) | DWIRRSSD | W/m-2 | Derived at BODC | ||||
| TIR (port) | CSLRRP01 | W/m-2 | Derived at BODC | ||||
| TIR (starboard) | CSLRRS01 | W/m-2 | Derived at BODC |
All data expressed at measurement altitude.
Manufacturers Calibrations
PAR/TIR
The following manufacturer's calibrations were applied to the PAR and TIR light sensors using:
y (W m -2 ) = (a x 10 6 )/b
where 'a' is the raw data in volts and 'b' is the calibration offset (µV per W m -2 ) as shown below.
| Sensor | Serial no | location | offset (µV per W m -2 ) |
| PAR | 48927 | Port | 10 |
| PAR | 28563 | Starboard | 9.398 |
| TIR | 994132 | Starboard | 11.35 |
| TIR | 973134 | Port | 11 |
Processing
All the reformatted data were visualised using the in-house EDSERPLO software. Suspect data were marked by adding an appropriate quality control flag.
Absolute wind speed and direction
Relative wind speed and direction were corrected to absolute winds using the ship's heading, speed over ground, course over ground and anemometer orientation on the bow in line with theSAMOS method.
Air pressure
A manufacturer's calibration was not applied to the barometer because there was no significant offset reported on the certified calibration certificate.
Air temperature and humidity
Manufacturer's calibrations were not applied to the temperature and humidity probe because there were no significant offsets reported on the certified calibration certificate.
Field Calibrations
No field calibrations were applied to the data at BODC.
Project Information
Carbon Uptake and Seasonal Traits of Antarctic Remineralisation Depth (CUSTARD)
Carbon Uptake and Seasonal Traits of Antarctic Remineralisation Depth (CUSTARD) is a £1.8 million, four-year (2018-2022) research project funded by the Natural Environment Research Council (NERC).
The main aim of the CUSTARD project is to quantify the seasonal drivers of carbon fluxes in a region of the Southern Ocean upper limb, and estimate how long different quantities of carbon are kept out of the atmosphere based on the water flow routes at the observed remineralisation depths. Please visit the CUSTARD web page for more information
CUSTARD is one of three projects funded as part of the Role of the Southern Ocean in the Earth System (RoSES) programme, also known as the Southern Ocean programme. Please see the RoSES project document for more information on the wider programme and the research projects associated with it.
Background
The upper limb of the Antarctic Circumpolar Current (ACC) represents an important junction in the marine carbon cycle, as the fate of carbon fixed by surface phytoplankton will differ according to how deep it penetrates before being remineralised. If shallow remineralisation occurs, carbon will follow the upper limb circulation and upwell further north, escaping into the atmosphere within decades. On the other hand, deep remineralisation will result in carbon entering the lower limb circulation, with the potential of being retained in the ocean for hundreds of years. Seasonality in plankton dynamics play an important role in remineralisation depth, and CUSTARD aims to resolve all factors contributing to the carbon export out of the region.
Participants
Six different UK-based organisations are directly involved in research for CUSTARD:
- National Oceanography Centre (NOC)
- NERC British Antarctic Survey (BAS)
- University of Southampton
- University of Oxford
- Plymouth University
- University of East Anglia (UEA)
CUSTARD collaborates closely with the US Ocean Observatories Initiative (OOI) program through sharing of instruments and platforms at and around the Global Southern Ocean Array. OOI is funded by the National Science Foundation (NSF) and is managed by the Woods Hole Oceanographic Institution. Rutgers University maintains the cyberinfrastructure component, working alongside CUSTARD scientists in the handling and distribution of shared observational data.
Research details
Four Work Packages have been funded by the CUSTARD project, each addressing a separate project objective within the region of study in the south eastern Pacific ocean. These are described briefly below:
-
Work Package 1: Obtain an accurate picture of the seasonal air-sea flux and macronutrient drawdown.
This work package aims at determining the magnitude and variability of air-sea CO2 fluxes and their physical and biogeochemical drivers. High-resolution carbon measurements in the water column, CO2 flux estimates and daily resolved nitrate and silicate observations are combined to better understand the link between seasonal changes in CO2 fluxes and biological variability. -
Work Package 2: Quantify the link between iron and silicate availability and remineralisation depth.
This work package investigates the annual cycle of phytoplankton dynamics, net production and export of organic material in conjunction with iron availability. -
Work Package 3: Observationally determine the seasonal cycle in remineralisation depth.
This work package assesses remineralisation depth and its variability using marine snow catchers deployed during the process cruise, and backscatter measurements carried out year-round by gliders. -
Work Package 4: Examine the link between seasonality and remineralisation depth and the trajectory of carbon from the surface out of the upper limb.
This work package aims to ingest all CUSTARD observational data into models to determine whether seasonal variability in phytoplankton composition is reflected in changes in remineralisation depth, which in turn leads to seasonal variability in the fate of organic carbon leaving the Southern Ocean via the upper limb.
Fieldwork and data collection
All the observational data from the project is collected at and south of the Ocean Observatories Initiative (OOI) Global Southern Ocean Array, located south-west of Chile. Data collection activities span from November 2018 to January 2020, and include three cruises, four glider missions, and one mooring.
Cruises
All cruises depart from and return to Punta Arenas (Chile). Cruise activities include deployments and recovery of gliders and a mooring, Conductivity, Temperature and Depth (CTD), trace metal clean GoFlo bottle sampling, Red Camera Frame, Marine Snow Catcher and Underwater Vision Profiler deployments, as well as laboratory incubations with sea water samples. See cruise details below:
| Cruise identifier | Research ship | Cruise dates | Comments |
|---|---|---|---|
| DY096 | RRS Discovery | November - December 2018 | Deployment cruise |
| DY111 | RRS Discovery | December 2019 - January 2020 | Process cruise |
| DY112 | RRS Discovery | January 2020 | Mooring recovery cruise |
Gliders
Two Slocum 1000 MARS gliders (Pancake and Churchill) are deployed from DY096, to collect data continuously for one year until recovery on DY111. The gliders are mounted with CTD sensors, an optode, a fluorometer, and twin backscatter sensors. Pancake failed and its mission ended early in February 2019.
One Rutgers University glider is deployed from DY111, to collect data until recovery at the end of the same cruise. The glider is owned by Rutgers University and the data is shared with CUSTARD. It carries CTD sensors, an optode, a fluorometer, a backscatter sensor and a particle size analyser.
Mooring
Deployment of Global Surface Mooring GS01SUMO-00004 (SUMO-4) during DY096, to take continuous measurements for approximately one year until recovery during DY112. Its location is roughly 54 28 S, 89 02 W. This is an OOI mooring provided and deployed by WHOI, and adapted to integrate NOC lab-on-chip nitrate and silicate sensors.
Contacts
Dr. Adrian Marin (National Oceanography Centre, UK) - Lead Principal Investigator and lead of Work Package 4
Dr. Dorothee Bakker (University of East Anglia, UK) - Lead of Work Package 1
Prof. Mark Moore (University of Southampton, UK) - Lead of Work Package 2
Dr. Stephanie Henson (National Oceanography Centre / University of Southampton, UK) - Lead of Work Package 3
Data Activity or Cruise Information
Cruise
| Cruise Name | DY112 |
| Departure Date | 2020-01-16 |
| Arrival Date | 2020-01-25 |
| Principal Scientist(s) | Sheri White (Woods Hole Oceanographic Institution Department of Applied Ocean Physics and Engineering) |
| Ship | RRS Discovery |
Complete Cruise Metadata Report is available here
Fixed Station Information
No Fixed Station Information held for the Series
BODC Quality Control Flags
The following single character qualifying flags may be associated with one or more individual parameters with a data cycle:
| Flag | Description |
|---|---|
| Blank | Unqualified |
| < | Below detection limit |
| > | In excess of quoted value |
| A | Taxonomic flag for affinis (aff.) |
| B | Beginning of CTD Down/Up Cast |
| C | Taxonomic flag for confer (cf.) |
| D | Thermometric depth |
| E | End of CTD Down/Up Cast |
| G | Non-taxonomic biological characteristic uncertainty |
| H | Extrapolated value |
| I | Taxonomic flag for single species (sp.) |
| K | Improbable value - unknown quality control source |
| L | Improbable value - originator's quality control |
| M | Improbable value - BODC quality control |
| N | Null value |
| O | Improbable value - user quality control |
| P | Trace/calm |
| Q | Indeterminate |
| R | Replacement value |
| S | Estimated value |
| T | Interpolated value |
| U | Uncalibrated |
| W | Control value |
| X | Excessive difference |
SeaDataNet Quality Control Flags
The following single character qualifying flags may be associated with one or more individual parameters with a data cycle:
| Flag | Description |
|---|---|
| 0 | no quality control |
| 1 | good value |
| 2 | probably good value |
| 3 | probably bad value |
| 4 | bad value |
| 5 | changed value |
| 6 | value below detection |
| 7 | value in excess |
| 8 | interpolated value |
| 9 | missing value |
| A | value phenomenon uncertain |
| B | nominal value |
| Q | value below limit of quantification |
