Metadata Report for BODC Series Reference Number 853390
Metadata Summary
Problem Reports
Data Access Policy
Narrative Documents
Project Information
Data Activity or Cruise Information
Fixed Station Information
BODC Quality Flags
SeaDataNet Quality Flags
Metadata Summary
Data Description |
|||||||||||||||||||||||||||||||||||||||||
|
|||||||||||||||||||||||||||||||||||||||||
Data Identifiers |
|||||||||||||||||||||||||||||||||||||||||
|
|||||||||||||||||||||||||||||||||||||||||
Time Co-ordinates(UT) |
|||||||||||||||||||||||||||||||||||||||||
|
|||||||||||||||||||||||||||||||||||||||||
Spatial Co-ordinates | |||||||||||||||||||||||||||||||||||||||||
|
|||||||||||||||||||||||||||||||||||||||||
Parameters |
|||||||||||||||||||||||||||||||||||||||||
|
|||||||||||||||||||||||||||||||||||||||||
|
|||||||||||||||||||||||||||||||||||||||||
Problem Reports
JR20040830 (also known as JR106B) Lowered Acoustic Doppler Current Profiler (LADCP) data
Data from the upward-facing lowered ADCP unit (originator reference 03) is described as suspicious by the data originator.
Data Access Policy
Open Data
These data have no specific confidentiality restrictions for users. However, users must acknowledge data sources as it is not ethical to publish data without proper attribution. Any publication or other output resulting from usage of the data should include an acknowledgment.
If the Information Provider does not provide a specific attribution statement, or if you are using Information from several Information Providers and multiple attributions are not practical in your product or application, you may consider using the following:
"Contains public sector information licensed under the Open Government Licence v1.0."
Narrative Documents
RD Instruments 300kHz Workhorse Sentinel Acoustic Doppler Current Profiler
Specifications
| Water velocity measurements relative to the ADCP | |
|---|---|
| Maximum velocity | 10 m.s-1 |
| Standard deviation | 130, 45, 25, 12, 5 mm.s-1 for depth cell sizes of 1, 2, 4, 8, 16 m, respectively |
| Minimum time between pings | 0.07 s |
| Maximum profiling range* | 110, 120, 130, 150, 165 m for depth cell sizes of 1, 2, 4, 8, 16 m, respectively |
| Minimum range to start of first depth cell | 3 m |
| Number of depth cells | 1 - 128 cells |
| Depth cell size | 1 - 16 cm |
| Echo Intensity measurements | |
| Uncertainty | ± 1.5 dB |
| Sampling | Uses same depth cells and time intervals as velocity |
| Sensors | |
| Water level resolution | 0.25 m |
| Water level accuracy | ± 5 m over 0-200 m depth |
| Temperature range | -5°C to + 45°C |
| Temperature uncertainty | ± 0.4°C |
| Tilt range | ± 20° |
| Tilt uncertainty | ± 2° |
| Compass uncertainty | ± 5° at 60° magnetic dip angle |
| Compass maximum tilt | 20° |
| Physical and Environmental | |
| Maximum depth | 200 m |
| Operating temperature | -5°C to 60°C |
| Storage Temperature | -5°C to 80°C |
The manufacturer's specification document can be found here
Teledyne RDI's Workhorse Monitor ADCP
The Workhorse Monitor acoustic doppler current profler (Teledyne RD Instruments) is a long-range and long-term self contained ADCP. It has a patented four beam signal (300, 600 or 1200 kHz) and a standard depth rating of 200m or 600m. It operates effectively between temperatures of -5°C and 45°C and has a velocity accuracy of ±1% ±5mm/s.
BODC Processing
JR20040830 (also known as JR106B) Lowered Acoustic Doppler Current Profiller (LADCP) data
The data arrived at BODC in 81 .mat Matlab binary format files, representing all the final format processed data from the cruise. There are no files for the upward-facing ADCP for CTD stations 3, 4 and 5 (files j003_03.mat, j004_03.mat and j005_3.mat respectively). The file names have the format:
j[3 digit station number]_[2 digit instrument number].mat
Where the instrument number is 02 for the downward-facing ADCP and 03 is the upward-facing ADCP as shown in the instrument description document.
The data were transferred to the internal QXF format using BODC transfer function 438. Several series were produced from each source file with the 'Originator's Identifier' having the following format:
J[3 digit station number]_[2 digit instrument number]_[DOWNCAST/UPCAST]
Where the additional part to the identifier specifies whether the QXF files contains the downcast or upcast data.
The transfer mapping of variables from the source files is described in the following tables:
Downcast data transfer mapping for series with originator's identifier of the format J[3 digit station number]_[2 digit instrument number]_DOWNCAST
| Originator's variable | Units | Description | BODC Parameter Code | Units | Comment |
|---|---|---|---|---|---|
| sm_dn_i | logical 0/1, where 1 corresponds to good data | Originator's quality control mask | - | - | Used to apply originator's quality control to transferred data |
| sn_dn_i | Dimensionless | Number points points per 20 m bin | NLADCPBN | Dimensionless | - |
| su_dn_i | m s-1 | u component of velocity | LCEWLW01 | cm s-1 | Converted using su_dn_i*100 |
| su_var_dn_i | m s-1 | Variance of u velocity directly from instrument | SDEWLW01 | cm s-1 | Converted using (su_var_dn_i^0.5)*100 |
| sv_dn_i | m s-1 | v component of velocity | LCNSLW01 | cm s-1 | Converted using sv_dn_i*100 |
| sv_var_dn_i | m s-1 | Variance of v velocity directly from instrument | SDNSLW01 | cm s-1 | Converted using (sv_var_dn_i^0.5)*100 |
| sw_dn_i | m s-1 | w component of velocity | LRZALW01 | cm s-1 | Converted using sw_dn_i*100 |
| sw_var_dn_i | m s-1 | Variance of w (vertical) velocity directly from instrument | SDZALW01 | cm s-1 | Converted using (sw_var_dn_i^0.5)*100 |
| d_samp | m | data bin depths | DBINAA01 | m | - |
| pxy | Degrees | station position (at start) lon, lat | - | - | Not used, txy_start_end contains more information |
| txy_start_end | Decimal day, degrees | [decimal_day long lat] at start and end of cast | - | - | Used to create cast metadata |
Upcast data transfer mapping for series with originator's identifier of the format J[3 digit station number]_[2 digit instrument number]_UPCAST
| Originator's variable | Units | Description | BODC Parameter Code | Units | Comment |
|---|---|---|---|---|---|
| sm_up_i | logical 0/1, where 1 corresponds to good data | Originator's quality control mask | - | - | Used to apply originator's quality control to transferred data |
| sn_up_i | Dimensionless | Number points points per 20 m bin | NLADCPBN | Dimensionless | - |
| su_up_i | m s-1 | u component of velocity | LCEWLW01 | cm s-1 | Converted using su_up_i*100 |
| su_var_up_i | m s-1 | Variance of u velocity directly from instrument | SDEWLW01 | cm s-1 | Converted using (su_var_up_i^0.5)*100 |
| sv_up_i | m s-1 | v component of velocity | LCNSLW01 | cm s-1 | Converted using sv_up_i*100 |
| sv_var_up_i | m s-1 | Variance of v velocity directly from instrument | SDNSLW01 | cm s-1 | Converted using (sv_var_up_i^0.5)*100 |
| sw_up_i | m s-1 | w component of velocity | LRZALW01 | cm s-1 | Converted using sw_up_i*100 |
| sw_var_up_i | m s-1 | Variance of w (vertical) velocity directly from instrument | SDZALW01 | cm s-1 | Converted using (sw_var_up_i^0.5)*100 |
| d_samp | m | data bin depths | DBINAA01 | m | - |
| pxy | Degrees | station position (at start) lon, lat | - | - | Not used, txy_start_end contains more information |
| txy_start_end | Decimal day, degrees | [decimal_day long lat] at start and end of cast | - | - | Used to create cast metadata |
Meancast data
The data for the meancast (variables with names ending in _mn_i) were not transferred. The values are derived using weighted means based on the number of points in each bin so there is sufficient information to recalculate them with the upcast and downcast data.
e.g. (sn_dn_i*[downcast_variable] + sn_up_i*[upcast_variable])/(sn_dn_i+sn_up_i)
Screening
The reformatted data were visualised using in-house EDSERPLO software. Suspect data were marked by adding an appropriate quality control flag, missing data by both setting the data to the appropriate value and setting the quality control flag.
General Data Screening carried out by BODC
BODC screen both the series header qualifying information and the parameter values in the data cycles themselves.
Header information is inspected for:
- Irregularities such as unfeasible values
- Inconsistencies between related information, for example:
- Times for instrument deployment and for start/end of data series
- Length of record and the number of data cycles/cycle interval
- Parameters expected and the parameters actually present in the data cycles
- Originator's comments on meter/mooring performance and data quality
Documents are written by BODC highlighting irregularities which cannot be resolved.
Data cycles are inspected using time or depth series plots of all parameters. Currents are additionally inspected using vector scatter plots and time series plots of North and East velocity components. These presentations undergo intrinsic and extrinsic screening to detect infeasible values within the data cycles themselves and inconsistencies as seen when comparing characteristics of adjacent data sets displaced with respect to depth, position or time. Values suspected of being of non-oceanographic origin may be tagged with the BODC flag denoting suspect value; the data values will not be altered.
The following types of irregularity, each relying on visual detection in the plot, are amongst those which may be flagged as suspect:
- Spurious data at the start or end of the record.
- Obvious spikes occurring in periods free from meteorological disturbance.
- A sequence of constant values in consecutive data cycles.
If a large percentage of the data is affected by irregularities then a Problem Report will be written rather than flagging the individual suspect values. Problem Reports are also used to highlight irregularities seen in the graphical data presentations.
Inconsistencies between the characteristics of the data set and those of its neighbours are sought and, where necessary, documented. This covers inconsistencies such as the following:
- Maximum and minimum values of parameters (spikes excluded).
- The occurrence of meteorological events.
This intrinsic and extrinsic screening of the parameter values seeks to confirm the qualifying information and the source laboratory's comments on the series. In screening and collating information, every care is taken to ensure that errors of BODC making are not introduced.
Originator's Data Processing
JR20040830 (also known as JR106B) Lowered Acoustic Doppler Current Profiler (LADCP) data
See the JR20040830(JR106B) cruise report for more information and full description of the originator's protocol including listings of LADCP configuration files.
Sampling Strategy
A total of 42 CTD casts were performed during JR20040830 in the region of the Kangerdlussuaq Fjord and nearby continental shelf. Both LADCP units were deployed at every station (part of the CTD instrument setup). Data were downloaded from the ADCP units via a cable to the main ship laboratory between stations. The LADCP battery pack was also charged between stations ensuring it did not drop below 48 Volts. No data were returned by the upward facing ADCP for stations 3 and 4. The JR106b cruise report contains details of the LADCP configurations used at the various stations and more information can be found in the CD139 cruise report if required. Deployment and recovery protocols were based the methods used during JR67.
Data Processing
LADCP processing was undertaken using the software package available from Eric Firing's group at the University of Hawaii (UH). The UH software and documentation are available from the currents group at http://www.soest.hawaii.edu/. The processing has the following stages:
Initial processing stages
These allow the user to examine the quality of the data and to calculate relative velocity profiles in the absence of CTD or navigation data.
- Raw files are renamed with format j[3 digit station number]_[instrument number 02(downward facing) or 03(upward facing)] and file structure and links for processing are setup.
- Creation of station specific file structure and checks of cast (depth downcast/upcast times) against LADCP log sheet.
- Addition of station position information.
- Correction for magnetic declination.
- Initiate UH processing scripts.
- Merger of velocity shear profiles from individual pings into downcast and upcast profiles.
- Calculate relative velocity profiles and checks between downcast and upcast profiles. Instrument package vertical velocity is also checked to ensure it is reasonable.
Later UH processing stages
The data were fully reprocessed using the UH software at University of East Anglia (UEA) in the autumn of 2004. The reprocessing included the incorporation of accurate GPS navigation data and the CTD data.
References
Cruise report - CD139, Trans-Indian Hydrographic Section across 32°S (2003).
Cruise report - JR67, Drake Passage repeat hydrography: WOCE Southern Repeat Section 1b - Burdwood Bank to Elephant Island (2002).
Peter M. Saunders and N. P. Fofonoff (1976). Conversion of pressure to depth in the ocean, Deep-Sea Research, 23, 109-111.
Instrument Description
JR20040830 (also known as JR106B) Lowered Acoustic Doppler Current Profillers (LADCP)
The LADCP configuration uses a pair of RDI 300 kHz Workhorse Monitor ADCP units, model number WHM-300/6000 (the 6,000 describes a 6,000 m depth rating). The units were mounted on the CTD frame with one facing upward (unit 03) and the other downward (unit 02) as shown in Figure 1 below. The distance between the units was 106 cm and each unit was approximately 24 cm tall.
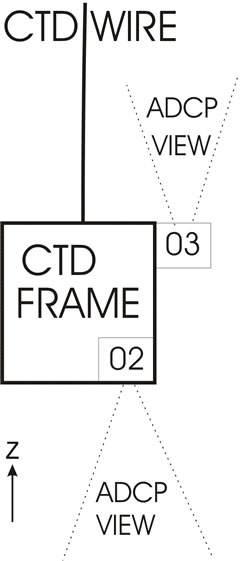
Figure 1: Diagram describing the LADCP configuration during JR106B
The configuration details are summarised in the following table with a full description in the cruise report.
| Originator ADCP reference number | Direction unit was facing | Master/Slave Unit | Serial number | Configuration sheet link |
|---|---|---|---|---|
| 02 | downward facing | Master | 4275 | RDI Workhorse Configuration Summary |
| 03 | upward facing | Slave | 1855 | RDI Workhorse Configuration Summary |
Project Information
AutoSub Under Ice (AUI) Programme
AutoSub was an interdisciplinary Natural Environment Research Council (NERC) thematic programme conceived to investigate the marine environment of floating ice shelves with a view to advancing the understanding of their role in the climate system.
The AUI programme had the following aims:
- To attain the programme's scientific objectives through an integrated programme based on interdisciplinary collaborations and an international perspective
- To develop a data management system for the archiving and collation of data collected by the programme, and to facilitate the eventual exploitation of this record by the community
- To provide high-quality training to develop national expertise in the use of autonomous vehicles in the collection of data from remote environments and the integration of such tools in wider programmes of research
- To stimulate and facilitate the parameterising of sub-ice shelf processes in climate models, and to further demonstrate the value of autonomous vehicles as platforms for data collection among the wider oceanographic and polar community
Following the invitation of outline bids and peer review of fully developed proposals, eight research threads were funded as part of AUI:
Physical Oceanography
- ISOTOPE: Ice Shelf Oceanography: Transports, Oxygen-18 and Physical Exchanges.
- Evolution and impact of Circumpolar Deep Water on the Antarctic continental shelf.
- Oceanographic conditions and processes beneath Ronne Ice Shelf (OPRIS).
Glaciology and Sea Ice
- Autosub investigation of ice sheet boundary conditions beneath Pine Island Glacier.
- Observations and modelling of coastal polynya and sea ice processes in the Arctic and Antarctic.
- Sea ice thickness distribution in the Bellingshausen Sea.
Geology and Geophysics
- Marine geological processes and sediments beneath floating ice shelves in Greenland and Antarctica: investigations using the Autosub AUV.
Biology
- Controls on marine benthic biodiversity and standing stock in ice-covered environments.
The National Oceanography Centre Southampton (NOCS) hosted the AUI programme with ten further institutions collaborating in the project. The project ran from April 2000 until the end of March 2005, with some extensions to projects beyond this date because of research cruise delays. The following cruises were the fieldwork component of the AUI project:
Table 1: Details of the RRS James Clark Ross AUI cruises.
| Cruise No. | Cruise No. synonyms | Dates | Areas of study |
|---|---|---|---|
| JR20030218 | JR84 | 28 February 2003 to 4 April 2003 | Amundsen Sea, Antarctica |
| JR20040813 | JR106, JR106a, JR106N (North) | 10 August 2004 to 30 August 2004 | Northeast Greenland Continental Shelf, Greenland |
| JR20040830 | JR106b, JR106S (South) | 30 August 2004 to 16 September 2004 | Kangerlussuaq Fjord, Greenland |
| JR20050203 | JR97, JR097 | 3 February 2005 to 11 March 2005 | Fimbul Ice Shelf and Weddell Sea, Antarctica . This cruise was redirected from the Filcner-Ronne Ice Shelf to the Fimbul Ice Shelf because of unfavourable sea-ice conditions. |
All the cruises utilised the AutoSub autonomous, unmanned and untethered underwater vehicle to collect observations beneath sea-ice and floating ice shelves. AutoSub can be fitted with a range of oceanographic sensors such as:
- Conductivity Temperature Depth (CTD) instruments
- Acoustic Doppler Current Profillers (ADCP)
- A water sampler
- Swath bathymetry systems
- Cameras
In addition to use of AutoSub during each cruise measurements were taken from ship. These varied by cruise but included:
- Ship underway measurements and sampling for parameters such as:
- Salinity
- Temperature
- Fluorescence
- Oxygen 18 isotope enrichment in water
- Bathymetry using a swath bathymetry system
- Full-depth CTD casts for with observations of samples taken for parameters such as:
- Salinity
- Temperature
- Fluorescence
- Optical transmissivity
- Dissolved oxygen
- Oxygen 18 isotope enrichment in water
- Water CFC content
- Sea floor photography and video using the WASP system
- Sea floor sampling with trawls/rock dredges
- Sea ice observations (ASPeCt), drifters and sampling
The AutoSub project also included numerical modelling work undertaken at University College London, UK.
The project included several firsts including the first along-track observations beneath an ice shelf using an autonomous underwater vehicle. The AutoSub vehicle was developed and enhanced throughout this programme and has now become part of the NERC equipment pool for general use by the scientific community. Further information for each cruise can be found in the respective cruise reports (links in Table 1).
Data Activity or Cruise Information
Cruise
| Cruise Name | JR20040830 (JR106B) |
| Departure Date | 2004-08-30 |
| Arrival Date | 2004-09-16 |
| Principal Scientist(s) | Julian A Dowdeswell (University of Cambridge, Scott Polar Research Institute) |
| Ship | RRS James Clark Ross |
Complete Cruise Metadata Report is available here
Fixed Station Information
No Fixed Station Information held for the Series
BODC Quality Control Flags
The following single character qualifying flags may be associated with one or more individual parameters with a data cycle:
| Flag | Description |
|---|---|
| Blank | Unqualified |
| < | Below detection limit |
| > | In excess of quoted value |
| A | Taxonomic flag for affinis (aff.) |
| B | Beginning of CTD Down/Up Cast |
| C | Taxonomic flag for confer (cf.) |
| D | Thermometric depth |
| E | End of CTD Down/Up Cast |
| G | Non-taxonomic biological characteristic uncertainty |
| H | Extrapolated value |
| I | Taxonomic flag for single species (sp.) |
| K | Improbable value - unknown quality control source |
| L | Improbable value - originator's quality control |
| M | Improbable value - BODC quality control |
| N | Null value |
| O | Improbable value - user quality control |
| P | Trace/calm |
| Q | Indeterminate |
| R | Replacement value |
| S | Estimated value |
| T | Interpolated value |
| U | Uncalibrated |
| W | Control value |
| X | Excessive difference |
SeaDataNet Quality Control Flags
The following single character qualifying flags may be associated with one or more individual parameters with a data cycle:
| Flag | Description |
|---|---|
| 0 | no quality control |
| 1 | good value |
| 2 | probably good value |
| 3 | probably bad value |
| 4 | bad value |
| 5 | changed value |
| 6 | value below detection |
| 7 | value in excess |
| 8 | interpolated value |
| 9 | missing value |
| A | value phenomenon uncertain |
| B | nominal value |
| Q | value below limit of quantification |
