Metadata Report for BODC Series Reference Number 90072
Metadata Summary
Problem Reports
Data Access Policy
Narrative Documents
Project Information
Data Activity or Cruise Information
Fixed Station Information
BODC Quality Flags
SeaDataNet Quality Flags
Metadata Summary
Data Description |
|||||||||||||||||||||||||
|
|||||||||||||||||||||||||
Data Identifiers |
|||||||||||||||||||||||||
|
|||||||||||||||||||||||||
Time Co-ordinates(UT) |
|||||||||||||||||||||||||
|
|||||||||||||||||||||||||
Spatial Co-ordinates | |||||||||||||||||||||||||
|
|||||||||||||||||||||||||
Parameters |
|||||||||||||||||||||||||
|
|||||||||||||||||||||||||
|
|||||||||||||||||||||||||
Problem Reports
No Problem Report Found in the Database
Data Access Policy
Open Data
These data have no specific confidentiality restrictions for users. However, users must acknowledge data sources as it is not ethical to publish data without proper attribution. Any publication or other output resulting from usage of the data should include an acknowledgment.
If the Information Provider does not provide a specific attribution statement, or if you are using Information from several Information Providers and multiple attributions are not practical in your product or application, you may consider using the following:
"Contains public sector information licensed under the Open Government Licence v1.0."
Narrative Documents
Bissett-Berman 9060 Salinity Temperature and Depth
The B-B 9060 STD measured salinity, temperature and depth and whose analogue output was in graphical form. The plots created were of salinity and temperature versus depth which had to be manually digitised.
RRS Challenger 7/75 STD Data Documentation
Introduction
Documentation for the STD data collected on RRS Challenger Cruise 7/75 (May 1975) by the Scottish Marine Biological Association, Oban, Argyll, Scotland, UK, under the direction of D. J. Ellett.
Note that SMBA commented that for cast C775/027 (BODC Series Reference 90035) that the salinity from bottle sample was doubtful.
Instrumentation
The instrument used was a Bissett Berman STD system and the data were logged on a Hewlett Packard 9820. Instrument lowering and raising speeds between 0.5 m/s and 1 m/s. An acoustic pinger was placed above the STD to give an accurate depth measurement, this could then be used to check the STD pressure calibration. An NIO bottle with reversing thermometers was placed above the pinger, within 2m of the STD system. A bottle sample was taken at the bottom of the cast providing the temperature and salinity are uniform at that point. If large temperature or salinity gradients were present then the bottle sample was triggered at a suitable site on the upcast. A surface salinity sample was also taken at the start of the dip.
Calibration
The STD was not calibrated in the laboratory. The manufacturer's calibration was used and water samples taken to check the calibration and apply corrections where necessary.
Temperature
The manufacturer's calibration was used to convert the raw data to physical units using the equation below:
Temperature (°C) = (106 /Pt - 2238.68)/55.84
where Pt is the temperature period in microseconds
These values were then plotted against the water bottle (i.e. reversing thermometer) temperatures and a regression line fitted to the data such that:
Temperature(WB) = m x Temperature(STD) + c
Then the regression coefficients (m and c) were applied to correct the STD temperature data - these are given in the table below.
Salinity
The manufacturer's calibration was used to convert the raw data to physical units using the equation below:
Salinity (ppt) = (106 /Ps - 4995)/290.6 + 30
where Ps is the salinity period in microseconds
These values were then plotted against the STD salinity and a regression line fitted to the data such that:
Salinity(WB) = m x Salinity(STD) + c + (m1 x Pressure + c1)/1000
Then the regression coefficients were applied to correct the STD salinity data. The data showed a salinity - pressure dependency, this was corrected by plotting delta-S (i.e. calibrated salinity - calculated salinity) against pressure to determine the slope (m1) and intercept (c1). These were then incorporated into the equation as shown above. The regression coefficients are given in the table below.
Pressure
The depths from the acoustic pinger were noted where the bottle samples were taken and then used to check the calibration of the pressure sensor - unless calibration values were available from the reversing thermometers. The equation below was used to convert the pressure period to physical units.
Pressure = (106 /Pd - 9712)/0.26267
where Pd is the pressure period in microseconds
A regression fit was carried out using the calibration values and the slope and intercept determined. The pressure values could then be corrected using:
Pressure (CORR) = m x Pressure(STD) + c
The fit of the STD data to the water bottle calibration data is given in the table below:
| Variable | Slope (m) | Intercept (c) | Standard Deviation |
|---|---|---|---|
| Temperature (°C) | 0.9993 | 0.0561 | 0.009 |
| Salinity (ppt) | 0.8674 | 4.6819 | 0.013 |
| Pressure (dbar) | 0.5031 | -4.0269 | 2.792 |
| Delta-S | -0.0042 | 11.8581 | 10.043 |
Data processing
Obvious wild points were edited out of the calibration file and the calibration programs run to obtain values for the slopes and intercepts for temperature, pressure and salinity. These were then applied to the uncalibrated data and sigma-t was calculated. The data values were then sieved to ensure a minimum separation between pressure values of 1 dbar. The data were then visually inspected and major spikes flagged.
Reference
Sharples, F. (1987).
A new data bank of SMBA STD/CTD observations in the Rockall Trough 1975-84. SMBA Marine Physics Group Report No. 36.
Graham, J.M., Sharples, F., Meldrum, D.T. and Edwards, A. (1987).
STD observations in the Rockall Trough 1975-77. SMBA Marine Physics Group Report No. 39.
Project Information
No Project Information held for the Series
Data Activity or Cruise Information
Cruise
| Cruise Name | CH7A/75 |
| Departure Date | 1975-05-01 |
| Arrival Date | 1975-05-06 |
| Principal Scientist(s) | David J Ellett (Scottish Marine Biological Association) |
| Ship | RRS Challenger |
Complete Cruise Metadata Report is available here
Fixed Station Information
Fixed Station Information
| Station Name | DML Shelf Edge Line L Station L8 |
| Category | Offshore location |
| Latitude | 56° 58.50' N |
| Longitude | 9° 4.00' W |
| Water depth below MSL | 145.0 m |
DML Shelf Edge Station L8
Shelf edge station L8 is one of 11 fixed STD/CTD stations striding the shelf edge to the south east of the Anton Dohrn Seamount. The station was established by scientists at Dunstaffnage Marine Laboratory (DML).
Related Fixed Station activities are detailed in Appendix 1
Fixed Station Information
| Station Name | DML Shelf Edge Line L |
| Category | Offshore route/traverse |
DML Shelf Edge Line L
Shelf Edge Line L is a north east - south west orientated survey section striding the shelf edge to the west of Scotland. The section comprises fixed STD/CTD stations, which were surveyed by Dunstaffnage Marine Laboratory (DML), predominantly during 1993 and 1994.
Map of standard DML Shelf Edge Line L STD/CTD Stations
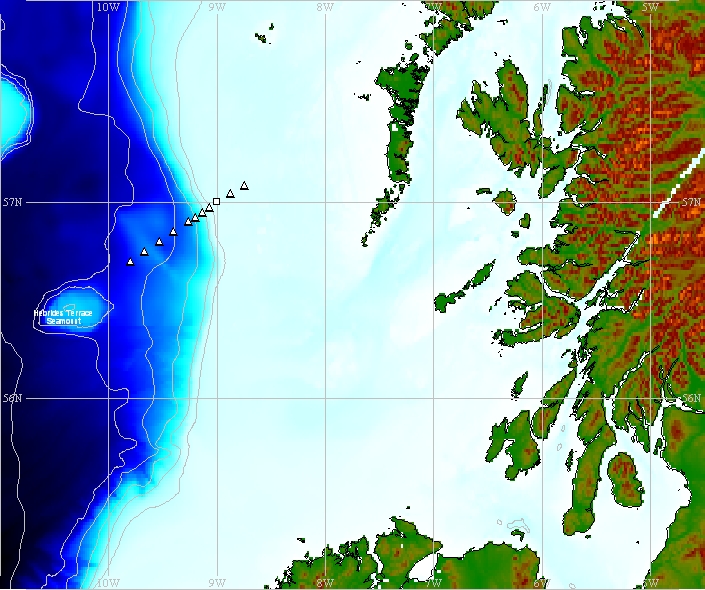
Map produced using the GEBCO Digital Atlas.
The triangles indicate the nominal positions of each standard L station on Shelf Edge Line L. The square is the nominal position of Ellett Line station R, which is incorporated into Shelf Edge Line L.
Nominal station details
DML Shelf Edge Line L Stations
| Station | Nominal latitude | Nominal longitude | Approx. depth (m) |
|---|---|---|---|
| L1 | 56° 42.0' N | 09° 48.0' W | 1820 |
| L2 * | 56° 45.0' N | 09° 40.0' W | |
| L3 | 56° 48.0' N | 09° 32.0' W | 1720 |
| L4 | 56° 51.0' N | 09° 24.0' W | |
| L5 | 56° 54.0' N | 09° 16.0' W | 1286 |
| L6 | 56° 55.5' N | 09° 12.0' W | 960 |
| L7 | 56° 57.0' N | 09° 08.0' W | 343 |
| L8 | 56° 58.5' N | 09° 04.0' W | 145 |
| R | 57° 00.0' N | 09° 00.0' W | 135 |
| L9 | 57° 02.5' N | 08° 52.5' W | 125 |
| L10 | 57° 05.0' N | 08° 45.0' W | 123 |
* One off station
Related Fixed Station activities are detailed in Appendix 2
BODC Quality Control Flags
The following single character qualifying flags may be associated with one or more individual parameters with a data cycle:
| Flag | Description |
|---|---|
| Blank | Unqualified |
| < | Below detection limit |
| > | In excess of quoted value |
| A | Taxonomic flag for affinis (aff.) |
| B | Beginning of CTD Down/Up Cast |
| C | Taxonomic flag for confer (cf.) |
| D | Thermometric depth |
| E | End of CTD Down/Up Cast |
| G | Non-taxonomic biological characteristic uncertainty |
| H | Extrapolated value |
| I | Taxonomic flag for single species (sp.) |
| K | Improbable value - unknown quality control source |
| L | Improbable value - originator's quality control |
| M | Improbable value - BODC quality control |
| N | Null value |
| O | Improbable value - user quality control |
| P | Trace/calm |
| Q | Indeterminate |
| R | Replacement value |
| S | Estimated value |
| T | Interpolated value |
| U | Uncalibrated |
| W | Control value |
| X | Excessive difference |
SeaDataNet Quality Control Flags
The following single character qualifying flags may be associated with one or more individual parameters with a data cycle:
| Flag | Description |
|---|---|
| 0 | no quality control |
| 1 | good value |
| 2 | probably good value |
| 3 | probably bad value |
| 4 | bad value |
| 5 | changed value |
| 6 | value below detection |
| 7 | value in excess |
| 8 | interpolated value |
| 9 | missing value |
| A | value phenomenon uncertain |
| B | nominal value |
| Q | value below limit of quantification |
Appendix 1: DML Shelf Edge Line L Station L8
Related series for this Fixed Station are presented in the table below. Further information can be found by following the appropriate links.
If you are interested in these series, please be aware we offer a multiple file download service. Should your credentials be insufficient for automatic download, the service also offers a referral to our Enquiries Officer who may be able to negotiate access.
| Series Identifier | Data Category | Start date/time | Start position | Cruise |
|---|---|---|---|---|
| 385896 | CTD or STD cast | 1993-05-19 20:33:00 | 56.975 N, 9.0633 W | RRS Challenger CH103 |
| 391392 | CTD or STD cast | 1994-08-23 22:18:00 | 56.975 N, 9.0667 W | RRS Challenger CH114 |
Appendix 2: DML Shelf Edge Line L
Related series for this Fixed Station are presented in the table below. Further information can be found by following the appropriate links.
If you are interested in these series, please be aware we offer a multiple file download service. Should your credentials be insufficient for automatic download, the service also offers a referral to our Enquiries Officer who may be able to negotiate access.
| Series Identifier | Data Category | Start date/time | Start position | Cruise |
|---|---|---|---|---|
| 385767 | CTD or STD cast | 1993-05-17 10:04:00 | 57.0 N, 9.0 W | RRS Challenger CH103 |
| 385847 | CTD or STD cast | 1993-05-19 06:45:00 | 56.6967 N, 9.7983 W | RRS Challenger CH103 |
| 385859 | CTD or STD cast | 1993-05-19 08:43:00 | 56.8 N, 9.53 W | RRS Challenger CH103 |
| 385860 | CTD or STD cast | 1993-05-19 16:46:00 | 56.8967 N, 9.2433 W | RRS Challenger CH103 |
| 385872 | CTD or STD cast | 1993-05-19 17:34:00 | 56.925 N, 9.2117 W | RRS Challenger CH103 |
| 385884 | CTD or STD cast | 1993-05-19 19:34:00 | 56.9467 N, 9.125 W | RRS Challenger CH103 |
| 385896 | CTD or STD cast | 1993-05-19 20:33:00 | 56.975 N, 9.0633 W | RRS Challenger CH103 |
| 385903 | CTD or STD cast | 1993-05-19 21:39:00 | 56.9967 N, 9.0017 W | RRS Challenger CH103 |
| 385915 | CTD or STD cast | 1993-05-19 22:35:00 | 57.0433 N, 8.8733 W | RRS Challenger CH103 |
| 385927 | CTD or STD cast | 1993-05-20 00:26:00 | 57.0833 N, 8.75 W | RRS Challenger CH103 |
| 390014 | CTD or STD cast | 1994-05-11 23:34:00 | 56.8333 N, 9.4167 W | RRS Challenger CH112 |
| 391275 | CTD or STD cast | 1994-08-23 08:30:00 | 56.7 N, 9.8 W | RRS Challenger CH114 |
| 391287 | CTD or STD cast | 1994-08-23 10:07:00 | 56.75 N, 9.6667 W | RRS Challenger CH114 |
| 391299 | CTD or STD cast | 1994-08-23 11:13:00 | 56.7928 N, 9.5333 W | RRS Challenger CH114 |
| 391306 | CTD or STD cast | 1994-08-23 12:20:00 | 56.85 N, 9.3932 W | RRS Challenger CH114 |
| 391331 | CTD or STD cast | 1994-08-23 19:04:00 | 56.9 N, 9.2667 W | RRS Challenger CH114 |
| 391355 | CTD or STD cast | 1994-08-23 20:06:00 | 56.925 N, 9.2 W | RRS Challenger CH114 |
| 391379 | CTD or STD cast | 1994-08-23 21:12:00 | 56.95 N, 9.1333 W | RRS Challenger CH114 |
| 391380 | CTD or STD cast | 1994-08-23 21:48:00 | 56.9633 N, 9.1333 W | RRS Challenger CH114 |
| 391392 | CTD or STD cast | 1994-08-23 22:18:00 | 56.975 N, 9.0667 W | RRS Challenger CH114 |
| 391423 | CTD or STD cast | 1994-08-23 23:18:00 | 57.0 N, 9.0 W | RRS Challenger CH114 |
| 391435 | CTD or STD cast | 1994-08-24 00:14:00 | 57.0382 N, 8.8717 W | RRS Challenger CH114 |
| 391447 | CTD or STD cast | 1994-08-24 01:12:00 | 57.0765 N, 8.7508 W | RRS Challenger CH114 |
