Metadata Report for BODC Series Reference Number 1013002
Metadata Summary
Problem Reports
Data Access Policy
Narrative Documents
Project Information
Data Activity or Cruise Information
Fixed Station Information
BODC Quality Flags
SeaDataNet Quality Flags
Metadata Summary
Data Description |
|||||||||||||||||||||||||||||||||||||||||||||
|
|||||||||||||||||||||||||||||||||||||||||||||
Data Identifiers |
|||||||||||||||||||||||||||||||||||||||||||||
|
|||||||||||||||||||||||||||||||||||||||||||||
Time Co-ordinates(UT) |
|||||||||||||||||||||||||||||||||||||||||||||
|
|||||||||||||||||||||||||||||||||||||||||||||
Spatial Co-ordinates | |||||||||||||||||||||||||||||||||||||||||||||
|
|||||||||||||||||||||||||||||||||||||||||||||
Parameters |
|||||||||||||||||||||||||||||||||||||||||||||
|
|||||||||||||||||||||||||||||||||||||||||||||
|
|||||||||||||||||||||||||||||||||||||||||||||
Problem Reports
Problem Report
Dissolved Oxygen
All data from this channel should be used with caution as the values measured were unrealistic during this and several other cruises. Readings taken by the probe indicated that the sensor was constantly saturated. It is advised that the data should only be used for relative comparisons.
Data Quality Notes
Salinity
There was a lot of scatter present in the calibration data set, which may have compromised the quality of the calibration used to derivethe salinity channel.
PAR
For casts C001, C002, and C004-C007, the downcast profiles began too deep for any PAR signal to be detected. However there was a PAR signal logged in each corresponding upcast and this is available from BODC on request.
Data Access Policy
Open Data
These data have no specific confidentiality restrictions for users. However, users must acknowledge data sources as it is not ethical to publish data without proper attribution. Any publication or other output resulting from usage of the data should include an acknowledgment.
If the Information Provider does not provide a specific attribution statement, or if you are using Information from several Information Providers and multiple attributions are not practical in your product or application, you may consider using the following:
"Contains public sector information licensed under the Open Government Licence v1.0."
Narrative Documents
Sea Bird Electronics SBE13 Dissolved Oxygen Sensor
The SBE 13 was designed as an auxiliary sensor for Sea Bird SBE 9plus, but can fitted in custom instrumentation applications. When used with the SBE 9 Underwater Unit, a flow-through plenum improves the data quality, as the pumping water over the sensor membrane reduces the errors caused by oxygen depletion during the periods of slow or intermittent flushing and also reduces exposure to biofouling.
The output voltage is proportional to membrane current (oxygen current) and to the sensor element's membrane temperature (oxygen temperature), which is used for internal temperature compensation.
Two versions of the SBE 13 are available: the SBE 13Y uses a YSI polarographic element with replaceable membranes to provide in situ measurements up to 2000 m depth and the SBE 13B uses a Beckman polarographic element to provide in situ measurements up to 10500 m depth, depending on the sensor casing. This sensor includes a replaceable sealed electrolyte membrane cartridge.
The SBE 13 instrument has been out of production since 2001 and has been superseded by the SBE 43.
Specifications
| Measurement range | 0 to 15 mL L-1 |
| Accuracy | 0.1 mL L-1 |
| Time response | 2 s at 25°C 5 s at 0°C |
| Depth range | 2000 m (SBE 13Y- housing in anodized aluminum) 6800 m (SBE 13B- housing in anodized aluminum) 105000 m (SBE 13B- housing in titanium) |
Further details can be found in the manufacturer's specification sheet.
Prince Madog Cruise PD35_06 CTD Instrumentation
The CTD unit was a Sea-Bird Electronics 911plus system (SN P23655-0620), with dissolved oxygen sensor. In addition the CTD was fitted with a red (660 nm) beam transmissometer, a fluorometer and a LI-COR Underway Quantum Sensor. Also attached was a Sea-Bird SBE-35 Temperature Logger to supply an independent check of temperature. There were no reported changes of sensor during the cruise. The table below lists more detailed information about the various sensors.
| Sensor | Model | Serial Number | Calibration Date | Comments |
|---|---|---|---|---|
| Pressure transducer | Paroscientific Digiquartz 42K-105 | 76076 | 2004-01-21 | - |
| Conductivity sensor | SBE 4 | 2543 | 2004-01-14 | - |
| Temperature sensor | SBE 3 | P4100 | 2004-01-21 | - |
| Dissolved oxygen sensor | SBE 13 Beckman | 130580 | 2004-01-05 | - |
| Transmissometer 660nm | SeaTech T1000 | T1021 | 1998-03-03 | 0.2 m path length |
| Fluorometer | Turner SCUFA II | 262 | - | - |
| LI-COR | LI 192SB | 33 | - | - |
| Temperature Logger | SBE-35 | 0041 | 2005-05-09 | - |
Sampling Device
The rosette sampling system was equipped with 5 litre sampling bottles.
Sea-Bird Electronics SBE 911 and SBE 917 series CTD profilers
The SBE 911 and SBE 917 series of conductivity-temperature-depth (CTD) units are used to collect hydrographic profiles, including temperature, conductivity and pressure as standard. Each profiler consists of an underwater unit and deck unit or SEARAM. Auxiliary sensors, such as fluorometers, dissolved oxygen sensors and transmissometers, and carousel water samplers are commonly added to the underwater unit.
Underwater unit
The CTD underwater unit (SBE 9 or SBE 9 plus) comprises a protective cage (usually with a carousel water sampler), including a main pressure housing containing power supplies, acquisition electronics, telemetry circuitry, and a suite of modular sensors. The original SBE 9 incorporated Sea-Bird's standard modular SBE 3 temperature sensor and SBE 4 conductivity sensor, and a Paroscientific Digiquartz pressure sensor. The conductivity cell was connected to a pump-fed plastic tubing circuit that could include auxiliary sensors. Each SBE 9 unit was custom built to individual specification. The SBE 9 was replaced in 1997 by an off-the-shelf version, termed the SBE 9 plus, that incorporated the SBE 3 plus (or SBE 3P) temperature sensor, SBE 4C conductivity sensor and a Paroscientific Digiquartz pressure sensor. Sensors could be connected to a pump-fed plastic tubing circuit or stand-alone.
Temperature, conductivity and pressure sensors
The conductivity, temperature, and pressure sensors supplied with Sea-Bird CTD systems have outputs in the form of variable frequencies, which are measured using high-speed parallel counters. The resulting count totals are converted to numeric representations of the original frequencies, which bear a direct relationship to temperature, conductivity or pressure. Sampling frequencies for these sensors are typically set at 24 Hz.
The temperature sensing element is a glass-coated thermistor bead, pressure-protected inside a stainless steel tube, while the conductivity sensing element is a cylindrical, flow-through, borosilicate glass cell with three internal platinum electrodes. Thermistor resistance or conductivity cell resistance, respectively, is the controlling element in an optimized Wien Bridge oscillator circuit, which produces a frequency output that can be converted to a temperature or conductivity reading. These sensors are available with depth ratings of 6800 m (aluminium housing) or 10500 m (titanium housing). The Paroscientific Digiquartz pressure sensor comprises a quartz crystal resonator that responds to pressure-induced stress, and temperature is measured for thermal compensation of the calculated pressure.
Additional sensors
Optional sensors for dissolved oxygen, pH, light transmission, fluorescence and others do not require the very high levels of resolution needed in the primary CTD channels, nor do these sensors generally offer variable frequency outputs. Accordingly, signals from the auxiliary sensors are acquired using a conventional voltage-input multiplexed A/D converter (optional). Some Sea-Bird CTDs use a strain gauge pressure sensor (Senso-Metrics) in which case their pressure output data is in the same form as that from the auxiliary sensors as described above.
Deck unit or SEARAM
Each underwater unit is connected to a power supply and data logging system: the SBE 11 (or SBE 11 plus) deck unit allows real-time interfacing between the deck and the underwater unit via a conductive wire, while the submersible SBE 17 (or SBE 17 plus) SEARAM plugs directly into the underwater unit and data are downloaded on recovery of the CTD. The combination of SBE 9 and SBE 17 or SBE 11 are termed SBE 917 or SBE 911, respectively, while the combinations of SBE 9 plus and SBE 17 plus or SBE 11 plus are termed SBE 917 plus or SBE 911 plus.
Specifications
Specifications for the SBE 9 plus underwater unit are listed below:
| Parameter | Range | Initial accuracy | Resolution at 24 Hz | Response time |
|---|---|---|---|---|
| Temperature | -5 to 35°C | 0.001°C | 0.0002°C | 0.065 sec |
| Conductivity | 0 to 7 S m-1 | 0.0003 S m-1 | 0.00004 S m-1 | 0.065 sec (pumped) |
| Pressure | 0 to full scale (1400, 2000, 4200, 6800 or 10500 m) | 0.015% of full scale | 0.001% of full scale | 0.015 sec |
Further details can be found in the manufacturer's specification sheet.
Turner Designs Self-Contained Underwater Fluorescence Apparatus (SCUFA)
The Turner Designs SCUFA is a submersible fluorometer for chlorophyll and dye tracing operations that has been designed to operate in a wide range of concentrations, environmental conditions as well as operational modes (profiling or moored deployments). The instrument includes an integrated temperature probe and software which allow for automatic correction of fluorescence data from temperature effects. The superior ambient light rejection eliminates the effects of sunlight and allows the SCUFA to be used in surface waters without the need for external pumps or light shields.
Each instrument can be customised to meet user requirements. Users can choose one of the following channels: chlorophyll a, cyanobacteria (phycocyanin or phycoerythrin pigments), rhodamine WT, fluorescein and turbidity. Instrument options include turbidity, internal data logging and automatic temperature correction.
Three versions of the SCUFA are available: SCUFA I, II and III. SCUFA I and II are used for chlorophyll a applications, while SCUFA III is used for Rhodamine WT. Models II and III include a turbidity channel that is not present on model I. The SCUFA has been out of production since 2008.
Specifications
| Depth rating | 600 m |
| Detector | Photodiode |
| Temperature range | -2 to 40°C |
| Maximum sampling rate | 1Hz- digital 5 Hz- analog |
| Resolution | 12 bit- digital 1.2 mV- analog |
| Dynamic Range | |
| Fluorescence | 4 orders of magnitude |
| Turbidity | 3 orders of magnitude |
The table below presents the specifications for the different channels.
| Specifications | Chlorophyll | Cyanobacteria | Rhodamine WT/Fluorescein |
| Light source | Blue | Orange- PC Blue- PE | Green |
| Excitation/Emission | 460/685 | 595/670 (phycocyanin, PC) 528/573 (phycoerythrin, PE) | 530/600 (rhodamine) 490/580 (fluorescein) |
| Minimum detection Limit | |||
| Fluorescence | 0.02 µg L-1 | 150 cells mL-1 | 0.04 ppb |
| Turbidity | 0.05 NTU | 0.05 NTU | 0.05 NTU |
Further details can be found in the manufacturer's brochure.
LI-COR LI-192 Underwater Quantum Sensor
The LI-192 Underwater Quantum Sensor is used to measure photosynthetic photon flux density and is cosine corrected. The sensor is often referred to as LI-192SA or LI-192SB (the LI-192SB model was superseded by LI-192SA). One of the main differences is that the LI-192SA model includes a built-in voltage output for interfacing with NexSens iSIC and SDL data loggers.
Sensor specifications, current at January 2012, are given in the table below. More information can be found in the manufacturer's LI-192SA andLI-192SB specification sheets.
Sensor Specifications
(Specifications apply to both models unless otherwise stated)
| Absolute Calibration | ± 5 % in air traceable to NBS. |
|---|---|
| Sensitivity | Typically 3 µA per 1000 µmol s-1 m-2 for LI-192SB and 4 µA per 1000 µmol s-1 m-2 for LI-192SA in water. |
| Linearity | Maximum deviation of 1 % up to 10,000 µmol s-1 m-2. |
| Stability | < ± 2 % change over a 1 year period. |
| Response Time | 10 µs. |
| Temperature Dependence | ± 0.15 % per °C maximum. |
| Cosine Correction | Optimized for both underwater and atmospheric use. |
| Azimuth | < ± 1 % error over 360 ° at 45 ° elevation. |
| Detector | High stability silicon photovoltaic detector (blue enhanced). |
| Sensor Housing | Corrosion resistant metal with acrylic diffuser for both saltwater and freshwater applications. Waterproof to withstand 800 psi (5500 kPa) (560 meters). |
SeaTech Transmissometer
Introduction
The transmissometer is designed to accurately measure the the amount of light transmitted by a modulated Light Emitting Diode (LED) through a fixed-length in-situ water column to a synchronous detector.
Specifications
- Water path length: 5 cm (for use in turbid waters) to 1 m (for use in clear ocean waters).
- Beam diameter: 15 mm
- Transmitted beam collimation: <3 milliradians
- Receiver acceptance angle (in water): <18 milliradians
- Light source wavelength: usually (but not exclusively) 660 nm (red light)
Notes
The instrument can be interfaced to Aanderaa RCM7 current meters. This is achieved by fitting the transmissometer in a slot cut into a customized RCM4-type vane.
A red LED (660 nm) is used for general applications looking at water column sediment load. However, green or blue LEDs can be fitted for specilised optics applications. The light source used is identified by the BODC parameter code.
Further details can be found in the manufacturer's Manual.
Prince Madog Cruise PD35_06 CTD Processing
Sampling Strategy
A total of 36 CTD casts were performed during the cruise throughout Liverpool Bay. Rosette bottles were fired near-bed on most profiles in order to obtain independent temperature and salinity samples, the results of which were sent to BODC. Water bottle samples were also taken from the near-surface and near-bed bottles and frozen for nutrient analysis (nitrates, phosphate, silicate) at the National Oceanography Centre, Southampton. Additionally, the near-surface samples were filtered to determine suspended sediment load by the School of Ocean Sciences, University of Wales Bangor. Some filtrate was also preserved by mecuric chloride for nutrient analysis by Cefas at stations 5-9, 11 and 21.
Data were logged at 24 Hz onto a PC running SEASAVE, Sea-Bird's data acquisition software. The raw Sea-Bird data, configuration and bottle files were supplied to BODC for further processing.
BODC processing and screening
Sea-Bird Processing
The raw CTD files were processed through the Sea-Bird SBE Data Processing software version 5.35. Binary (.DAT) files were converted to engineering units and ASCII format (.CNV) using the DATCNV program. Sea-Bird bottle files (.BTL), with information on pressure and other logged readings at the time of bottle firing, were also generated during the data conversion process.
Sea-Bird software program ALIGNCTD was run to advance conductivity by 0s and oxygen by 3s (within the typical range given in the Sea-Bird manual). No adjustment was made to the temperature channel as the fast sensor response time renders this unnecessary, according to the Sea-Bird literature.
To compensate for conductivity cell thermal mass effects, the data files were run through CELLTM, using alpha = 0.03, 1/beta = 7, typical values for this CTD model given in the Sea-Bird literature. After running WILD EDIT, FILTER was run on the pressure channel using the recommended time filter of 0.15 seconds. Next, a minimum CTD velocity of 0.0 m s-1 was used for LOOP EDIT in order to exclude scans where the CTD was travelling backwards due to ship's heave. Salinity, density and oxygen concentration were then calculated and added to the output files using the DERIVE program.
Reformatting
The data were converted from ASCII format into a subset of NetCDF. The following table shows the mapping of variables within the original files to appropriate BODC parameter codes:
| Originator's Variable | Units | Description | BODC Parameter Code | Units | Comments |
|---|---|---|---|---|---|
| Pressure | dbar | Pressure exerted by the water body | PRESPR01 | dbar | - |
| Conductivity | S m-1 | Electrical conductivity of the water body by CTD | CNDCST01 | S m-1 | Intermediate channel used to calculate PSALCU01 |
| Oxygen, Beckman/YSI | ml l-1 | Dissolved oxygen concentration from Beckman probe | DOXYPR01 | µmol l-1 | ml l-1 * 44.66 |
| Salinity | - | Practical salinity of the water body | PSALCU01 | - | Intermediate channel used for the calculation of PSALCC01. |
| Temperature [ITS-90] | °C | Temperature of the water column by CTD | TEMPCU01 | °C | Intermediate channel used for the calculation of TEMPCC01. |
| Voltage 2 | Volts | Voltage from CTD PAR sensor | LVLTLD01 | Volts | Intermediate channel used for the calculation of IRRDUV01. |
| Voltage 3 | Volts | Beam transmissometer voltage | TVLTCR01 | Volts | Intermediate channel used for the calculation of ATTNMR01 |
| Voltage 4 | Volts | Voltage from CTD SCUFA Turner fluorometer. | FVLTWS01 | Volts | No further calibration available |
| - | - | Potential temperature of water body | POTMCV01 | °C | Generated by BODC using UNESCO Report 38 (1981) algorithm with parameters PSALCC01 and TEMPCC01. |
| - | - | Sigma-theta | SIGTPR01 | kg m-3 | Generated by BODC using the Fofonoff and Millard (1982) algorithm |
| - | - | PAR | IRRDUV01 | µE m-2s-1 | Generated by BODC from calibration of LVLTLD01 |
| - | - | Beam Attenuation | ATTNMR01 | m-1 | Generated by BODC from calibration of TVLTCR01 |
| - | - | Salinity | PSALCC01 | °C | Generated by BODC from calibration of PSALCU01 |
| - | - | Temperature | TEMPCC01 | °C | Generated by BODC from calibration of TEMPCU01 |
| - | - | Oxygen saturation | OXYSBB01 | % | Generated by BODC during transfer using the Benson and Krause (1984) algorithm. |
References
Benson, B.B. and Krause, D., 1984. The concentration and isotopic fractionation of oxygen dissolved in freshwater and seawater in equilibrium with the atmosphere. Limnology and Oceanography., 29(3), 620-632
Fofonoff, N.P. and Millard, R.C., 1983. Algorithms for computations of fundamental properties of seawater. UNESCO Technical Papers in Marine Science No. 44, 53pp.
UNESCO, 1981. Background papers and supporting data on the International Equation of State of Seawater 1980. UNESCO Technical Papers in Marine Science No. 38, 192pp
Screening
Reformatted CTD data were transferred onto a graphics work station for visualisation using the in-house editor EDSERPLO. Downcasts and upcasts were differentiated and the limits manually flagged. No data values were edited or deleted.
Banking
Once quality control screening was complete, the CTD downcasts were binned against pressure at 0.5 dbar increments. During binning, BODC exclude flagged data and generate interpolated values to fill in gaps in the increment sequence, where necessary. Finally, the CTD downcasts were banked. Intermediate channels were excluded from final banking, for example where an uncalibrated channel was processed to give a calibrated channel, the uncalibrated channel was dropped. However, where no calibrations were available, then the voltage or uncalibrated channel was banked.
Calibrations
Salinity
Independent salinity samples, obtained from the CTD rosette, were used to calibrate the CTD. Three data points were deemed to be outliers (casts C002, C005 and C013) and were removed from the analysis. The salinity offset (bottle salinity - CTD salinity) was examined to see if it varied with pressure, attenuation or bottle salinity. There was a lot of scatter present in the calibration data set, however, a significant relationship at 95% confidence was found between offset and bottle salinity. This allowed a calibration equation to be derived as follows, based on 32 observations:
| Calibrated salinity = CTD salinity * 1.0623 - 1.9758 |
The calibration residuals ranged from -0.0707 to 0.0618
Temperature
36 independent temperature values were compared to pressure and CTD temperature. Three data points were identified as outliers (casts C002, C005 and C013) and were removed from the analysis. The offset between CTD temperature and SBE-35 temperature were found not to be significantly different from zero at 95% confidence. Therefore, there was no adjustment to the CTD temperature resulting from the application of manufacturer's coefficients during initial processing.
Pressure
There were no casts where the CTD pressure was logging in air. No adjustments were made to the values resulting from application of manufacturer's coefficients during the initial processing.
Beam attenuation
Coefficients M and B were calculated, allowing calibration of the transmissometer with air readings taken during the cruise. M and B are calculated according to SBE Application Note No. 7:
| M = (Tw/W0)*(A0-Y0)/(A1-Y1) |
| B= -M*Y1 |
Where Tw is the percent transmission for pure water for the instrument (92.98%); W0 is the voltage output in pure water (4.649 volts); A0 is the manufacturer's air voltage (4.661 volts); Y0 is the manufacturer's blocked path voltage (0.000 volts); A1 is the cruise maximum air voltage (4.526 volts); Y1 is the current blocked path voltage (0.0000 volts). For this cruise, M and B were calculated to be 20.5966 and 0, respectively.
M and B are then inserted into the following equations (from SBE Application Note No. 7) to obtain calibrated beam attenuation:
| Light transmission [%] = (M * voltage output) + B |
| Beam attenuation coefficient c = - (1/z) * ln (light transmission [decimal]) |
Where M and B are the calibration coefficients, z is the transmissometer path length (0.2m), light transmission[decimal] is light transmission [%] divided by 100, c = beam attenuation (m-1)
PAR
The LI-COR LI-192SB sensor number 33 was calibrated from raw voltages using the Cefas supplied equation:
| PAR = 0.157508*exp(volts*3.42410) |
Project Information
Proudman Oceanographic Laboratory Coastal Observatory
The Coastal Observatory was established by Proudman Oceanographic Laboratory as a coastal zone real time observing and monitoring system. The main objective is to understand a coastal sea's response both to natural forcing and to the consequences of human activity. Near real-time measurements will be integrated with coupled models into a pre-operational coastal prediction system whose results will be displayed on the World Wide Web.
The Observatory is expected to grow and evolve as resources and technology allow, all the while building up long time series. A site selection pilot study was carried out in September 2001 and the Observatory became operational in August 2002.
The site is located in Liverpool Bay and is subject to typical coastal sea processes, with strong tides, occasional large storm surges and waves, freshwater input, stable and unstable stratification, high suspended sediment concentration and biogeochemical interaction. Measurements and monitoring will focus on the impacts of storms, variations in river discharge (especially the Mersey), seasonality and blooms in Liverpool Bay.
A variety of methods will be used to obtain measurements, including:
- Moored instruments for in situ time series of currents, temperature and salinity profiles, and surface waves and meteorology. It is hoped that turbidity and chlorophyll measurements will be made at another site as the Observatory progresses;
- The Cefas Smartbuoy for surface properties such as nutrients and chlorophyll, starting late 2002;
- R.V. Prince Madog to carry out spatial surveys and service moorings;
- Instrumented ferries for near surface temperature, salinity, turbidity, chlorophyll and nutrients. The first route will be Liverpool to Douglas, Isle of Man, starting late 2002;
- Drifters for surface currents and properties such as temperature and salinity, starting in 2004;
- Tide gauges, with sensors for meteorology, waves, temperature and salinity, where appropriate;
- Meteorological data from Bidston Observatory and Hilbre Island, HF radar and tide gauge sites;
- Shore-based HF radar measuring waves and surface currents out to a range of 50 km, starting in 2003;
- Satellite data, with infrared for sea surface temperature and visible for chlorophyll and suspended sediment.
The partners currently involved with the project are listed below:
- Proudman Oceanographic Laboratory
- British Oceanographic Data Centre
- UK Meteorological Office
- Centre for Environment, Fisheries and Aquaculture Science
- Environment Agency
- Liverpool University and Port Erin Marine Laboratory
- Bangor University School of Ocean Sciences
- National Oceanography Centre Southampton
- Department of Agriculture and Rural Development in Northern Ireland
A summary of Coastal Observatory cruises to date on R.V. Prince Madog is given in the table below:
| Year | No. of cruises | Work summary |
|---|---|---|
| 2001 | 1 | Site selection and pilot study. 95 CTD casts. |
| 2002 | 4 | POL moorings deployed and serviced Cefas Waverider and SmartBuoy deployed and serviced 103 CTD casts |
| 2003 | 10 | POL moorings serviced Cefas Waverider and SmartBuoy serviced 341 CTD/LISST casts |
| 2004 | 9 | POL moorings serviced Cefas Waverider and SmartBuoy serviced 347 CTD/LISST casts |
| 2005 | 9 | POL moorings serviced Cefas Waverider and SmartBuoy serviced 268 CTD/LISST casts |
| 2006 | 11 | POL moorings serviced Cefas Waverider and SmartBuoy serviced 508 CTD/LISST casts |
| 2007 | 9 | POL moorings serviced Cefas Waverider and SmartBuoy serviced 471 CTD/LISST casts |
| 2008 | 9 | POL moorings serviced Cefas Waverider and SmartBuoy serviced 260 CTD/LISST casts |
| 2009 | 7 | POL moorings serviced Cefas Waverider and SmartBuoy serviced 213 CTD/LISST casts |
| 2010 | 8 | POL moorings serviced Cefas Waverider and SmartBuoy serviced 268 CTD/LISST casts |
| 2011 | 6 | POL moorings serviced Cefas Waverider and SmartBuoy serviced 307 CTD/LISST casts to date, ongoing |
Data Activity or Cruise Information
Cruise
| Cruise Name | PD35/06 |
| Departure Date | 2006-11-01 |
| Arrival Date | 2006-11-02 |
| Principal Scientist(s) | Phil J Knight (Proudman Oceanographic Laboratory) |
| Ship | RV Prince Madog |
Complete Cruise Metadata Report is available here
Fixed Station Information
Fixed Station Information
| Station Name | Coastal Observatory Site 17 |
| Category | Offshore area |
| Latitude | 53° 46.90' N |
| Longitude | 3° 38.96' W |
| Water depth below MSL | 33.5 m |
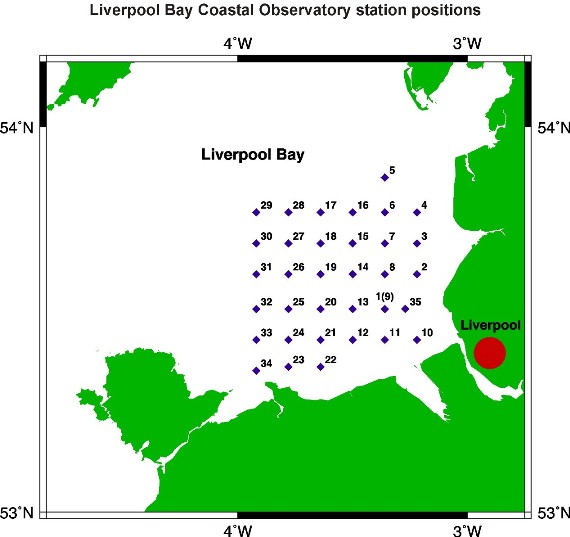
Liverpool Bay Coastal Observatory Site 17
This station is one of 34 stations regularly visited by the Proudman Oceanographic Laboratory (POL) as part of the Liverpool Bay Coastal Observatory. During each site visit, CTD profiles are taken. The station lies within a box of mean water depth 33.5 m with the following co-ordinates:
| Box Corner | Latitude | Longitude |
|---|---|---|
| North-west corner | 53.78593° | -3.66661° |
| South-east corner | 53.77752° | -3.63216° |
The position of this station relative to the other POL Coastal Observatory sites can be seen from the figure below.
CTD Sampling History
| Year | Number of Visits | Total Casts per year |
| 2011 | 5 | 5 |
| 2010 | 5 | 5 |
| 2009 | 4 | 4 |
| 2008 | 4 | 4 |
| 2007 | 7 | 7 |
| 2006 | 7 | 7 |
| 2005 | 7 | 7 |
| 2004 | 8 | 8 |
| 2003 | 8 | 8 |
| 2002 | 2 | 2 |
The CTD instrument package for these cruises was a Sea-Bird 911plus, with beam transmissometer, fluorometer, LICOR PAR sensor, LISST-25, and oxygen sensor.
Related Fixed Station activities are detailed in Appendix 1
BODC Quality Control Flags
The following single character qualifying flags may be associated with one or more individual parameters with a data cycle:
| Flag | Description |
|---|---|
| Blank | Unqualified |
| < | Below detection limit |
| > | In excess of quoted value |
| A | Taxonomic flag for affinis (aff.) |
| B | Beginning of CTD Down/Up Cast |
| C | Taxonomic flag for confer (cf.) |
| D | Thermometric depth |
| E | End of CTD Down/Up Cast |
| G | Non-taxonomic biological characteristic uncertainty |
| H | Extrapolated value |
| I | Taxonomic flag for single species (sp.) |
| K | Improbable value - unknown quality control source |
| L | Improbable value - originator's quality control |
| M | Improbable value - BODC quality control |
| N | Null value |
| O | Improbable value - user quality control |
| P | Trace/calm |
| Q | Indeterminate |
| R | Replacement value |
| S | Estimated value |
| T | Interpolated value |
| U | Uncalibrated |
| W | Control value |
| X | Excessive difference |
SeaDataNet Quality Control Flags
The following single character qualifying flags may be associated with one or more individual parameters with a data cycle:
| Flag | Description |
|---|---|
| 0 | no quality control |
| 1 | good value |
| 2 | probably good value |
| 3 | probably bad value |
| 4 | bad value |
| 5 | changed value |
| 6 | value below detection |
| 7 | value in excess |
| 8 | interpolated value |
| 9 | missing value |
| A | value phenomenon uncertain |
| B | nominal value |
| Q | value below limit of quantification |
Appendix 1: Coastal Observatory Site 17
Related series for this Fixed Station are presented in the table below. Further information can be found by following the appropriate links.
If you are interested in these series, please be aware we offer a multiple file download service. Should your credentials be insufficient for automatic download, the service also offers a referral to our Enquiries Officer who may be able to negotiate access.
| Series Identifier | Data Category | Start date/time | Start position | Cruise |
|---|---|---|---|---|
| 979326 | CTD or STD cast | 2007-02-16 02:15:00 | 53.78383 N, 3.6425 W | RV Prince Madog PD02/07 |
| 937747 | CTD or STD cast | 2007-04-20 00:32:00 | 53.7835 N, 3.64017 W | RV Prince Madog PD06/07 |
| 942203 | CTD or STD cast | 2007-05-17 04:13:00 | 53.78333 N, 3.64567 W | RV Prince Madog PD09/07 |
| 942910 | CTD or STD cast | 2007-06-21 01:28:00 | 53.78333 N, 3.6435 W | RV Prince Madog PD13/07 |
| 943360 | CTD or STD cast | 2007-07-27 04:06:00 | 53.7815 N, 3.641 W | RV Prince Madog PD16/07 |
| 943777 | CTD or STD cast | 2007-08-30 03:46:00 | 53.781 N, 3.65117 W | RV Prince Madog PD20/07 |
| 945735 | CTD or STD cast | 2007-10-04 04:28:00 | 53.78267 N, 3.64367 W | RV Prince Madog PD23/07 |
| 948192 | CTD or STD cast | 2008-05-15 10:04:00 | 53.78267 N, 3.65117 W | RV Prince Madog PD14/08 |
| 948616 | CTD or STD cast | 2008-06-25 22:23:00 | 53.78467 N, 3.64283 W | RV Prince Madog PD19/08 |
| 949447 | CTD or STD cast | 2008-07-31 04:47:00 | 53.78367 N, 3.6455 W | RV Prince Madog PD23/08 |
| 949970 | CTD or STD cast | 2008-12-10 23:14:00 | 53.78217 N, 3.65033 W | RV Prince Madog PD37/08 |
| 950264 | CTD or STD cast | 2009-02-05 18:40:00 | 53.78117 N, 3.64433 W | RV Prince Madog PD02/09B |
| 951280 | CTD or STD cast | 2009-04-01 14:46:00 | 53.7845 N, 3.6475 W | RV Prince Madog PD12/09 |
| 953563 | CTD or STD cast | 2009-05-12 14:35:00 | 53.782 N, 3.66667 W | RV Prince Madog PD18/09 |
| 1024165 | CTD or STD cast | 2009-09-15 16:03:00 | 53.7835 N, 3.64533 W | RV Prince Madog PD38/09 |
| 1090451 | CTD or STD cast | 2010-06-09 18:26:00 | 53.78267 N, 3.64833 W | RV Prince Madog PD17/10 |
| 1091116 | CTD or STD cast | 2010-07-08 16:42:00 | 53.78333 N, 3.6415 W | RV Prince Madog PD21/10 |
| 1112104 | CTD or STD cast | 2010-08-11 15:30:00 | 53.7825 N, 3.64483 W | RV Prince Madog PD29/10 |
| 1113979 | CTD or STD cast | 2010-09-28 14:35:00 | 53.78417 N, 3.64433 W | RV Prince Madog PD36/10 |
| 1148875 | CTD or STD cast | 2011-01-12 15:21:00 | 53.78533 N, 3.644 W | RV Prince Madog PD01/11 |
| 1149749 | CTD or STD cast | 2011-03-16 18:25:00 | 53.785 N, 3.64467 W | RV Prince Madog PD07/11 |
| 1117483 | CTD or STD cast | 2011-04-19 18:13:00 | 53.783 N, 3.64033 W | RV Prince Madog PD11/11 |
| 1118370 | CTD or STD cast | 2011-09-19 17:06:00 | 53.78367 N, 3.64367 W | RV Prince Madog PD25/11 |
| 1353007 | Water sample data | 2011-09-19 17:08:00 | 53.78368 N, 3.64362 W | RV Prince Madog PD25/11 |
