Metadata Report for BODC Series Reference Number 1137540
Metadata Summary
Problem Reports
Data Access Policy
Narrative Documents
Project Information
Data Activity or Cruise Information
Fixed Station Information
BODC Quality Flags
SeaDataNet Quality Flags
Metadata Summary
Data Description |
|||||||||||||||||||||||||||||||||||||||||||||||||||||||||||||||||
|
|||||||||||||||||||||||||||||||||||||||||||||||||||||||||||||||||
Data Identifiers |
|||||||||||||||||||||||||||||||||||||||||||||||||||||||||||||||||
|
|||||||||||||||||||||||||||||||||||||||||||||||||||||||||||||||||
Time Co-ordinates(UT) |
|||||||||||||||||||||||||||||||||||||||||||||||||||||||||||||||||
|
|||||||||||||||||||||||||||||||||||||||||||||||||||||||||||||||||
Spatial Co-ordinates | |||||||||||||||||||||||||||||||||||||||||||||||||||||||||||||||||
|
|||||||||||||||||||||||||||||||||||||||||||||||||||||||||||||||||
Parameters |
|||||||||||||||||||||||||||||||||||||||||||||||||||||||||||||||||
|
|||||||||||||||||||||||||||||||||||||||||||||||||||||||||||||||||
|
|||||||||||||||||||||||||||||||||||||||||||||||||||||||||||||||||
Problem Reports
The transmissometer data has values exceeding 100% for each cast. This could be indicative of a problem in the calibration of the instrument.
The backscatter attenuation data has negative values within the series and much of the data appears to be below the sensitivity of the instrument. This could be indicative of a problem with the sensor or in the calibration of the instrument.
Data Access Policy
Public domain data
These data have no specific confidentiality restrictions for users. However, users must acknowledge data sources as it is not ethical to publish data without proper attribution. Any publication or other output resulting from usage of the data should include an acknowledgment.
The recommended acknowledgment is
"This study uses data from the data source/organisation/programme, provided by the British Oceanographic Data Centre and funded by the funding body."
Narrative Documents
Instrument Description
CTD Unit and Auxillary Sensors
A Sea-Bird 9plus CTD system (serial number 09P-46253-0869) used on cruise D368. This was mounted on a 24-way stainless steel rosette frame, equipped with 24 10-litre Niskin bottles. The CTD was fitted with the following scientific sensors:
| Sensor | Serial Number | Last calibration date | Comments |
|---|---|---|---|
| Digiquartz Pressure | 100898 | 31st July 2009 | - |
| Primary Temperature SBE-3P | 3P-4116 | 17th December 2010 | - |
| Secondary Temperature SBE-3P | 3P-4782 | 17th December 2010 | - |
| Primary Conductivity SBE-4C | 04C-2580 | 17th December 2010 | - |
| Secondary Conductivity SBE-4C | 04C-2841 | 17th December 2010 | - |
| Tritech PA200 Altimeter | 6196.118171 | 14th November 2006 | - |
| Sea-Bird SBE 43 dissolved oxygen sensor | 43-1940 | 16th September 2010 | - |
| Chelsea Aquatracka MkIII fluorometer | 088-2050-095 | 21st April 2011 | - |
| Chelsea MkII Alphatracka Transmissometer (25cm path) | 07-6075-001 | 5th October 2010 | - |
| TRDI WHM300kHz LADCP | 13329 | - | - |
| WETLabs BBRTD Light Scatter Sensor | BBRTD-169 | 14th April 2010 | - |
Sea-Bird Electronics SBE 911 and SBE 917 series CTD profilers
The SBE 911 and SBE 917 series of conductivity-temperature-depth (CTD) units are used to collect hydrographic profiles, including temperature, conductivity and pressure as standard. Each profiler consists of an underwater unit and deck unit or SEARAM. Auxiliary sensors, such as fluorometers, dissolved oxygen sensors and transmissometers, and carousel water samplers are commonly added to the underwater unit.
Underwater unit
The CTD underwater unit (SBE 9 or SBE 9 plus) comprises a protective cage (usually with a carousel water sampler), including a main pressure housing containing power supplies, acquisition electronics, telemetry circuitry, and a suite of modular sensors. The original SBE 9 incorporated Sea-Bird's standard modular SBE 3 temperature sensor and SBE 4 conductivity sensor, and a Paroscientific Digiquartz pressure sensor. The conductivity cell was connected to a pump-fed plastic tubing circuit that could include auxiliary sensors. Each SBE 9 unit was custom built to individual specification. The SBE 9 was replaced in 1997 by an off-the-shelf version, termed the SBE 9 plus, that incorporated the SBE 3 plus (or SBE 3P) temperature sensor, SBE 4C conductivity sensor and a Paroscientific Digiquartz pressure sensor. Sensors could be connected to a pump-fed plastic tubing circuit or stand-alone.
Temperature, conductivity and pressure sensors
The conductivity, temperature, and pressure sensors supplied with Sea-Bird CTD systems have outputs in the form of variable frequencies, which are measured using high-speed parallel counters. The resulting count totals are converted to numeric representations of the original frequencies, which bear a direct relationship to temperature, conductivity or pressure. Sampling frequencies for these sensors are typically set at 24 Hz.
The temperature sensing element is a glass-coated thermistor bead, pressure-protected inside a stainless steel tube, while the conductivity sensing element is a cylindrical, flow-through, borosilicate glass cell with three internal platinum electrodes. Thermistor resistance or conductivity cell resistance, respectively, is the controlling element in an optimized Wien Bridge oscillator circuit, which produces a frequency output that can be converted to a temperature or conductivity reading. These sensors are available with depth ratings of 6800 m (aluminium housing) or 10500 m (titanium housing). The Paroscientific Digiquartz pressure sensor comprises a quartz crystal resonator that responds to pressure-induced stress, and temperature is measured for thermal compensation of the calculated pressure.
Additional sensors
Optional sensors for dissolved oxygen, pH, light transmission, fluorescence and others do not require the very high levels of resolution needed in the primary CTD channels, nor do these sensors generally offer variable frequency outputs. Accordingly, signals from the auxiliary sensors are acquired using a conventional voltage-input multiplexed A/D converter (optional). Some Sea-Bird CTDs use a strain gauge pressure sensor (Senso-Metrics) in which case their pressure output data is in the same form as that from the auxiliary sensors as described above.
Deck unit or SEARAM
Each underwater unit is connected to a power supply and data logging system: the SBE 11 (or SBE 11 plus) deck unit allows real-time interfacing between the deck and the underwater unit via a conductive wire, while the submersible SBE 17 (or SBE 17 plus) SEARAM plugs directly into the underwater unit and data are downloaded on recovery of the CTD. The combination of SBE 9 and SBE 17 or SBE 11 are termed SBE 917 or SBE 911, respectively, while the combinations of SBE 9 plus and SBE 17 plus or SBE 11 plus are termed SBE 917 plus or SBE 911 plus.
Specifications
Specifications for the SBE 9 plus underwater unit are listed below:
| Parameter | Range | Initial accuracy | Resolution at 24 Hz | Response time |
|---|---|---|---|---|
| Temperature | -5 to 35°C | 0.001°C | 0.0002°C | 0.065 sec |
| Conductivity | 0 to 7 S m-1 | 0.0003 S m-1 | 0.00004 S m-1 | 0.065 sec (pumped) |
| Pressure | 0 to full scale (1400, 2000, 4200, 6800 or 10500 m) | 0.015% of full scale | 0.001% of full scale | 0.015 sec |
Further details can be found in the manufacturer's specification sheet.
Chelsea Technologies Group Aquatracka MKIII fluorometer
The Chelsea Technologies Group Aquatracka MKIII is a logarithmic response fluorometer. Filters are available to enable the instrument to measure chlorophyll, rhodamine, fluorescein and turbidity.
It uses a pulsed (5.5 Hz) xenon light source discharging along two signal paths to eliminate variations in the flashlamp intensity. The reference path measures the intensity of the light source whilst the signal path measures the intensity of the light emitted from the specimen under test. The reference signal and the emitted light signals are then applied to a ratiometric circuit. In this circuit, the ratio of returned signal to reference signal is computed and scaled logarithmically to achieve a wide dynamic range. The logarithmic conversion accuracy is maintained at better than one percent of the reading over the full output range of the instrument.
Two variants of the instrument are available, both manufactured in titanium, capable of operating in depths from shallow water down to 2000 m and 6000 m respectively. The optical characteristics of the instrument in its different detection modes are visible below:
| Excitation | Chlorophyll a | Rhodamine | Fluorescein | Turbidity |
|---|---|---|---|---|
| Wavelength (nm) | 430 | 500 | 485 | 440* |
| Bandwidth (nm) | 105 | 70 | 22 | 80* |
| Emission | Chlorophyll a | Rhodamine | Fluorescein | Turbidity |
| Wavelength (nm) | 685 | 590 | 530 | 440* |
| Bandwidth (nm) | 30 | 45 | 30 | 80* |
* The wavelengths for the turbidity filters are customer selectable but must be in the range 400 to 700 nm. The same wavelength is used in the excitation path and the emission path.
The instrument measures chlorophyll a, rhodamine and fluorescein with a concentration range of 0.01 µg l-1 to 100 µg l-1. The concentration range for turbidity is 0.01 to 100 FTU (other wavelengths are available on request).
The instrument accuracy is ± 0.02 µg l-1 (or ± 3% of the reading, whichever is greater) for chlorophyll a, rhodamine and fluorescein. The accuracy for turbidity, over a 0 - 10 FTU range, is ± 0.02 FTU (or ± 3% of the reading, whichever is greater).
Further details are available from the Aquatracka MKIII specification sheet.
Chelsea Technologies Group ALPHAtracka and ALPHAtracka II transmissometers
The Chelsea Technologies Group ALPHAtracka (the Mark I) and its successor, the ALPHAtracka II (the Mark II), are both accurate (< 0.3 % fullscale) transmissometers that measure the beam attenuation coefficient at 660 nm. Green (565 nm), yellow (590 nm) and blue (470 nm) wavelength variants are available on special order.
The instrument consists of a Transmitter/Reference Assembly and a Detector Assembly aligned and spaced apart by an open support frame. The housing and frame are both manufactured in titanium and are pressure rated to 6000 m depth.
The Transmitter/Reference housing is sealed by an end cap. Inside the housing an LED light source emits a collimated beam through a sealed window. The Detector housing is also sealed by an end cap. A signal photodiode is placed behind a sealed window to receive the collimated beam from the Transmitter.
The primary difference between the ALPHAtracka and ALPHAtracka II is that the Alphatracka II is implemented with surface-mount technology; this has enabled a much smaller diameter pressure housing to be used while retaining exactly the same optical train as in the Mark I. Data from the Mark II version are thus fully compatible with that already obtained with the Mark I. The performance of the Mark II is further enhanced by two electronic developments from Chelsea Technologies Group - firstly, all items are locked in a signal nulling loop of near infinite gain and, secondly, the signal output linearity is inherently defined by digital circuitry only.
Among other advantages noted above, these features ensure that the optical intensity of the Mark II, indicated by the output voltage, is accurately represented by a straight line interpolation between a reading near full-scale under known conditions and a zero reading when blanked off.
For optimum measurements in a wide range of environmental conditions, the Mark I and Mark II are available in 5 cm, 10 cm and 25 cm path length versions. Output is default factory set to 2.5 volts but can be adjusted to 5 volts on request.
Further details about the Mark II instrument are available from the Chelsea Technologies Group ALPHAtrackaII specification sheet.
WETLabs Single-angle Backscattering Meter ECO BB
An optical scattering sensor that measures scattering at 117°. This angle was determined as a minimum convergence point for variations in the volume scattering function induced by suspended materials and water. The measured signal is less determined by the type and size of the materials in the water and is more directly correlated to their concentration.
Several versions are available, with minor differences in their specifications:
- ECO BB(RT)provides analog or RS-232 serial output with 4000 count range
- ECO BB(RT)D adds the possibility of being deployed in depths up to 6000 m while keeping the capabilities of ECO BB(RT)
- ECO BB provides the capabilities of ECO BB(RT) with periodic sampling
- ECO BBB is similar to ECO BB but with internal batteries for autonomous operation
- ECO BBS is similar to ECO BB but with an integrated anti-fouling bio-wiper
- ECO BBSB has the capabilities of ECO BBS but with internal batteries for autonomous operation
Specifications
| Wavelength | 471, 532, 660 nm |
| Sensitivity (m-1 sr-1) | 1.2 x 10⁻⁵ at 470 nm 7.7 x 10⁻⁶ at 532 nm 3.8 x 10⁻⁶ at 660 nm |
| Typical range | ~0.0024 to 5 m-1 |
| Linearity | 99% R2 |
| Sample rate | up to 8Hz |
| Temperature range | 0 to 30°C |
| Depth rating | 600 m (standard) 6000 m (deep) |
Further details can be found in the manufacturer's specification sheet.
Tritech Digital Precision Altimeter PA200
This altimeter is a sonar ranging device that gives the height above the sea bed when mounted vertically. When mounted in any other attitude the sensor provides a subsea distance. It can be configured to operate on its own or under control from an external unit and can be supplied with simultaneous analogue and digital outputs, allowing them to interface to PC devices, data loggers, telemetry systems and multiplexers.
These instruments can be supplied with different housings, stainless steel, plastic and aluminum, which will limit the depth rating. There are three models available: the PA200-20S, PA200-10L and the PA500-6S, whose transducer options differ slightly.
Specifications
| Transducer options | PA200-20S | P200-10L | PA500-6S |
| Frequency (kHz) | 200 | 200 | 500 |
| Beamwidth (°) | 20 Conical | 10 included conical beam | 6 Conical |
| Operating range | 1 to 100 m 0.7 to 50 m | - | 0.3 to 50 m 0.1 to 10 m |
Common specifications are presented below
| Digital resolution | 1 mm |
| Analogue resolution | 0.25% of range |
| Depth rating | 700 , 2000, 4000 and 6800 m |
| Operating temperature | -10 to 40°C |
Further details can be found in the manufacturer's specification sheet.
BODC Processing
The CTD data were supplied to BODC in 29 MStar files and converted to the BODC internal format (QXF).
During transfer the originator's variables were mapped to unique BODC parameter codes. The following table shows the parameter mapping.
| Originator's variable | Units | Description | BODC Code | Units | Comments |
|---|---|---|---|---|---|
| scan | - | Scan number | - | - | Not transferred - will be superseded in BODC processing |
| time | - | Time | - | - | Not transferred - will be superseded in BODC processing |
| press | decibars | Pressure (spatial co-ordinate) exerted by the water body by profiling pressure sensor and corrected to read zero at sea level. | PRESPR01 | decibars | - |
| pressure_temp | degC | - | - | - | Not transferred - not an environmental variable |
| temp | degC | Temperature of the water body by CTD | TEMPST01 | degC | - |
| temp1 | degC | Temperature of the water body by CTD | - | - | Secondary channel, not retained |
| temp2 | degC | Temperature of the water body by CTD | - | - | Secondary channel, not retained |
| cond | mS/cm | Electrical conductivity of the water body by in-situ conductivity cell and calibration against independent measurements | CNCLCCI1 | Siemens per metre | cond divided by 10 |
| cond1 | mS/cm | Electrical conductivity of the water body by CTD | - | - | Secondary channel, not retained |
| cond2 | mS/cm | Electrical conductivity of the water body by CTD | - | - | Secondary channel, not retained |
| altimeter | m | Height above bed in the water body | AHSFZZ01 | m | - |
| oxygen | umol/l | Concentration of oxygen {O2} per unit volume of the water body [dissolved phase] by Sea-Bird SBE 43 sensor and calibration against sample data | DOXYSC01 | Micromoles per litre | - |
| fluor | ug/l | Concentration of chlorophyll-a {chl-a} per unit volume of the water body [particulate phase] by in-situ chlorophyll fluorometer and manufacturer's calibration applied | CPHLPM01 | mg/m3 | ug/l=mg/m3 |
| trans | % | Transmittance (red light wavelength) per 25cm of the water body by 25cm path length red light transmissometer | POPTDR01 | % | - |
| turbidity | per metre per nanometre per steradian | Attenuance due to backscatter (660 nm wavelength at 117 degree incidence) by the water body [particulate phase] by in-situ optical backscatter measurement | BB117R01 | per metre per nanometre per steradian | - |
| psal | pss-78 | Practical salinity of the water body by CTD and computation using UNESCO 1983 algorithm | PSALST01 | pss-78 | - |
| psal1 | pss-78 | Practical salinity of the water body by CTD | - | - | Secondary channel, not retained |
| psal2 | pss-78 | Practical salinity of the water body by CTD and computation using UNESCO 1983 algorithm and calibration against independent measurements | - | - | Secondary channel, not retained |
| depth | m | Depth below surface (sampling event start) of the water body by profiling pressure sensor and conversion to depth using unspecified algorithm. | DEPHPR01 | m | - |
| potemp | degC | Potential Temperature | - | - | Not transferred - can be calculated from pressure, salinity and temperature |
| potemp1 | degC | Potential Temperature | - | - | Not transferred - can be calculated from pressure, salinity and temperature |
| potemp2 | degC | Potential Temperature | - | - | Not transferred - can be calculated from pressure, salinity and temperature |
Following transfer the data were screened using BODC in-house visualisation software. Suspect data values were assigned the appropriate BODC data quality flag. Missing data values, where present, were changed to the missing data value and assigned a BODC data quality flag
Originator's Data Processing
Sampling strategy
A Stainless Steel framed Conductivity-Temperature-Depth (CTD) unit was used on D368 to produce vertical profiles of the temperature and salinity of the water column. In total 29 CTD profiles were conducted during D368.
Data Acquisition and Initial Processing
The data were processed using MStar routines. Further details on the processing can be found in the cruise report.
The processed data, together with the raw Sea-Bird, configuration and bottle files, were supplied to BODC for banking.
Project Information
The Global Ocean Ship-based Hydrographic Investigations Program (GO-SHIP) project document
The Global Ocean Ship-based Hydrographic Investigations Program (GO-SHIP) brings together scientists with interests in physical oceanography, the carbon cycle, marine biogeochemistry and ecosystems, and other users and collectors of ocean interior data to develop a sustained global network of hydrographic sections as part of the Global Ocean / Climate Observing System.
The GO-SHIP Panel was established in 2007 by the IOCCP and CLIVAR to develop a strategy for a sustained global repeat hydrography program as a contribution to the OceanObs09 Conference (September 2009) and to revise the 1994 WOCE hydrographic program manual. Based on community discussions at the OceanObs09 Conference, the Panel recommended the development of a sustained repeat hydrography program to:
- develop formal international agreements for a sustained international repeat ship-based hydrography program, including an internationally-agreed strategy and implementation plan building on the guidelines in the Community White Paper,
- advocate for national contributions to this strategy and participation in the global program,
- provide a central forum for communication and coordination, and
- develop syntheses of hydrographic data, in partnership with national, regional, and global research programs.
The IOCCP and CLIVAR International Project Offices have agreed to provide project office support to this program as it develops.
Project office support for GO-SHIP is provided by the IOC-SCOR International Ocean Carbon Coordination Project (IOCCP) and the Climate Variability and Predictability Project (CLIVAR). Major financial support for this project is provided by the U.S. National Science Foundation through a grant to UNESCO - IOC (OCE - 0715161) and a grant to the Scientific Committee on Oceanic Research (OCE - 0608600) for the IOCCP.
For more information please see the official project website at GO-SHIP
Data Activity or Cruise Information
Cruise
| Cruise Name | D368 |
| Departure Date | 2011-07-15 |
| Arrival Date | 2011-08-04 |
| Principal Scientist(s) | Brian A King (National Oceanography Centre, Southampton) |
| Ship | RRS Discovery |
Complete Cruise Metadata Report is available here
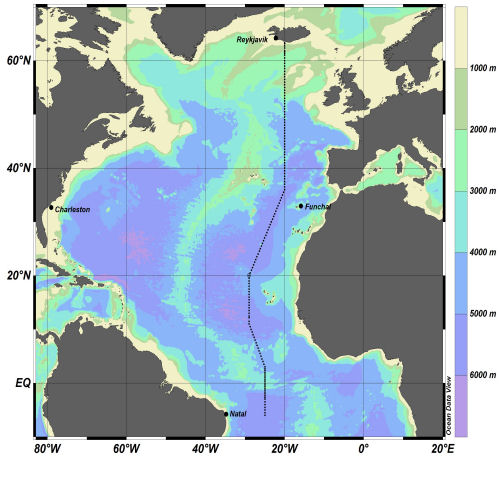
Fixed Station Information
Fixed Station Information
| Station Name | WOCE Station A16N |
| Category | Offshore route/traverse |
World Ocean Circulation Experiment (WOCE) Hydrographic Programme Section A16N
WOCE established a hydrographic section in the Atlantic, from Reykjavik, Iceland to Natal, Brazil, designated A16N. The station geographic boundaries are: 63° 17.58'N to 6° 0.64'S, 29° 00.00'W to 19° 59.99'W
History of Occupations at Section A16N
| Cruise | Date begins | Date ends | Country | PSO |
|---|---|---|---|---|
| R/V OCEANUS 202 | 23-07-1988 | 01-09-1988 | USA | M. McCartney |
| R/V Ronald H. Brown A16N_2003A | 04-06-2003 | 11-08-2003 | USA | J. Bullister |
| RRS Discovery D368 | 15-07-2011 | 04-08-2011 | United Kingdom | B. King |
| R/V Ronald H. Brown 13-04-2013 A16N | 16-07-2013 | 25-09-2013 | USA | M. Baringer / J. Bullister |
Related Fixed Station activities are detailed in Appendix 1
BODC Quality Control Flags
The following single character qualifying flags may be associated with one or more individual parameters with a data cycle:
| Flag | Description |
|---|---|
| Blank | Unqualified |
| < | Below detection limit |
| > | In excess of quoted value |
| A | Taxonomic flag for affinis (aff.) |
| B | Beginning of CTD Down/Up Cast |
| C | Taxonomic flag for confer (cf.) |
| D | Thermometric depth |
| E | End of CTD Down/Up Cast |
| G | Non-taxonomic biological characteristic uncertainty |
| H | Extrapolated value |
| I | Taxonomic flag for single species (sp.) |
| K | Improbable value - unknown quality control source |
| L | Improbable value - originator's quality control |
| M | Improbable value - BODC quality control |
| N | Null value |
| O | Improbable value - user quality control |
| P | Trace/calm |
| Q | Indeterminate |
| R | Replacement value |
| S | Estimated value |
| T | Interpolated value |
| U | Uncalibrated |
| W | Control value |
| X | Excessive difference |
SeaDataNet Quality Control Flags
The following single character qualifying flags may be associated with one or more individual parameters with a data cycle:
| Flag | Description |
|---|---|
| 0 | no quality control |
| 1 | good value |
| 2 | probably good value |
| 3 | probably bad value |
| 4 | bad value |
| 5 | changed value |
| 6 | value below detection |
| 7 | value in excess |
| 8 | interpolated value |
| 9 | missing value |
| A | value phenomenon uncertain |
| B | nominal value |
| Q | value below limit of quantification |
Appendix 1: WOCE Station A16N
Related series for this Fixed Station are presented in the table below. Further information can be found by following the appropriate links.
If you are interested in these series, please be aware we offer a multiple file download service. Should your credentials be insufficient for automatic download, the service also offers a referral to our Enquiries Officer who may be able to negotiate access.
| Series Identifier | Data Category | Start date/time | Start position | Cruise |
|---|---|---|---|---|
| 1851701 | Water sample data | 2011-07-20 05:39:00 | 49.0055 N, 19.9956 W | RRS Discovery D368 |
| 1137503 | CTD or STD cast | 2011-07-20 05:39:58 | 49.0055 N, 19.9956 W | RRS Discovery D368 |
| 1851713 | Water sample data | 2011-07-20 20:49:00 | 48.0253 N, 19.9941 W | RRS Discovery D368 |
| 1137515 | CTD or STD cast | 2011-07-20 20:49:16 | 48.0253 N, 19.9941 W | RRS Discovery D368 |
| 1851725 | Water sample data | 2011-07-21 07:13:00 | 47.0003 N, 19.9879 W | RRS Discovery D368 |
| 1137527 | CTD or STD cast | 2011-07-21 07:13:59 | 47.0003 N, 19.9879 W | RRS Discovery D368 |
| 1851737 | Water sample data | 2011-07-21 16:52:00 | 45.9897 N, 20.0014 W | RRS Discovery D368 |
| 1137539 | CTD or STD cast | 2011-07-21 16:52:29 | 45.9897 N, 20.0014 W | RRS Discovery D368 |
| 1851749 | Water sample data | 2011-07-22 02:25:00 | 45.0024 N, 20.0067 W | RRS Discovery D368 |
| 1137552 | CTD or STD cast | 2011-07-22 12:45:36 | 44.0091 N, 20.0155 W | RRS Discovery D368 |
| 1851750 | Water sample data | 2011-07-22 14:36:00 | 44.0091 N, 20.0155 W | RRS Discovery D368 |
| 1851762 | Water sample data | 2011-07-22 20:30:00 | 43.003 N, 19.9911 W | RRS Discovery D368 |
| 1137564 | CTD or STD cast | 2011-07-22 20:30:14 | 43.003 N, 19.9911 W | RRS Discovery D368 |
| 1851774 | Water sample data | 2011-07-23 06:02:00 | 42.0475 N, 20.0009 W | RRS Discovery D368 |
| 1137576 | CTD or STD cast | 2011-07-23 06:02:23 | 42.0475 N, 20.0009 W | RRS Discovery D368 |
| 1851786 | Water sample data | 2011-07-23 14:59:00 | 41.0009 N, 20.0086 W | RRS Discovery D368 |
| 1137588 | CTD or STD cast | 2011-07-23 14:59:37 | 41.0009 N, 20.0086 W | RRS Discovery D368 |
| 1851798 | Water sample data | 2011-07-24 00:20:00 | 39.9944 N, 19.9832 W | RRS Discovery D368 |
| 1137607 | CTD or STD cast | 2011-07-24 00:20:06 | 39.9944 N, 19.9832 W | RRS Discovery D368 |
| 1851805 | Water sample data | 2011-07-24 09:34:00 | 38.998 N, 20.007 W | RRS Discovery D368 |
| 1137619 | CTD or STD cast | 2011-07-24 09:34:17 | 38.998 N, 20.007 W | RRS Discovery D368 |
| 1851817 | Water sample data | 2011-07-24 19:02:00 | 38.0117 N, 20.0023 W | RRS Discovery D368 |
| 1137620 | CTD or STD cast | 2011-07-24 19:02:09 | 38.0117 N, 20.0023 W | RRS Discovery D368 |
| 1851829 | Water sample data | 2011-07-25 06:43:00 | 36.8436 N, 20.0014 W | RRS Discovery D368 |
| 1137632 | CTD or STD cast | 2011-07-25 06:43:26 | 36.8436 N, 20.0014 W | RRS Discovery D368 |
| 1851830 | Water sample data | 2011-07-25 16:00:00 | 36.0092 N, 20.0106 W | RRS Discovery D368 |
| 1137644 | CTD or STD cast | 2011-07-25 16:00:50 | 36.0092 N, 20.0106 W | RRS Discovery D368 |
| 1851842 | Water sample data | 2011-07-26 02:36:00 | 35.003 N, 20.5454 W | RRS Discovery D368 |
| 1137656 | CTD or STD cast | 2011-07-26 02:36:47 | 35.003 N, 20.5454 W | RRS Discovery D368 |
| 1851854 | Water sample data | 2011-07-26 13:07:00 | 33.9991 N, 21.1263 W | RRS Discovery D368 |
| 1137668 | CTD or STD cast | 2011-07-26 13:07:29 | 33.9991 N, 21.1263 W | RRS Discovery D368 |
| 1851866 | Water sample data | 2011-07-26 23:56:00 | 33.01 N, 21.692 W | RRS Discovery D368 |
| 1137681 | CTD or STD cast | 2011-07-26 23:56:56 | 33.01 N, 21.692 W | RRS Discovery D368 |
| 1851878 | Water sample data | 2011-07-27 10:44:00 | 31.9972 N, 22.2491 W | RRS Discovery D368 |
| 1137693 | CTD or STD cast | 2011-07-27 10:44:40 | 31.9972 N, 22.2491 W | RRS Discovery D368 |
| 1851891 | Water sample data | 2011-07-27 20:45:00 | 31.0079 N, 22.8011 W | RRS Discovery D368 |
| 1137700 | CTD or STD cast | 2011-07-27 20:45:09 | 31.0079 N, 22.8011 W | RRS Discovery D368 |
| 1851909 | Water sample data | 2011-07-28 07:19:00 | 30.004 N, 23.3775 W | RRS Discovery D368 |
| 1137712 | CTD or STD cast | 2011-07-28 07:19:17 | 30.004 N, 23.3775 W | RRS Discovery D368 |
| 1851910 | Water sample data | 2011-07-28 17:42:00 | 28.9979 N, 23.9312 W | RRS Discovery D368 |
| 1137724 | CTD or STD cast | 2011-07-28 17:42:23 | 28.9979 N, 23.9312 W | RRS Discovery D368 |
| 1851922 | Water sample data | 2011-07-29 08:38:00 | 28.018 N, 24.507 W | RRS Discovery D368 |
| 1137736 | CTD or STD cast | 2011-07-29 08:38:21 | 28.018 N, 24.507 W | RRS Discovery D368 |
| 1851934 | Water sample data | 2011-07-29 19:18:00 | 26.9996 N, 25.0612 W | RRS Discovery D368 |
| 1137748 | CTD or STD cast | 2011-07-29 19:18:39 | 26.9996 N, 25.0612 W | RRS Discovery D368 |
| 1851946 | Water sample data | 2011-07-30 06:10:00 | 26.0015 N, 25.6236 W | RRS Discovery D368 |
| 1137761 | CTD or STD cast | 2011-07-30 06:10:32 | 26.0015 N, 25.6236 W | RRS Discovery D368 |
| 1851958 | Water sample data | 2011-07-30 16:08:00 | 24.9945 N, 26.1913 W | RRS Discovery D368 |
| 1137773 | CTD or STD cast | 2011-07-30 16:08:59 | 24.9945 N, 26.1913 W | RRS Discovery D368 |
| 1851971 | Water sample data | 2011-07-31 02:22:00 | 24.0008 N, 26.7593 W | RRS Discovery D368 |
| 1137785 | CTD or STD cast | 2011-07-31 02:22:21 | 24.0008 N, 26.7593 W | RRS Discovery D368 |
| 1851983 | Water sample data | 2011-07-31 10:51:00 | 23.3423 N, 27.1358 W | RRS Discovery D368 |
| 1137797 | CTD or STD cast | 2011-07-31 10:51:46 | 23.3423 N, 27.1358 W | RRS Discovery D368 |
