Metadata Report for BODC Series Reference Number 1180193
Metadata Summary
Problem Reports
Data Access Policy
Narrative Documents
Project Information
Data Activity or Cruise Information
Fixed Station Information
BODC Quality Flags
SeaDataNet Quality Flags
Metadata Summary
Data Description |
|||||||||||||||||||||||||||||||||||||||||
|
|||||||||||||||||||||||||||||||||||||||||
Data Identifiers |
|||||||||||||||||||||||||||||||||||||||||
|
|||||||||||||||||||||||||||||||||||||||||
Time Co-ordinates(UT) |
|||||||||||||||||||||||||||||||||||||||||
|
|||||||||||||||||||||||||||||||||||||||||
Spatial Co-ordinates | |||||||||||||||||||||||||||||||||||||||||
|
|||||||||||||||||||||||||||||||||||||||||
Parameters |
|||||||||||||||||||||||||||||||||||||||||
|
|||||||||||||||||||||||||||||||||||||||||
|
|||||||||||||||||||||||||||||||||||||||||
Problem Reports
No Problem Report Found in the Database
Quality report for FRV Scotia 0512S CTD data
Beam Attenuation
The beam attenuation channel has been identified by the Originator as suspect data and therefore BODC has removed this channel.
Quality report for FRV Scotia CTD 2012 chlorophyll data
Chlorophyll
A calibration generated by the Originator has been applied to the chlorophyll data which has lead, on occasion to negative values within the profiles. All the negative values have been flagged by BODC and should be considered as suspect and be used with caution.
Data Access Policy
Public domain data
These data have no specific confidentiality restrictions for users. However, users must acknowledge data sources as it is not ethical to publish data without proper attribution. Any publication or other output resulting from usage of the data should include an acknowledgment.
The recommended acknowledgment is
"This study uses data from the data source/organisation/programme, provided by the British Oceanographic Data Centre and funded by the funding body."
Narrative Documents
Sea-Bird Dissolved Oxygen Sensor SBE 43 and SBE 43F
The SBE 43 is a dissolved oxygen sensor designed for marine applications. It incorporates a high-performance Clark polarographic membrane with a pump that continuously plumbs water through it, preventing algal growth and the development of anoxic conditions when the sensor is taking measurements.
Two configurations are available: SBE 43 produces a voltage output and can be incorporated with any Sea-Bird CTD that accepts input from a 0-5 volt auxiliary sensor, while the SBE 43F produces a frequency output and can be integrated with an SBE 52-MP (Moored Profiler CTD) or used for OEM applications. The specifications below are common to both.
Specifications
| Housing | Plastic or titanium |
| Membrane | 0.5 mil- fast response, typical for profile applications 1 mil- slower response, typical for moored applications |
| Depth rating | 600 m (plastic) or 7000 m (titanium) 10500 m titanium housing available on request |
| Measurement range | 120% of surface saturation |
| Initial accuracy | 2% of saturation |
| Typical stability | 0.5% per 1000 h |
Further details can be found in the manufacturer's specification sheet.
CTD Instrument Description for FRV Scotia 0512S
Sampling Strategy
CTD casts were carried out on cruise FRV Scotia 0512S using the Sea-Bird SBE911plus. The instrumentation is detailed below.
| CTD unit and auxiliary sensors | Model | Serial # | Calibration Date (YYYY-MM-DD) |
|---|---|---|---|
| Pressure (D.Quartz) | Paroscientific | 64240 | 2010-08-05 |
| Temperature | Sea-Bird SBE911plus | 2041 | 2010-07-22 |
| Conductivity | Sea-Bird SBE911plus | 1615 | 2010-07-22 |
| Temperature | Sea-Bird SBE911plus | 2105 | 2010-07-22 |
| Conductivity | Sea-Bird SBE911plus | 1669 | 2010-07-22 |
| Oxygen | Sea-Bird SBE 43 Dissolved Oxygen Sensor | 0504 | 2010-08-03 |
| Fluorometer | Wet Labs ECO_FL Fluorometer | FLRTD-064 | 2003-11-08 |
| Transmissometer | Wet Labs Transmissometer C-Star | CST-704DR | 2003-08-25 |
No changes to the CTD instrumentation were recorded during these cruises.
Sea-Bird Electronics SBE 911 and SBE 917 series CTD profilers
The SBE 911 and SBE 917 series of conductivity-temperature-depth (CTD) units are used to collect hydrographic profiles, including temperature, conductivity and pressure as standard. Each profiler consists of an underwater unit and deck unit or SEARAM. Auxiliary sensors, such as fluorometers, dissolved oxygen sensors and transmissometers, and carousel water samplers are commonly added to the underwater unit.
Underwater unit
The CTD underwater unit (SBE 9 or SBE 9 plus) comprises a protective cage (usually with a carousel water sampler), including a main pressure housing containing power supplies, acquisition electronics, telemetry circuitry, and a suite of modular sensors. The original SBE 9 incorporated Sea-Bird's standard modular SBE 3 temperature sensor and SBE 4 conductivity sensor, and a Paroscientific Digiquartz pressure sensor. The conductivity cell was connected to a pump-fed plastic tubing circuit that could include auxiliary sensors. Each SBE 9 unit was custom built to individual specification. The SBE 9 was replaced in 1997 by an off-the-shelf version, termed the SBE 9 plus, that incorporated the SBE 3 plus (or SBE 3P) temperature sensor, SBE 4C conductivity sensor and a Paroscientific Digiquartz pressure sensor. Sensors could be connected to a pump-fed plastic tubing circuit or stand-alone.
Temperature, conductivity and pressure sensors
The conductivity, temperature, and pressure sensors supplied with Sea-Bird CTD systems have outputs in the form of variable frequencies, which are measured using high-speed parallel counters. The resulting count totals are converted to numeric representations of the original frequencies, which bear a direct relationship to temperature, conductivity or pressure. Sampling frequencies for these sensors are typically set at 24 Hz.
The temperature sensing element is a glass-coated thermistor bead, pressure-protected inside a stainless steel tube, while the conductivity sensing element is a cylindrical, flow-through, borosilicate glass cell with three internal platinum electrodes. Thermistor resistance or conductivity cell resistance, respectively, is the controlling element in an optimized Wien Bridge oscillator circuit, which produces a frequency output that can be converted to a temperature or conductivity reading. These sensors are available with depth ratings of 6800 m (aluminium housing) or 10500 m (titanium housing). The Paroscientific Digiquartz pressure sensor comprises a quartz crystal resonator that responds to pressure-induced stress, and temperature is measured for thermal compensation of the calculated pressure.
Additional sensors
Optional sensors for dissolved oxygen, pH, light transmission, fluorescence and others do not require the very high levels of resolution needed in the primary CTD channels, nor do these sensors generally offer variable frequency outputs. Accordingly, signals from the auxiliary sensors are acquired using a conventional voltage-input multiplexed A/D converter (optional). Some Sea-Bird CTDs use a strain gauge pressure sensor (Senso-Metrics) in which case their pressure output data is in the same form as that from the auxiliary sensors as described above.
Deck unit or SEARAM
Each underwater unit is connected to a power supply and data logging system: the SBE 11 (or SBE 11 plus) deck unit allows real-time interfacing between the deck and the underwater unit via a conductive wire, while the submersible SBE 17 (or SBE 17 plus) SEARAM plugs directly into the underwater unit and data are downloaded on recovery of the CTD. The combination of SBE 9 and SBE 17 or SBE 11 are termed SBE 917 or SBE 911, respectively, while the combinations of SBE 9 plus and SBE 17 plus or SBE 11 plus are termed SBE 917 plus or SBE 911 plus.
Specifications
Specifications for the SBE 9 plus underwater unit are listed below:
| Parameter | Range | Initial accuracy | Resolution at 24 Hz | Response time |
|---|---|---|---|---|
| Temperature | -5 to 35°C | 0.001°C | 0.0002°C | 0.065 sec |
| Conductivity | 0 to 7 S m-1 | 0.0003 S m-1 | 0.00004 S m-1 | 0.065 sec (pumped) |
| Pressure | 0 to full scale (1400, 2000, 4200, 6800 or 10500 m) | 0.015% of full scale | 0.001% of full scale | 0.015 sec |
Further details can be found in the manufacturer's specification sheet.
WETLabs ECO-FL Fluorometer
The Environmental Characterization Optics series of single channel fluorometers are designed to measure concentrations of natural and synthetic substances in water, and are therefore useful for biological monitoring and dye trace studies. Selected excitation and emission filters allow detection of the following substances: chlorophyll-a, coloured dissolved organic matter (CDOM), uranine (fluorescein), rhodamine, phycoerythrin and phycocyanin.
The ECO-FL can operate continuously or periodically and has two different types of connectors to output the data (analogue and RS-232 serial output). The potted optics block results in long term stability of the instrument and the optional anti-biofouling technology delivers truly long term field measurements.
In addition to the standard model, five variants are available, and the differences between these and the basic ECO-FL are listed below:
- FL(RT): similar to the FL but operates continuously when power is supplied
- FL(RT)D: similar model to the (RT) but has a depth rating of 6000 m
- FLB: includes internal batteries for autonomous operation and periodic sampling
- FLS: similar to FLB but has an integrated anti-fouling bio-wiper
- FLSB: similar to the FLS, but includes internal batteries for autonomous operation
Specifications
| Temperature range | 0 to 30°C |
| Depth rating | 600 m (standard) 6000 m (deep) |
| Linearity | 99 % R2 |
| Chlorophyll-a | |
| Wavelength (excitation/emission) | 470/695 nm |
| Sensitivity | 0.01 µg L-1 |
| Typical range | 0.01 to 125 µg L-1 |
| CDOM | |
| Wavelength (excitation/emission) | 370/460 nm |
| Sensitivity | 0.01 ppb |
| Typical range | 0.09 to 500 ppb |
| Uranine | |
| Wavelength (excitation/emission) | 470/530 nm |
| Sensitivity | 0.07 ppb |
| Typical range | 0.12 to 230 ppb |
| Rhodamine | |
| Wavelength (excitation/emission) | 540/570 nm |
| Sensitivity | 0.01 ppb |
| Typical range | 0.01 to 230 ppb |
| Phycoerythrin | |
| Wavelength (excitation/emission) | 540/570 nm |
| Sensitivity | 0.01 ppb |
| Typical range | 0.01 to 230 ppb |
| Phycocyanin | |
| Wavelength (excitation/emission) | 630/680 nm |
| Sensitivity | 0.15 ppt |
| Typical range | 0.15 to 400 ppt |
Further details can be found in the manufacturer's specification sheet.
BODC CTD Screening
BODC screen both the series header qualifying information and the parameter values in the data cycles themselves.
Header information is inspected for:
- Irregularities such as infeasible values
- Inconsistencies between related information. For example:
- Deepest CTD data cycle is significantly greater than the depth of the sea floor.
- Times of the cruise and the start/end of the data series.
- Length of the record, number of data cycles, cycle interval, clock error and the period over which data were collected.
- Parameters stated as measured and the parameters actually present in the data series.
- Originator's comments on instrument/sampling device performance and data quality.
Documents are written by BODC highlighting irregularities that cannot be resolved.
Data cycles are inspected using depth series plots of all parameters. These presentations undergo screening to detect infeasible values within the data cycles themselves and inconsistencies when comparing adjacent data sets displaced with respect to depth, position or time.
Values suspected of being of non-oceanographic origin may be tagged with the BODC flag denoting suspect value.
The following types of irregularity, each relying on visual detection in the time series plot, are amongst those that may be flagged as suspect:
- Spurious data at the start or end of the record where the instrument was recording in air
- Obvious spikes occurring in the data due electrical problems
- Constant, or near-constant, data channels
If a large percentage of the data is affected by irregularities, deemed abnormal, then instead of flagging the individual suspect values, a caution may be documented.
The following types of inconsistency are detected automatically by software:
- Data points with values outside the expected range for the parameter, as defined by the BODC parameter usage vocabulary.
Inconsistencies between the characteristics of the data set and those of its neighbours are sought, and where necessary, documented. This covers inconsistencies in the following:
- Maximum and minimum values of parameters (spikes excluded).
- Anomalous readings due to the CTD package being bounced through temperature and/or salinity gradients.
This screening of the parameter values seeks to confirm the qualifying information and the source laboratory's comments on the series. In screening and collating information, every care is taken to ensure that errors of BODC's making are not introduced.
FRV Scotia 0512S CTD Originator's data processing
Sampling Strategy
A total of 97 CTD casts were performed by Marine Scotland as part of on going research funded by the Scottish Government, during cruise FRV Scotia 0512S. CTD casts were deployed between 7-20 May 2012, starting east of Stonehaven where trial deployments were conducted. The cruise then journeyed to the JONSIS long term monitoring section off the north coast of Orkney before travelling to the Fair Isle- Munken, Cape Wrath-Munken and Nolso-Flugga long term monitoring sections all located between the Faroe Islands and the north coast of Scotland. Additional casts were taken at ADCP moorings around the Fair Isle - Munken section.
A SBE35 carousel was used to collect the water samples.
Data Processing
The CTD data were processed using the Sea-Bird SeaSoft routines as recommended in the SeaSoft manual for model type Sea-Bird 911plus V2 SEACAT. Pressure data were binned to 1 dbar using SeaSoft. The primary temperature and conductivity channels were adjusted to produce 'edit' channels which Marine Scotland regards as the definitive version of the data. The adjustments consisted of a de-spiking process using Marine Scotland in-house visualisation software and, as necessary, application of a low pass filter as described in Sy (1985). The time was recorded in UTC.
Field Calibrations
Conductivity
A total of 137 water samples were taken by Marine Scotland using a SBE35 carousel to provide a calibration equation for conductivity as follows:
calibrated conductivity (mS cm-1) = measured conductivity x 1.000070 + 0.000550.
The calibration was not applied to the data by the Originator.
Fluorescence
A total of 145 water samples were taken by Marine Scotland using a SBE35 carousel to provide a calibration equation for fluorescence as follows:
calibrated fluorescence (µg l-1) = measured fluorescence x 0.015617 - 2.369828.
The calibration was not applied to the data by the Originator.
Temperature
Marine Scotland examined the latest and the previous manufacturer's calibrations to look at the differences in the temperature recorded. There were no significant differences and therefore Marine Scotland concluded that no further calibrations needed to be undertaken.
Reference
Sy A., 1985. An alternative editing technique for oceanographic data. Deep Sea Research, 32 (12), 1591-1599,
Processing by BODC of FRV Scotia cruises 0512S, 1312S and 1712S CTD data
The data arrived at BODC in 3 concatenated ASCII format files representing cruises FRV Scotia 0512S (97 casts) , 1312S (125 casts) and 1712S (119 casts). The concatenated files were sub-divided into individual files for each cast, using BODC in house Matlab software. These were reformatted to the internal BODC format using transfer function 340. The following table shows how the variables within the files were mapped to appropriate BODC parameter codes:
| Originator's Variable | Units | Description | BODC Parameter Code | Units | Comment |
|---|---|---|---|---|---|
| Pressure | dbar | Pressure (spatial co-ordinate) exerted by the water body by profiling pressure sensor and corrected to read zero at sea level | PRESPR01 | dbar | - |
| Temperature (edit) | Centigrade | Temperature of the water body by CTD or STD | TEMPST01 | °C | Celsius = Centigrade |
| Conductivity (edit) | mS cm-1 | Electrical conductivity of the water body by CTD | CNDCST01 | S m-1 | Conversion of Originators units to BODC units: conductivity(edit) * 0.1. BODC applied Originator calibration during transfer |
| Temperature (pri) | Centigrade | Unadjusted temperature data | N/A | N/A | Primary Temperature. Data were not loaded by BODC as Originator stated Temperature (edit) channel was a quality controlled version of the primary channel |
| Conductivity (pri) | mS cm-1 | Unadjusted conductivity data | N/A | N/A | Primary Conductivity. Data were not loaded by BODC as Originator stated Conductivity (edit) channel was a quality controlled version of the primary channel |
| Temperature (sec) | Centigrade | Unadjusted temperature data | N/A | N/A | Secondary Temperature. Data were not loaded by BODC as Originator stated Temperature (edit) channel was a quality controlled version of the primary channel |
| Conductivity (sec) | mS cm-1 | Unadjusted conductivity data | N/A | N/A | Secondary Conductivity. Data were not loaded by BODC as Originator stated Conductivity (edit) channel was a quality controlled version of the primary channel |
| Fluorescence | µg l-1 | Concentration of chlorophyll-a {chl-a} per unit volume of the water body [particulate phase] by in-situ chlorophyll fluorometer. | CPHLPS01 | mg m-3 | Field samples for calibration taken but not applied by the Originator. BODC applied Originator calibration during transfer |
| Turbidity | NTU | Turbidity of the water body by in-situ optical backscatter measurement and laboratory calibration against formazin | TURBPR01 | NTU | No turbidity data were submitted for cruise FRV Scotia 0512S |
| Beam Attenuation | m-1 | - | - | - | No beam attenuation data were submitted for cruises FRV Scotia 1312S and 1712S. Beam attenuation data were identified by the Originator as suspect, no further processing was carried out. |
| Oxygen % saturation | cm3 dm-3 | - | - | - | Oxygen saturation data supplied by Originator were derived using unknown methodology. No further processing was carried out. |
| Oxygen (ml l-1) | ml l-1 | Concentration of oxygen (O2) per unit volume of the water body (dissolved phase) | DOXYZZXX | µmol l-1 | Conversion of Originators units to BODC units: oxygen (ml l-1) * 44.661. BODC applied Originator calibration during transfer |
| - | - | Saturation of oxygen (O2) in the water body [dissolved plus reactive particulate phase] by Sea-Bird SBE 43 sensor and computation from concentration using Benson and Krause algorithm | OXYSSU01 | % | Derived from PSALST01, TEMPST01 and DOXYZZXX using Benson and Krause algorithm (1984). |
| - | - | Practical salinity of the water body by CTD and computation using UNESCO 1983 algorithm | PSALST01 | Dimensionless | Derived from TEMPST01 and CNDCST01 in transfer using Fofonoff and Millard (1983). |
| - | - | Sigma-theta of the water body by CTD and computation from salinity and potential temperature using UNESCO algorithm | SIGTPR01 | kg m-3 | Derived from PSALST01, TEMPST01 and PRESPR01 in transfer using Fofonoff and Millard (1983). |
The reformatted data were visualised using the in-house EDSERPLO software. Suspect data were marked by adding an appropriate quality control flag, missing data by both setting the data to an appropriate value and setting the quality control flag.
Reference
Fofonoff, P., Millard Jr, R.C., 1983. Algorithms for computation of fundamental properties of seawater.Unesco Technical Papers in Marine Sciences 44, 53 pp.
Benson, B.B., Krause Jr, D., 1984. The concentration and isotopic fractionation of oxygen dissolved in freshwater and seawater in equilibrium with the atmosphere. Limnology and Oceanography 29(3), 620-632 pp.
Project Information
No Project Information held for the Series
Data Activity or Cruise Information
Cruise
| Cruise Name | 0512S |
| Departure Date | 2012-05-07 |
| Arrival Date | 2012-05-22 |
| Principal Scientist(s) | George Slesser (Marine Scotland Aberdeen Marine Laboratory) |
| Ship | FRV Scotia |
Complete Cruise Metadata Report is available here
Fixed Station Information
Fixed Station Information
| Station Name | Faroe-Cape Wrath Transect |
| Category | Offshore route/traverse |
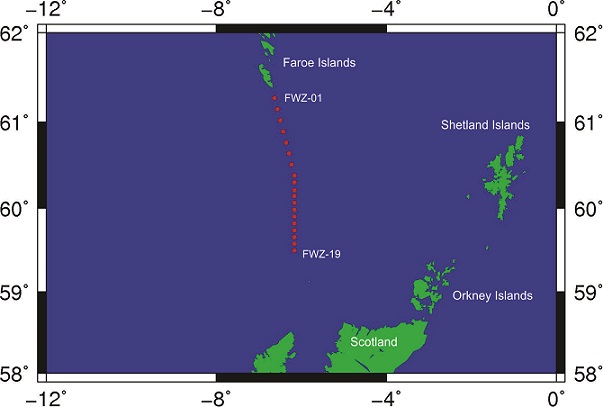
Faroe-Cape Wrath Transect
The Faroe-Cape Wrath transect was started for the THOR (Thermohaline Overturning - at Risk?) project (2007-2013) and has now continued under NACLIM (North Atlantic Climate Variability) project (2012-2017), both projects ran under European Union (EU) Seventh Framework Programme (FP7).
Marine Scotland first sampled the transect in May 2009. Marine Scotland hope to sample this line twice a year (April-May and September-October) and if possible in December.
The stations along this line will be mainly used for CTD deployments although salinity samples will be taken along the line for calibration purposes. Some nutrient samples have been taken by Marine Scotland but it is not anticipated that nutrient sampling will become a regular occurrence.
The Faroese are also sampling this line.
Map of standard stations
Line Stations
Listed below are details of the standard hydrographic stations that form the Faroe-Cape Wrath line.
| Station Name | Latitude | Longitude | Depth (m) | Spacing (nm) |
|---|---|---|---|---|
| FWZ-19 | 59° 30.00' N | 06° 10.00' W | 152 | - |
| FWZ-18 | 59° 34.82' N | 06° 10.00' W | 196 | 4.81 |
| FWZ-17 | 59° 39.64' N | 06° 10.00' W | 220 | 4.81 |
| FWZ-16 | 59° 44.45' N | 06° 10.00' W | 277 | 4.80 |
| FWZ-15 | 59° 49.27' N | 06° 10.00' W | 457 | 4.81 |
| FWZ-14 | 59° 54.09' N | 06° 10.00' W | 600 | 4.81 |
| FWZ-13 | 59° 58.91' N | 06° 10.00' W | 970 | 4.81 |
| FWZ-12 | 60° 03.73' N | 06° 10.00' W | 1082 | 4.81 |
| FWZ-11 | 60° 08.54' N | 06° 10.00' W | 1195 | 4.80 |
| FWZ-10 | 60° 12.76' N | 06° 10.00' W | 1212 | 4.21 |
| FWZ-09 | 60° 18.18' N | 06° 10.00' W | 616 | 5.41 |
| FWZ-08 | 60° 23.00' N | 06° 10.00' W | 423 | 4.81 |
| FWZ-07 | 60° 30.63'N | 06° 13.88'W | 302 | 7.86 |
| FWZ-06 | 60° 38.26'N | 06° 17.77'W | 275 | 7.86 |
| FWZ-05 | 60° 45.89'N | 06° 21.69'W | 184 | 7.86 |
| FWZ-04 | 60° 53.52'N | 06° 25.65'W | 138 | 7.86 |
| FWZ-03 | 61° 01.14'N | 06° 29.63'W | 142 | 7.85 |
| FWZ-02 | 61° 08.76'N | 06° 33.65'W | 125 | 7.85 |
| FWZ-01 | 61° 16.38' N | 06° 37.70' W | 100 | 7.86 |
| - | - | - | Totals | 107.12 |
Faroe - Cape Wrath (extended line)
This line is not shown on the map but may be sampled occasionally.
| Station Name | Latitude | Longitude | Depth (m) | Spacing (nm) |
|---|---|---|---|---|
| FWZ-29 | 58° 36.60' N | 06° 13.09' W | 112 | - |
| FWZ-28 | 58° 42.06' N | 06° 12.18' W | 116 | 5.5 |
| FWZ-27 | 58° 47.42' N | 06° 11.72' W | 116 | 5.4 |
| FWZ-26 | 58° 52.75' N | 06° 11.71' W | 113 | 5.4 |
| FWZ-25 | 58° 58.02' N | 06° 13.41' W | 74 | 5.3 |
| FWZ-24 | 59° 03.36' N | 06° 14.34' W | 63 | 5.4 |
| FWZ-23 | 59° 08.61' N | 06° 14.18' W | 106 | 5.3 |
| FWZ-22 | 59° 13.84' N | 06° 12.02' W | 113 | 5.3 |
| FWZ-21 | 59° 19.21' N | 06° 11.39' W | 148 | 5.4 |
| FWZ-20 | 59° 24.58' N | 06° 10.58' W | 155 | 5.4 |
| - | - | - | Totals | 48.4 |
CTD sampling history
Cruise FRV Scotia 0512S, between 07 May 2012 - 22 May 2012, sampled stations FWZ-01 to FWZ-19 inclusively.
Related Fixed Station activities are detailed in Appendix 1
BODC Quality Control Flags
The following single character qualifying flags may be associated with one or more individual parameters with a data cycle:
| Flag | Description |
|---|---|
| Blank | Unqualified |
| < | Below detection limit |
| > | In excess of quoted value |
| A | Taxonomic flag for affinis (aff.) |
| B | Beginning of CTD Down/Up Cast |
| C | Taxonomic flag for confer (cf.) |
| D | Thermometric depth |
| E | End of CTD Down/Up Cast |
| G | Non-taxonomic biological characteristic uncertainty |
| H | Extrapolated value |
| I | Taxonomic flag for single species (sp.) |
| K | Improbable value - unknown quality control source |
| L | Improbable value - originator's quality control |
| M | Improbable value - BODC quality control |
| N | Null value |
| O | Improbable value - user quality control |
| P | Trace/calm |
| Q | Indeterminate |
| R | Replacement value |
| S | Estimated value |
| T | Interpolated value |
| U | Uncalibrated |
| W | Control value |
| X | Excessive difference |
SeaDataNet Quality Control Flags
The following single character qualifying flags may be associated with one or more individual parameters with a data cycle:
| Flag | Description |
|---|---|
| 0 | no quality control |
| 1 | good value |
| 2 | probably good value |
| 3 | probably bad value |
| 4 | bad value |
| 5 | changed value |
| 6 | value below detection |
| 7 | value in excess |
| 8 | interpolated value |
| 9 | missing value |
| A | value phenomenon uncertain |
| B | nominal value |
| Q | value below limit of quantification |
Appendix 1: Faroe-Cape Wrath Transect
Related series for this Fixed Station are presented in the table below. Further information can be found by following the appropriate links.
If you are interested in these series, please be aware we offer a multiple file download service. Should your credentials be insufficient for automatic download, the service also offers a referral to our Enquiries Officer who may be able to negotiate access.
| Series Identifier | Data Category | Start date/time | Start position | Cruise |
|---|---|---|---|---|
| 1034577 | CTD or STD cast | 2009-05-21 03:38:00 | 59.36033 N, 5.43383 W | FRV Scotia 0709S |
| 1034589 | CTD or STD cast | 2009-05-21 05:08:00 | 59.53183 N, 5.59 W | FRV Scotia 0709S |
| 1034590 | CTD or STD cast | 2009-05-21 06:26:00 | 59.6775 N, 5.63067 W | FRV Scotia 0709S |
| 1034608 | CTD or STD cast | 2009-05-21 07:43:00 | 59.77233 N, 5.71533 W | FRV Scotia 0709S |
| 1034621 | CTD or STD cast | 2009-05-21 09:03:00 | 59.86933 N, 5.7385 W | FRV Scotia 0709S |
| 1034633 | CTD or STD cast | 2009-05-21 10:47:00 | 59.9645 N, 5.80433 W | FRV Scotia 0709S |
| 1034645 | CTD or STD cast | 2009-05-21 12:48:00 | 60.08433 N, 5.87983 W | FRV Scotia 0709S |
| 1034657 | CTD or STD cast | 2009-05-21 14:57:00 | 60.21917 N, 5.95467 W | FRV Scotia 0709S |
| 1034669 | CTD or STD cast | 2009-05-21 16:51:00 | 60.3085 N, 6.004 W | FRV Scotia 0709S |
| 1034670 | CTD or STD cast | 2009-05-21 18:21:00 | 60.3985 N, 6.062 W | FRV Scotia 0709S |
| 1034682 | CTD or STD cast | 2009-05-21 20:22:00 | 60.617 N, 6.2 W | FRV Scotia 0709S |
| 1034694 | CTD or STD cast | 2009-05-21 22:38:00 | 60.89083 N, 6.3625 W | FRV Scotia 0709S |
| 1034701 | CTD or STD cast | 2009-05-22 00:28:00 | 61.14117 N, 6.51317 W | FRV Scotia 0709S |
| 1180181 | CTD or STD cast | 2012-05-10 16:10:00 | 59.49933 N, 6.1675 W | FRV Scotia 0512S |
| 1180200 | CTD or STD cast | 2012-05-10 18:19:00 | 59.65933 N, 6.1695 W | FRV Scotia 0512S |
| 1180212 | CTD or STD cast | 2012-05-10 19:17:00 | 59.73967 N, 6.17 W | FRV Scotia 0512S |
| 1180224 | CTD or STD cast | 2012-05-11 13:13:00 | 59.82117 N, 6.16583 W | FRV Scotia 0512S |
| 1180236 | CTD or STD cast | 2012-05-11 14:41:00 | 59.90167 N, 6.16717 W | FRV Scotia 0512S |
| 1180248 | CTD or STD cast | 2012-05-11 16:29:00 | 59.9815 N, 6.16633 W | FRV Scotia 0512S |
| 1180261 | CTD or STD cast | 2012-05-11 18:32:00 | 60.06183 N, 6.16417 W | FRV Scotia 0512S |
| 1180273 | CTD or STD cast | 2012-05-11 20:19:00 | 60.143 N, 6.16483 W | FRV Scotia 0512S |
| 1180285 | CTD or STD cast | 2012-05-11 22:18:00 | 60.21333 N, 6.16783 W | FRV Scotia 0512S |
| 1180297 | CTD or STD cast | 2012-05-12 00:23:00 | 60.306 N, 6.17067 W | FRV Scotia 0512S |
| 1180304 | CTD or STD cast | 2012-05-12 01:53:00 | 60.38583 N, 6.16867 W | FRV Scotia 0512S |
| 1180316 | CTD or STD cast | 2012-05-12 03:27:00 | 60.50883 N, 6.2315 W | FRV Scotia 0512S |
| 1180328 | CTD or STD cast | 2012-05-12 04:59:00 | 60.638 N, 6.297 W | FRV Scotia 0512S |
| 1180341 | CTD or STD cast | 2012-05-12 06:20:00 | 60.76467 N, 6.3645 W | FRV Scotia 0512S |
| 1180353 | CTD or STD cast | 2012-05-12 07:31:00 | 60.89267 N, 6.43133 W | FRV Scotia 0512S |
| 1180365 | CTD or STD cast | 2012-05-12 08:41:00 | 61.01917 N, 6.49683 W | FRV Scotia 0512S |
| 1180377 | CTD or STD cast | 2012-05-12 09:47:00 | 61.14667 N, 6.563 W | FRV Scotia 0512S |
| 1180389 | CTD or STD cast | 2012-05-12 10:53:00 | 61.274 N, 6.62633 W | FRV Scotia 0512S |
| 1213194 | CTD or STD cast | 2013-05-15 21:10:00 | 61.2705 N, 6.63383 W | FRV Scotia 0513S |
| 1213201 | CTD or STD cast | 2013-05-15 22:15:00 | 61.14933 N, 6.56283 W | FRV Scotia 0513S |
| 1213213 | CTD or STD cast | 2013-05-15 23:27:00 | 61.02017 N, 6.4845 W | FRV Scotia 0513S |
| 1213225 | CTD or STD cast | 2013-05-16 00:35:00 | 60.89533 N, 6.42333 W | FRV Scotia 0513S |
| 1213237 | CTD or STD cast | 2013-05-16 01:36:00 | 60.76533 N, 6.35933 W | FRV Scotia 0513S |
| 1213249 | CTD or STD cast | 2013-05-16 02:38:00 | 60.6385 N, 6.294 W | FRV Scotia 0513S |
| 1213250 | CTD or STD cast | 2013-05-16 03:52:00 | 60.50983 N, 6.2315 W | FRV Scotia 0513S |
| 1213262 | CTD or STD cast | 2013-05-16 05:10:00 | 60.38267 N, 6.16683 W | FRV Scotia 0513S |
| 1213274 | CTD or STD cast | 2013-05-16 06:23:00 | 60.30317 N, 6.16933 W | FRV Scotia 0513S |
| 1213286 | CTD or STD cast | 2013-05-16 07:45:00 | 60.20817 N, 6.15933 W | FRV Scotia 0513S |
| 1213298 | CTD or STD cast | 2013-05-16 09:39:00 | 60.14317 N, 6.16233 W | FRV Scotia 0513S |
| 1213305 | CTD or STD cast | 2013-05-16 11:30:00 | 60.06383 N, 6.1615 W | FRV Scotia 0513S |
| 1213317 | CTD or STD cast | 2013-05-16 13:15:00 | 59.9805 N, 6.16417 W | FRV Scotia 0513S |
| 1213329 | CTD or STD cast | 2013-05-16 14:50:00 | 59.90283 N, 6.16417 W | FRV Scotia 0513S |
| 1213330 | CTD or STD cast | 2013-05-16 16:13:00 | 59.82083 N, 6.16617 W | FRV Scotia 0513S |
| 1213342 | CTD or STD cast | 2013-05-16 17:21:00 | 59.73867 N, 6.1635 W | FRV Scotia 0513S |
| 1213354 | CTD or STD cast | 2013-05-16 18:17:00 | 59.66017 N, 6.16767 W | FRV Scotia 0513S |
| 1213366 | CTD or STD cast | 2013-05-16 19:13:00 | 59.56883 N, 6.16083 W | FRV Scotia 0513S |
| 1213378 | CTD or STD cast | 2013-05-16 19:57:00 | 59.50167 N, 6.16717 W | FRV Scotia 0513S |
| 1215582 | CTD or STD cast | 2013-10-05 12:58:00 | 59.501 N, 6.16917 W | FRV Scotia 1313S |
| 1215594 | CTD or STD cast | 2013-10-05 13:53:00 | 59.58017 N, 6.16533 W | FRV Scotia 1313S |
| 1215601 | CTD or STD cast | 2013-10-05 14:48:00 | 59.65917 N, 6.16817 W | FRV Scotia 1313S |
| 1215613 | CTD or STD cast | 2013-10-05 15:53:00 | 59.74167 N, 6.1675 W | FRV Scotia 1313S |
| 1215625 | CTD or STD cast | 2013-10-05 17:11:00 | 59.81983 N, 6.162 W | FRV Scotia 1313S |
| 1215637 | CTD or STD cast | 2013-10-05 18:25:00 | 59.90267 N, 6.16117 W | FRV Scotia 1313S |
| 1215649 | CTD or STD cast | 2013-10-05 19:50:00 | 59.9845 N, 6.14833 W | FRV Scotia 1313S |
| 1215650 | CTD or STD cast | 2013-10-06 05:07:00 | 60.06233 N, 6.16667 W | FRV Scotia 1313S |
| 1215662 | CTD or STD cast | 2013-10-06 06:43:00 | 60.14217 N, 6.1655 W | FRV Scotia 1313S |
| 1215674 | CTD or STD cast | 2013-10-06 08:20:00 | 60.21283 N, 6.167 W | FRV Scotia 1313S |
| 1215686 | CTD or STD cast | 2013-10-06 09:56:00 | 60.30317 N, 6.167 W | FRV Scotia 1313S |
| 1215698 | CTD or STD cast | 2013-10-06 11:12:00 | 60.38267 N, 6.166 W | FRV Scotia 1313S |
| 1215705 | CTD or STD cast | 2013-10-06 12:49:00 | 60.5105 N, 6.22933 W | FRV Scotia 1313S |
| 1215717 | CTD or STD cast | 2013-10-06 14:15:00 | 60.63767 N, 6.29583 W | FRV Scotia 1313S |
| 1215729 | CTD or STD cast | 2013-10-06 15:42:00 | 60.76467 N, 6.36583 W | FRV Scotia 1313S |
| 1215730 | CTD or STD cast | 2013-10-06 17:15:00 | 60.8925 N, 6.43083 W | FRV Scotia 1313S |
| 1215742 | CTD or STD cast | 2013-10-06 17:51:00 | 60.892 N, 6.428 W | FRV Scotia 1313S |
| 1215754 | CTD or STD cast | 2013-10-06 19:41:00 | 61.01933 N, 6.49333 W | FRV Scotia 1313S |
| 1215766 | CTD or STD cast | 2013-10-06 20:52:00 | 61.146 N, 6.5585 W | FRV Scotia 1313S |
| 1215778 | CTD or STD cast | 2013-10-06 22:12:00 | 61.2715 N, 6.6225 W | FRV Scotia 1313S |
