Metadata Report for BODC Series Reference Number 1905792
Metadata Summary
Problem Reports
Data Access Policy
Narrative Documents
Project Information
Data Activity or Cruise Information
Fixed Station Information
BODC Quality Flags
SeaDataNet Quality Flags
Metadata Summary
Data Description |
|||||||||||||||||||||||||
|
|||||||||||||||||||||||||
Data Identifiers |
|||||||||||||||||||||||||
|
|||||||||||||||||||||||||
Time Co-ordinates(UT) |
|||||||||||||||||||||||||
|
|||||||||||||||||||||||||
Spatial Co-ordinates | |||||||||||||||||||||||||
|
|||||||||||||||||||||||||
Parameters |
|||||||||||||||||||||||||
|
|||||||||||||||||||||||||
|
|||||||||||||||||||||||||
Problem Reports
No Problem Report Found in the Database
Data Access Policy
Open Data
These data have no specific confidentiality restrictions for users. However, users must acknowledge data sources as it is not ethical to publish data without proper attribution. Any publication or other output resulting from usage of the data should include an acknowledgment.
If the Information Provider does not provide a specific attribution statement, or if you are using Information from several Information Providers and multiple attributions are not practical in your product or application, you may consider using the following:
"Contains public sector information licensed under the Open Government Licence v1.0."
Narrative Documents
Shelf Sea Biogeochemistry (SSB) Celtic Deep SmartBuoy moored temperature chain SBE56 data: BODC processing
The data were delivered to BODC within a large matlab stucture containing data collected from each instrument on each deployment of the mooring. The data were transfered to BODC's internal NetCDF format. The following table shows the mapping of originators variables to appropriate BODC parameter codes:
| Originator's Variable | Originator's Units | BODC Parameter Code | BODC Units | Comment |
|---|---|---|---|---|
| Temperature | °C | TEMPPR01 | °C |
The reformatted data were visualised using the in-house EDSERPLO software. Suspect data were marked by adding an appropriate quality control flag, missing data by both setting the data to an appropriate value and setting the quality control flag.
Shelf Sea Biogeochemistry (SSB) Celtic Deep SmartBuoy moored temperature chain data: Originators processing
SmartBuoy setup
CEFAS has many long term SmartBuoy moorings active in the global ocean. For the Shelf Sea Biogeochemistry Project the Celtic Deep SmartBuoy was augmented with a string of temperature loggers (supplied and managed by the National Oceanography Centre) that were nominally suspended between 10 m and 74 m depth. This near continuous dataset covered from 23/3/14 to 15/8/15, nearing 17 months. The six temperature loggers were deployed on the chain and log the temperature every 5 minutes, Sea-Bird SBE 39 temperature and pressure loggers were positioned at the top and bottom on the chain to calculate actual depth, Sea-Bird SBE 56 temperature recorders were positioned at various depths between them. The instruments on the chain were serviced five times by various cruises leading to 6 sampling periods.
The data processing on the temperature and pressure loggers for the Celtic Deep CEFAS SmartBuoy temperature chain was done in Matlab.
The data were plotted to see when the instruments were settled to get reliable observations for processing. The depths of the instruments were finalised with reference to the pressure instruments when possible. Periods 4 and 6 only had 1 pressure logger, ?SBE 39 T+P SN6761? for these periods the difference between the nominal depth and the mean-depth of ?SBE 39 T+P SN6761? was applied to the rest of the nominal depths. Both periods 1 and 3 had both pressure loggers, ?SBE 39 T+P SN6761? and ?SBE 39 T+P SN6762?, present at the top and bottom of the chain respectively. The mean depth of the pressure loggers were used as the absolute top and bottom of the chain. From these absolute values a line with a spacing of 5 steps in-between these values was used to replicate near 10 metre gaps. The 50 m approximate mark was discounted due to the nominal 20 m gap between SBE 56 T SN3592 and SBE 56 T SN3596 though was included so this different change in depth spacing did not affect other instruments. These values were then taken as the depths of the corresponding instruments without pressure sensors. Period 5 had no pressure loggers present and occurred in the winter mixed regime of the shelf sea so had few temperature structures for comparison in adjacent periods. Due to this nominal depths were taken as true depths.
Calibration procedures
The extracted data were looked over to identify areas that could be erroneous and a stability test was done to see times when lower instruments were warmer than the instruments above. It was felt that due to the extreme accuracy of the instruments that removal of certain data points that might seem erroneous would only degrade the data. The stability test however showed that often during periods with a mixed winter regime there was near continual instability present in the water column. With box plots of winter mixed periods often showing medians between instruments as positive (showing the deeper instrument recorded warmer temperatures). This suggested that the instruments were over-reading or under-reading the temperature of the mixed water. To see if this seeming error in temperature logging could be quantified multiple intervals where the observed water column was fully mixed, were examined to see if a realistic and accurate adjustment could be found. Based on the differences between the instruments to an instrument assumed to be reading the true temperature at these fully mixed periods lines of regression were drawn. The instrument at nominal depth of 20 m was decided to be the most accurate so was taken to be the ?true? instrument. This instrument was chosen as the only CTD taken around the winter mixed period, cast 15 on cruise DY021, had less temperature difference with the 20 m nominal instrument compared to the other instruments. The lines of regression with significant p values that provided a better fix than a constant (p-value around or less than 0.05) were applied to the relevant instrument while instruments without statistically significant p values had a mean of the differences applied.
| Nominal Depth (m) | R2 statistic | F statistic | p Value | Estimate of Error Variance |
|---|---|---|---|---|
| 10 | 0.290688 | 10.24541 | 0.0003708 | 1.39*10-07 |
| 30 | 0.717338 | 76.13378 | 9.90*10-10 | 1.13*10-07 |
| 40 | 0.729434 | 80.87879 | 5.10*10-10 | 4.68*10-07 |
| 60 | 0.103694 | 3.470719 | 0.072282 | 1.42*10-06 |
| 74 | 0.414991 | 3.546875 | 0.118372 | 3.81*10-07 |
The method fixed many of the smaller instabilities suggested by the data and brought the instruments in line with each other during the winter mixed periods. The adjustments meant the median difference between the instruments at the sampled times fell into the accuracy range given by the manufacturer.
Several issues were encountered with regards to calibration of the instruments against CTD casts leading to a state where no reliable calibration could be applied to the dataset. The offsets between the brand new SBE loggers and nearby CTD casts were highly variable and no statistically significant regression could be fitted, even after problem casts had been removed such as the CEFAS calibration CTDs taken during the CEFAS 22/14 cruise which used a backup ESM2 instrument as the main CTD was not in operation. The ESM2 instrument was reading approximately 0.5°C too high. Many of the comparison points also fall a long way outside the manufacturer?s accuracy and stability estimates for the temperature sensors - ±0.002°C and 0.0002°C/month respectively (http://www.seabird.com/sbe56-temperature-logger andhttp://www.seabird.com/sbe39plus-temperature-recorder). Some of the disagreement between the calibration CTD casts and the instruments could be explained due to the distance between the SmartBuoy and the cast locations. The tidal excursion for 6.2 hours (a rough calculation based on non-quality controlled ADCP data) showed that some of the calibration casts could have been half an M2 neaps tidal signature away from the SmartBuoy. Based on changes in deeper instruments temperature, less exposed to surface heating, over this 6 hour period temperature could change by 0.065°C. Though a possible explanation for the CTD instrument differences, the calculations were based on rough estimations and not adjusted for. Based on the new instruments and the reliability of Sea-Bird instruments it is likely any adjustments against the CTD casts would have degraded the quality and accuracy of the results
Project Information
Shelf Sea Biogeochemistry (SSB) Programme
Shelf Sea Biogeochemistry (SSB) is a £10.5 million, six-year (2011-2017) research programme, jointly funded by the Natural Environment Research Council (NERC) and the Department for Environment, Food and Rural Affairs (DEFRA). The aim of the research is to reduce the uncertainty in our understanding of nutrient and carbon cycling within the shelf seas, and of their role in global biogeochemical cycles. SSB will also provide effective policy advice and make a significant contribution to the Living with Environmental Change programme.
Background
The Shelf Sea Biogeochemistry research programme directly relates to the delivery of the NERC Earth system science theme and aims to provide evidence that supports a number of marine policy areas and statutory requirements, such as the Marine Strategy Framework Directive and Marine and Climate Acts.
The shelf seas are highly productive compared to the open ocean, a productivity that underpins more than 90 per cent of global fisheries. Their importance to society extends beyond food production to include issues of biodiversity, carbon cycling and storage, waste disposal, nutrient cycling, recreation and renewable energy resources.
The shelf seas have been estimated to be the most valuable biome on Earth, but they are under considerable stress, as a result of anthropogenic nutrient loading, overfishing, habitat disturbance, climate change and other impacts.
However, even within the relatively well-studied European shelf seas, fundamental biogeochemical processes are poorly understood. For example: the role of shelf seas in carbon storage; in the global cycles of key nutrients (nitrogen, phosphorus, silicon and iron); and in determining primary and secondary production, and thereby underpinning the future delivery of many other ecosystem services.
Improved knowledge of such factors is not only required by marine policymakers; it also has the potential to increase the quality and cost-effectiveness of management decisions at the local, national and international levels under conditions of climate change.
The Shelf Sea Biogeochemistry research programme will take a holistic approach to the cycling of nutrients and carbon and the controls on primary and secondary production in UK and European shelf seas, to increase understanding of these processes and their role in wider biogeochemical cycles. It will thereby significantly improve predictive marine biogeochemical and ecosystem models over a range of scales.
The scope of the programme includes exchanges with the open ocean (transport on and off the shelf to a depth of around 500m), together with cycling, storage and release processes on the shelf slope, and air-sea exchange of greenhouse gases (carbon dioxide and nitrous oxide).
Further details are available on the SSB website.
Participants
15 different organisations are directly involved in research for SSB. These institutions are
- Centre for Environment, Fisheries and Aquaculture Science (Cefas)
- Meteorological Office
- National Oceanography Centre (NOC)
- Plymouth Marine Laboratory (PML)
- Scottish Association for Marine Science (SAMS) / Scottish Marine Institute (SMI)
- University of Aberdeen
- University of Bangor
- University of East Anglia (UEA)
- University of Edinburgh
- University of Essex
- University of Liverpool
- University of Oxford
- Plymouth University
- University of Portsmouth
- University of Southampton
In addition, there are third party institutions carrying out sampling work for SSB, but who are not involved in the programme itself. These are:
- The Agri-Food and Biosciences Institute (AFBI)
- Irish Marine Institute (MI)
- Marine Science Scotland (MSS)
Research details
Overall, five Work Packages have been funded by the SSB programme. These are described in brief below:
-
Work Package 1: Carbon and Nutrient Dynamics and Fluxes over Shelf Systems (CaNDyFloSS).
This work package aims to perform a comprehensive study of the cycling of nutrients and carbon throughout the water column over the whole north-west European shelf. This will allow the fluxes of nutrients and carbon between the shelf and the deep ocean and atmosphere to be quantified, establishing the role of the north-west European continental shelf in the global carbon cycle. -
Work Package 2: Biogeochemistry, macronutrient and carbon cycling in the benthic layer.
This work package aims are to map the sensitivity and status of seabed habitats, based on physical conditions, ecological community structure and the size and dynamics of the nitrogen and carbon pools found there. This information will be used, in conjunction with some laboratory-based work, to generate an understanding of the potential impacts on the benthic community as a result of changing environmental conditions, such as rising CO2 levels. -
Work Package 3: The supply of iron from shelf sediments to the ocean.
The research for this work package addresses the question of how currents, tides, weather and marine chemistry allow new iron to be transported away from the shallow shelf waters around the United Kingdom (UK), to the nearby open ocean. This will ultimately allow an improved understanding of how the transport of iron in shelf waters and shelf sediments influences phytoplankton growth in open oceans. This in turn improves the understanding of carbon dioxide uptake by phytoplankton. -
Work Package 4: Integrative modelling for Shelf Seas Biogeochemistry.
The aim of this work package is the development of a new shelf seas biogeochemical model system, coupled to a state of the art physical model, that is capable of predicting regional impacts of environmental change of timescales from days to decades. It is envisaged that the combination of predictive tools and new knowledge developed in this work package will underpin development and implementation of marine policy and marine forecasting systems. - Work Package 5: Data synthesis and management of marine and coastal carbon (DSMMAC).
This work package is funded by Defra and is also known by the name 'Blue Carbon'. The aim is to provide a process-based, quantitative assessment of the role of UK coastal waters and shelf seas in carbon storage and release, using existing data and understanding, and also emerging results from SSB fieldwork, experiments and modelling. Particular emphasis will be given to processes that may be influenced by human activities, and hence the opportunity for management interventions to enhance carbon sequestration.
Fieldwork and data collection
The campaign consists of the core cruises in the table below, to the marine shelf (and shelf-edge) of the Celtic Sea on board the NERC research vessels RRS Discovery and RRS James Cook. These cruises will focus on the physics and biogeochemistry of the benthic and pelagic zones of the water column, primarily around four main sampling sites in this area.
| Cruise identifier | Research ship | Cruise dates | Work packages |
|---|---|---|---|
| DY008 | RRS Discovery | March 2014 | WP 2 and WP 3 |
| JC105 | RRS James Cook | June 2014 | WP 1, WP 2 and WP 3 |
| DY026 | RRS Discovery | August 2014 | WP1, WP 2 and WP 3 |
| DY018 | RRS Discovery | November - December 2014 | WP 1 and WP 3 |
| DY021 (also known as DY008b) | RRS Discovery | March 2015 | WP 2 and WP 3 |
| DY029 | RRS Discovery | April 2015 | WP 1 and WP 3 |
| DY030 | RRS Discovery | May 2015 | WP 2 and WP 3 |
| DY033 | RRS Discovery | July 2015 | WP 1 and WP 3 |
| DY034 | RRS Discovery | August 2015 | WP 2 and WP 3 |
Core cruises will be supplemented by partner cruises led by Cefas, MI, MSS, Bangor University and AFBI, spanning the shelf seas and shelf-edges around United Kingdom and Republic of Ireland.
Activities will include coring, Conductivity Temperature and Depth (CTD) deployments, Acoustic Doppler Current Profilers (ADCP) surveys, moorings and wire-walker deployments, benthic lander observatories, autonomous gliders and submersible surveys, Marine Snow Catcher particulate matter analysis, plankton net hauls, in-situ sediment flume investigations and laboratory incubations with core and sea water samples.
Data Activity or Cruise Information
Data Activity
| Start Date (yyyy-mm-dd) | 2015-03-10 |
| End Date (yyyy-mm-dd) | 2015-05-08 |
| Organization Undertaking Activity | National Oceanography Centre, Liverpool |
| Country of Organization | United Kingdom |
| Originator's Data Activity Identifier | TEMP_CHAIN_DY021_201503 |
| Platform Category | subsurface mooring |
SSB Celtic Deep SmartBuoy temperature chain DY021 201503
For the Shelf Sea Biogeochemistry Project the Celtic Deep SmartBuoy (longitude -6.56748 and latitude of 51.13732) was augmented with a string of temperature loggers that were nominally suspended between 10 m and 74 m depth in a nominal water depth of 99 m.
| Deployment | Recovery | |
|---|---|---|
| Cruise | RRS Discovery DY021 | RRS Discovery DY030 |
| Date | 10/03/2015 07:46:00 | 08/05/2015 10:45:00 |
Instruments deployed on the rig
| Depth | Instrument |
|---|---|
| 20m | SBE 56 T (SN3593) |
| 30m | SBE 56 T (SN3590) |
| 40m | SBE 56 T (SN3592) |
| 60m | SBE 56 T (SN3596) |
Related Data Activity activities are detailed in Appendix 1
Cruise
| Cruise Name | DY021 |
| Departure Date | 2015-03-01 |
| Arrival Date | 2015-03-26 |
| Principal Scientist(s) | E Malcolm S Woodward (Plymouth Marine Laboratory) |
| Ship | RRS Discovery |
Complete Cruise Metadata Report is available here
Fixed Station Information
Fixed Station Information
| Station Name | Shelf Seas Biogeochemistry Fixed Station Celtic Deep |
| Category | Offshore area |
| Latitude | 51° 8.26' N |
| Longitude | 6° 36.35' W |
| Water depth below MSL | 104.0 m |
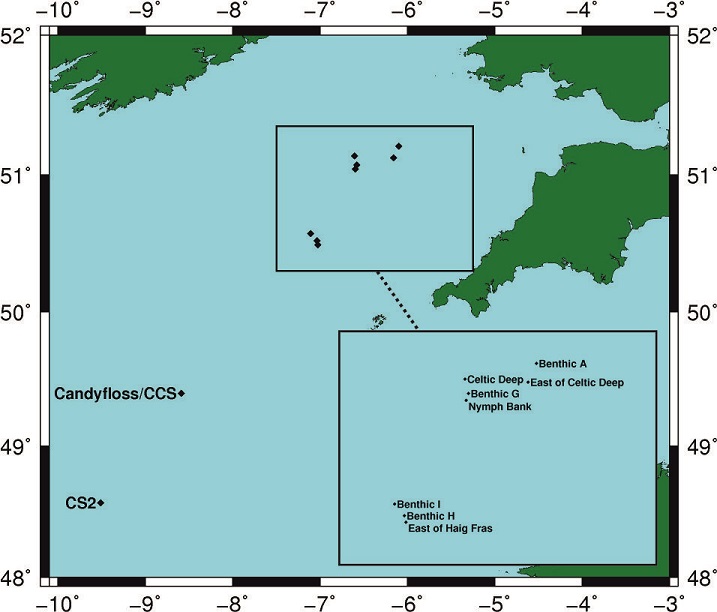
Shelf Sea Biogeochemistry Fixed Station Celtic Deep
This station is one of four mooring sites located on the continental shelf of the Celtic Sea and maintained during the Shelf Sea Biogeochemistry project. The station has a mean water depth 104 m at the following co-ordinates:
| Box Corner | Latitude | Longitude |
|---|---|---|
| North-west corner | 51.1570° | -6.6494° |
| South-east corner | 51.1182° | -6.5622° |
The position of this station relative to the other Shelf Sea Biogeochemistry sites can be seen from the figure below.
Sampling History
| DY008 | JC105 | DY026 | DY018 | |
|---|---|---|---|---|
| CTD casts | 2 | 2 | 22 | - |
| STD casts | - | 1 | - | - |
| Zooplankton net hauls | - | - | 19 | - |
| Box cores | - | - | 4 | - |
| Marine snow catcher | - | - | 29 | - |
| Stand Alone Pump Systems (SAPS) | - | - | 1 | - |
| PML Drifter Buoy | - | - | 3 | - |
Mooring deployments
| Latitude | Longitude | Water depth (m) | Moored instrument | Deployment date | Recovery date | Deployment cruise | Recovery cruise | Comments |
|---|---|---|---|---|---|---|---|---|
| 51.1373° | -6.5675° | 99 | Cefas SmartBuoy | 23-03-2014 15:43 UTC | 17-06-2014 14:24 UTC | DY008 | JC105 | - |
| 51.1376° | -6.5672° | 98 | Cefas SmartBuoy | 17-06-2014 16:56 UTC | - | JC105 | - | Not recovered on DY026B as planned - mooring was lost due to suspected trawler activity. |
| 51.1383° | -6.5706° | 100 | Cefas SmartBuoy | 17-08-2014 17:11 UTC | 23/10/2014 08:00 UTC | DY026B | CEFAS 22/14 | - |
| 51.1373° | -6.5675° | 99 | Cefas SmartBuoy | 23/10/2014 14:00 UTC | 08/03/2015 17:20 UTC | CEFAS 22/14 | DY021 | - |
| 51.1372° | -6.5684° | 105 | Cefas SmartBuoy | 10/03/2015 07:46 UTC | 08/05/2015 10:45 UTC | DY021 | DY030 | - |
| 51.1373° | -6.5673° | 100 | Cefas SmartBuoy | 09/05/2015 13:52 UTC | 15/08/2015 13:00 UTC | DY030 | DY034 | - |
Related Fixed Station activities are detailed in Appendix 2
BODC Quality Control Flags
The following single character qualifying flags may be associated with one or more individual parameters with a data cycle:
| Flag | Description |
|---|---|
| Blank | Unqualified |
| < | Below detection limit |
| > | In excess of quoted value |
| A | Taxonomic flag for affinis (aff.) |
| B | Beginning of CTD Down/Up Cast |
| C | Taxonomic flag for confer (cf.) |
| D | Thermometric depth |
| E | End of CTD Down/Up Cast |
| G | Non-taxonomic biological characteristic uncertainty |
| H | Extrapolated value |
| I | Taxonomic flag for single species (sp.) |
| K | Improbable value - unknown quality control source |
| L | Improbable value - originator's quality control |
| M | Improbable value - BODC quality control |
| N | Null value |
| O | Improbable value - user quality control |
| P | Trace/calm |
| Q | Indeterminate |
| R | Replacement value |
| S | Estimated value |
| T | Interpolated value |
| U | Uncalibrated |
| W | Control value |
| X | Excessive difference |
SeaDataNet Quality Control Flags
The following single character qualifying flags may be associated with one or more individual parameters with a data cycle:
| Flag | Description |
|---|---|
| 0 | no quality control |
| 1 | good value |
| 2 | probably good value |
| 3 | probably bad value |
| 4 | bad value |
| 5 | changed value |
| 6 | value below detection |
| 7 | value in excess |
| 8 | interpolated value |
| 9 | missing value |
| A | value phenomenon uncertain |
| B | nominal value |
| Q | value below limit of quantification |
Appendix 1: TEMP_CHAIN_DY021_201503
Related series for this Data Activity are presented in the table below. Further information can be found by following the appropriate links.
If you are interested in these series, please be aware we offer a multiple file download service. Should your credentials be insufficient for automatic download, the service also offers a referral to our Enquiries Officer who may be able to negotiate access.
| Series Identifier | Data Category | Start date/time | Start position | Cruise |
|---|---|---|---|---|
| 1905779 | Hydrography time series at depth | 2015-03-10 07:48:09 | 51.1372 N, 6.5684 W | RRS Discovery DY021 |
| 1905780 | Hydrography time series at depth | 2015-03-10 07:49:59 | 51.1372 N, 6.5684 W | RRS Discovery DY021 |
| 1905811 | Hydrography time series at depth | 2015-03-10 07:49:59 | 51.1372 N, 6.5684 W | RRS Discovery DY021 |
Appendix 2: Shelf Seas Biogeochemistry Fixed Station Celtic Deep
Related series for this Fixed Station are presented in the table below. Further information can be found by following the appropriate links.
If you are interested in these series, please be aware we offer a multiple file download service. Should your credentials be insufficient for automatic download, the service also offers a referral to our Enquiries Officer who may be able to negotiate access.
| Series Identifier | Data Category | Start date/time | Start position | Cruise |
|---|---|---|---|---|
| 1371512 | CTD or STD cast | 2014-03-23 08:51:00 | 51.12823 N, 6.56232 W | RRS Discovery DY008 |
| 1336643 | Water sample data | 2014-03-23 08:51:00 | 51.12825 N, 6.56222 W | RRS Discovery DY008 |
| 1905638 | Hydrography time series at depth | 2014-03-23 15:44:59 | 51.13732 N, 6.56748 W | RRS Discovery DY008 |
| 1905651 | Hydrography time series at depth | 2014-03-23 15:44:59 | 51.13732 N, 6.56748 W | RRS Discovery DY008 |
| 1905663 | Hydrography time series at depth | 2014-03-23 15:44:59 | 51.13732 N, 6.56748 W | RRS Discovery DY008 |
| 1905675 | Hydrography time series at depth | 2014-03-23 15:44:59 | 51.13732 N, 6.56748 W | RRS Discovery DY008 |
| 1905571 | Hydrography time series at depth | 2014-03-23 15:45:00 | 51.13732 N, 6.56748 W | RRS Discovery DY008 |
| 1905583 | Hydrography time series at depth | 2014-03-23 15:45:00 | 51.13732 N, 6.56748 W | RRS Discovery DY008 |
| 1371524 | CTD or STD cast | 2014-03-23 16:22:00 | 51.13792 N, 6.56963 W | RRS Discovery DY008 |
| 1336655 | Water sample data | 2014-03-23 16:23:00 | 51.13793 N, 6.56965 W | RRS Discovery DY008 |
| 1372693 | CTD or STD cast | 2014-06-17 12:35:00 | 51.14018 N, 6.5659 W | RRS James Cook JC105 |
| 2103798 | Water sample data | 2014-06-17 12:41:30 | 51.14017 N, 6.56595 W | RRS James Cook JC105 |
| 2108059 | Water sample data | 2014-06-17 12:41:30 | 51.14017 N, 6.56595 W | RRS James Cook JC105 |
| 2143069 | Water sample data | 2014-06-17 12:41:30 | 51.14017 N, 6.56595 W | RRS James Cook JC105 |
| 1372700 | CTD or STD cast | 2014-06-17 17:22:00 | 51.13899 N, 6.56501 W | RRS James Cook JC105 |
| 2103805 | Water sample data | 2014-06-17 17:24:30 | 51.13894 N, 6.56515 W | RRS James Cook JC105 |
| 2108060 | Water sample data | 2014-06-17 17:24:30 | 51.13894 N, 6.56515 W | RRS James Cook JC105 |
| 2143070 | Water sample data | 2014-06-17 17:24:30 | 51.13894 N, 6.56515 W | RRS James Cook JC105 |
| 1373094 | CTD or STD cast | 2014-08-09 06:08:00 | 51.13767 N, 6.586 W | RRS Discovery DY026A |
| 2127555 | Water sample data | 2014-08-09 06:21:30 | 51.13774 N, 6.58583 W | RRS Discovery DY026A |
| 1373101 | CTD or STD cast | 2014-08-09 10:40:00 | 51.12067 N, 6.62167 W | RRS Discovery DY026A |
| 2118171 | Water sample data | 2014-08-09 10:54:00 | 51.11972 N, 6.62294 W | RRS Discovery DY026A |
| 2127567 | Water sample data | 2014-08-09 10:54:00 | 51.11972 N, 6.62294 W | RRS Discovery DY026A |
| 1373113 | CTD or STD cast | 2014-08-09 13:30:00 | 51.11833 N, 6.62533 W | RRS Discovery DY026A |
| 2127579 | Water sample data | 2014-08-09 14:30:00 | 51.11833 N, 6.62499 W | RRS Discovery DY026A |
| 1373125 | CTD or STD cast | 2014-08-09 16:04:00 | 51.11833 N, 6.62533 W | RRS Discovery DY026A |
| 2127580 | Water sample data | 2014-08-09 16:20:30 | 51.11833 N, 6.62498 W | RRS Discovery DY026A |
| 1373137 | CTD or STD cast | 2014-08-10 06:58:00 | 51.157 N, 6.57133 W | RRS Discovery DY026A |
| 2127592 | Water sample data | 2014-08-10 07:10:30 | 51.15702 N, 6.57108 W | RRS Discovery DY026A |
| 1373149 | CTD or STD cast | 2014-08-10 08:00:00 | 51.15633 N, 6.57533 W | RRS Discovery DY026A |
| 2127611 | Water sample data | 2014-08-10 08:15:00 | 51.15656 N, 6.57279 W | RRS Discovery DY026A |
| 1373150 | CTD or STD cast | 2014-08-10 08:59:00 | 51.15567 N, 6.5775 W | RRS Discovery DY026A |
| 2127623 | Water sample data | 2014-08-10 09:10:00 | 51.15501 N, 6.57861 W | RRS Discovery DY026A |
| 1373162 | CTD or STD cast | 2014-08-10 10:00:00 | 51.15283 N, 6.58967 W | RRS Discovery DY026A |
| 2127635 | Water sample data | 2014-08-10 10:08:30 | 51.15174 N, 6.59221 W | RRS Discovery DY026A |
| 1373174 | CTD or STD cast | 2014-08-10 11:03:00 | 51.1495 N, 6.5985 W | RRS Discovery DY026A |
| 2118183 | Water sample data | 2014-08-10 11:14:00 | 51.14896 N, 6.59987 W | RRS Discovery DY026A |
| 2127647 | Water sample data | 2014-08-10 11:14:00 | 51.14896 N, 6.59987 W | RRS Discovery DY026A |
| 1373186 | CTD or STD cast | 2014-08-10 12:04:00 | 51.14767 N, 6.60333 W | RRS Discovery DY026A |
| 2127659 | Water sample data | 2014-08-10 12:10:00 | 51.14731 N, 6.60372 W | RRS Discovery DY026A |
| 1373198 | CTD or STD cast | 2014-08-10 12:59:00 | 51.14667 N, 6.60533 W | RRS Discovery DY026A |
| 2127660 | Water sample data | 2014-08-10 13:09:00 | 51.14626 N, 6.60576 W | RRS Discovery DY026A |
| 1373205 | CTD or STD cast | 2014-08-10 13:59:00 | 51.14583 N, 6.60667 W | RRS Discovery DY026A |
| 2127672 | Water sample data | 2014-08-10 14:10:00 | 51.14579 N, 6.6065 W | RRS Discovery DY026A |
| 1373217 | CTD or STD cast | 2014-08-10 15:08:00 | 51.14567 N, 6.60667 W | RRS Discovery DY026A |
| 2127684 | Water sample data | 2014-08-10 15:19:00 | 51.14574 N, 6.60586 W | RRS Discovery DY026A |
| 1373229 | CTD or STD cast | 2014-08-10 16:10:00 | 51.14567 N, 6.60533 W | RRS Discovery DY026A |
| 2127696 | Water sample data | 2014-08-10 16:17:00 | 51.14564 N, 6.60417 W | RRS Discovery DY026A |
| 1373230 | CTD or STD cast | 2014-08-10 17:00:00 | 51.14567 N, 6.60417 W | RRS Discovery DY026A |
| 2127703 | Water sample data | 2014-08-10 17:12:30 | 51.14569 N, 6.60394 W | RRS Discovery DY026A |
| 1373242 | CTD or STD cast | 2014-08-10 17:57:00 | 51.14567 N, 6.60417 W | RRS Discovery DY026A |
| 2127715 | Water sample data | 2014-08-10 18:09:30 | 51.14568 N, 6.60394 W | RRS Discovery DY026A |
| 1373254 | CTD or STD cast | 2014-08-10 19:06:00 | 51.14567 N, 6.60417 W | RRS Discovery DY026A |
| 2127727 | Water sample data | 2014-08-10 19:15:00 | 51.14568 N, 6.60394 W | RRS Discovery DY026A |
| 1373291 | CTD or STD cast | 2014-08-12 07:00:00 | 51.1485 N, 6.60417 W | RRS Discovery DY026A |
| 2127740 | Water sample data | 2014-08-12 07:10:30 | 51.14853 N, 6.60395 W | RRS Discovery DY026A |
| 1373309 | CTD or STD cast | 2014-08-12 11:00:00 | 51.13983 N, 6.622 W | RRS Discovery DY026A |
| 2118195 | Water sample data | 2014-08-12 11:14:00 | 51.13963 N, 6.62276 W | RRS Discovery DY026A |
| 2127752 | Water sample data | 2014-08-12 11:14:00 | 51.13963 N, 6.62276 W | RRS Discovery DY026A |
| 1373310 | CTD or STD cast | 2014-08-12 13:26:00 | 51.137 N, 6.6295 W | RRS Discovery DY026A |
| 1373322 | CTD or STD cast | 2014-08-12 18:00:00 | 51.135 N, 6.63333 W | RRS Discovery DY026A |
| 1905687 | Hydrography time series at depth | 2014-08-17 17:14:59 | 51.1383 N, 6.57057 W | RRS Discovery DY026B |
| 1905699 | Hydrography time series at depth | 2014-08-17 17:14:59 | 51.1383 N, 6.57057 W | RRS Discovery DY026B |
| 1905706 | Hydrography time series at depth | 2014-08-17 17:14:59 | 51.1383 N, 6.57057 W | RRS Discovery DY026B |
| 1905718 | Hydrography time series at depth | 2014-08-17 17:14:59 | 51.1383 N, 6.57057 W | RRS Discovery DY026B |
| 1905595 | Hydrography time series at depth | 2014-08-17 17:15:00 | 51.1383 N, 6.57057 W | RRS Discovery DY026B |
| 1905602 | Hydrography time series at depth | 2014-08-17 17:15:00 | 51.1383 N, 6.57057 W | RRS Discovery DY026B |
| 1373346 | CTD or STD cast | 2014-08-17 17:31:00 | 51.13998 N, 6.5793 W | RRS Discovery DY026B |
| 2127776 | Water sample data | 2014-08-17 17:40:30 | 51.13991 N, 6.57931 W | RRS Discovery DY026B |
| 1905614 | Hydrography time series at depth | 2014-10-23 14:00:00 | 51.13732 N, 6.56748 W | RV Cefas Endeavour 22/14 |
| 1905731 | Hydrography time series at depth | 2014-10-23 14:00:00 | 51.13732 N, 6.56748 W | RV Cefas Endeavour 22/14 |
| 1905743 | Hydrography time series at depth | 2014-10-23 14:00:00 | 51.13732 N, 6.56748 W | RV Cefas Endeavour 22/14 |
| 1905755 | Hydrography time series at depth | 2014-10-23 14:00:00 | 51.13732 N, 6.56748 W | RV Cefas Endeavour 22/14 |
| 1905767 | Hydrography time series at depth | 2014-10-23 14:00:00 | 51.13732 N, 6.56748 W | RV Cefas Endeavour 22/14 |
| 1905779 | Hydrography time series at depth | 2015-03-10 07:48:09 | 51.1372 N, 6.5684 W | RRS Discovery DY021 |
| 1905780 | Hydrography time series at depth | 2015-03-10 07:49:59 | 51.1372 N, 6.5684 W | RRS Discovery DY021 |
| 1905811 | Hydrography time series at depth | 2015-03-10 07:49:59 | 51.1372 N, 6.5684 W | RRS Discovery DY021 |
| 2127242 | Water sample data | 2015-03-10 12:30:30 | 51.13352 N, 6.57524 W | RRS Discovery DY021 |
| 2135856 | Water sample data | 2015-03-10 12:30:30 | 51.13352 N, 6.57524 W | RRS Discovery DY021 |
| 2132385 | Water sample data | 2015-05-08 08:41:30 | 51.14138 N, 6.57319 W | RRS Discovery DY030 |
| 1905626 | Hydrography time series at depth | 2015-05-09 14:20:00 | 51.13732 N, 6.56748 W | RRS Discovery DY030 |
| 1905823 | Hydrography time series at depth | 2015-05-09 14:20:00 | 51.13732 N, 6.56748 W | RRS Discovery DY030 |
| 1905835 | Hydrography time series at depth | 2015-05-09 14:20:00 | 51.13732 N, 6.56748 W | RRS Discovery DY030 |
| 1905847 | Hydrography time series at depth | 2015-05-09 14:20:00 | 51.13732 N, 6.56748 W | RRS Discovery DY030 |
| 1905859 | Hydrography time series at depth | 2015-05-09 14:20:00 | 51.13732 N, 6.56748 W | RRS Discovery DY030 |
| 1624713 | CTD or STD cast | 2015-05-09 17:03:00 | 51.13798 N, 6.55718 W | RRS Discovery DY030 |
| 1721335 | CTD or STD cast | 2015-08-12 11:52:00 | 51.12317 N, 6.57627 W | RRS Discovery DY034 |
