Metadata Report for BODC Series Reference Number 2058448
Metadata Summary
Problem Reports
Data Access Policy
Narrative Documents
Project Information
Data Activity or Cruise Information
Fixed Station Information
BODC Quality Flags
SeaDataNet Quality Flags
Metadata Summary
Data Description |
|||||||||||||||||||||||||||||||||||||||||||||||||||||||||||||||||||||||||||||||||||||
|
|||||||||||||||||||||||||||||||||||||||||||||||||||||||||||||||||||||||||||||||||||||
Data Identifiers |
|||||||||||||||||||||||||||||||||||||||||||||||||||||||||||||||||||||||||||||||||||||
|
|||||||||||||||||||||||||||||||||||||||||||||||||||||||||||||||||||||||||||||||||||||
Time Co-ordinates(UT) |
|||||||||||||||||||||||||||||||||||||||||||||||||||||||||||||||||||||||||||||||||||||
|
|||||||||||||||||||||||||||||||||||||||||||||||||||||||||||||||||||||||||||||||||||||
Spatial Co-ordinates | |||||||||||||||||||||||||||||||||||||||||||||||||||||||||||||||||||||||||||||||||||||
|
|||||||||||||||||||||||||||||||||||||||||||||||||||||||||||||||||||||||||||||||||||||
Parameters |
|||||||||||||||||||||||||||||||||||||||||||||||||||||||||||||||||||||||||||||||||||||
|
|||||||||||||||||||||||||||||||||||||||||||||||||||||||||||||||||||||||||||||||||||||
|
|||||||||||||||||||||||||||||||||||||||||||||||||||||||||||||||||||||||||||||||||||||
Problem Reports
No Problem Report Found in the Database
RRS James Cook cruise JC187 meteorology quality control report
Wind speed and direction
True and relative wind speed and direction channels (EWSBSS01, EWDASS01, ERWSSS01, ERWDSS01) were screened for spiking, and artifical effects of wind shielding and acceleration. Several incidences of spiking were noticed and flagged accordingly for all four channels (true and relative wind speed and direction). This was likely a result of the ship making a lot of manouvers on this cruise due to the nature of the work undertaken. Two incidences of artificial enhancement of wind due to ship speed were flagged (21th September and 2nd October 2019, both at ~11:30), in addition to several periods of wind shading from the ships superstructure.
Data Access Policy
Open Data
These data have no specific confidentiality restrictions for users. However, users must acknowledge data sources as it is not ethical to publish data without proper attribution. Any publication or other output resulting from usage of the data should include an acknowledgment.
If the Information Provider does not provide a specific attribution statement, or if you are using Information from several Information Providers and multiple attributions are not practical in your product or application, you may consider using the following:
"Contains public sector information licensed under the Open Government Licence v1.0."
Narrative Documents
Gill Instruments Windsonic Anemometer
The Gill Windsonic is a 2-axis ultrasonic wind sensor that monitors wind speed and direction using four transducers. The time taken for an ultrasonic pulse to travel from the North to the South transducers is measured and compared with the time for a pulse to travel from South to North. Travel times between the East and West transducers are similarly compared. The wind speed and direction are calculated from the differences in the times of flight along each axis. This calculation is independent of environmental factors such as temperature.
Specifications
| Ultrasonic output rate | 0.25, 0.5, 1, 2 or 4 Hz |
| Operating Temperature | -35 to 70°C |
| Operating Humidity | < 5 to 100% RH |
| Anemometer start up time | < 5 s |
| Wind speed | |
| Range | 0 to 60 m s-1 |
| Accuracy | ± 2% at 2 m s-1 |
| Resolution | 0.01 m s-1 |
| Response time | 0.25 s |
| Threshold | 0.01 m s-1 |
| Wind direction | |
| Range | 0 to 359° |
| Accuracy | ± 3° at 12 m s-1 |
| Resolution | 1° |
| Response time | 0.25 s |
Further details can be found in the manufacturer's specification sheet.
Kipp and Zonen Pyranometer Model CM6B
The CM6B pyranometer is intended for routine global solar radiation measurement research on a level surface. The CM6B features a sixty-four thermocouple junction (series connected) sensing element. The sensing element is coated with a highly stable carbon based non-organic coating, which delivers excellent spectral absorption and long term stability characteristics. The sensing element is housed under two concentric fitting Schott K5 glass domes.
Specifications
| Dimensions (W x H) | 150.0 mm x 91.5 mm |
|---|---|
| Weight | 850 grams |
| Operating Temperature | -40°C to +80°C |
| Spectral Range | 305 - 2800 nm (50% points) |
| Sensitivity | 9 -15 µV/W/m2 |
| Impedance (nominal) | 70 - 100 ohm |
| Response Time (95%) | 30 sec |
| Non-linearity | < ± 1.2% (<1000 W/m2) |
| Temperature dependence of sensitivity | < ± 2% (-10 to +40°C) |
| Zero-offset due to temperature changes | < ± 4 W/m2 at 5 K/h temperature change |
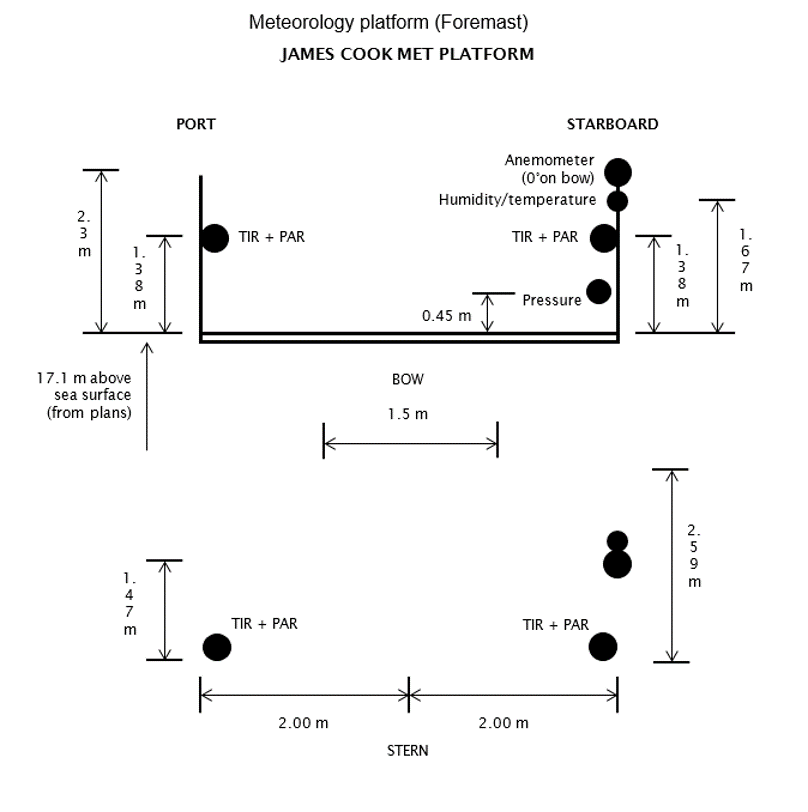
RRS James Cook cruise JC187 meteorology instrumentation
Instrumentation
The meteorological suite of sensors was located on the forecastle deck, between 17.55 and 19.4 m above sea level. The anemometer orientation was 0° on the bow.
| Manufacturer | Model | Serial number | Last manufacturer's calibration date | Comments |
| Skye | SKE 510 | 28559 | 05/01/2018 | Port |
| Skye | SKE 510 | 48926 | 30/01/2018 | Starboard |
| Kipp and Zonen | CM 6B | 973135 | 31/10/2017 | Port |
| Kipp and Zonen | CM 6B | 994133 | 29/08/2018 | Starboard |
| Gill | Windsonic | 64537 | - | No calibration required |
| Vaisala | Humidity and Temperature Probe HMP45AL | E1055002 | 28/05/2019 | No calibration required |
| Vaisala | PTB110 Barometer Air pressure | J0710001 | 28/05/2019 | No calibration required |
|
Skye Instruments PAR Energy Sensor Model SKE 510
The SKE 510 is suitable for measuring photosynthetically active radiation (PAR) from natural or artificial light sources. The sensor is fully waterproof and guaranteed submersible to 4m depth, and indoor versions are also available.
The instrument uses a blue-enhanced planar diffused silicon detector to measure energy (in W m-2) over the 400-700 nm waveband. It has a cosine-corrected head and a square spectral response. The sensor can operate over a temperature range of -35 to 70 °C and a humidity range of 0-100% RH.
Specifications
| Sensitivity (current) | 1.5µA or 100 W m-2 |
|---|---|
| Sensitivity (voltage) | 1mV or 100 W m-2 |
| Working Range | 0-5000 W m-2 |
| Linearity error | 0.2% |
| Absolute calibration error | typ. less than 3% 5% max |
| Response time - voltage output | 10 ns |
| Cosine error | 3% |
| Azimuth error | less than 1% |
| Temperature co-efficient | ±0.1% per °C |
| Internal resistance - voltage output | c. 300 ohms |
| Longterm stability | ±2% |
| Material | Dupont 'Delrin' |
| Dimensions | 34 mm diameter 38mm height |
| Cable | 2 core screened 7 - 2 - 2C |
| Sensor Passband | 400 - 700 nm |
| Detector | Silicon photocell |
| Filters | Glass type and/or metal interference |
Vaisala PTB110 barometer
An industrial, analog barometer which uses a silicon capacitive sensor (BAROCAP). The sensor produces either frequency or voltage output and is mountable on a (35 mm wide) DIN rail.
Operating ranges (1 hPa = 1 mbar)
| Pressure ranges | 500 ... 1100 hPa 600 ... 1100 hPa 800 ... 1100 hPa 800 ... 1060 hPa 600 ... 1060 hPa |
| Temperature range | -40 ... +60 °C (-40 ... +140 °F) |
| Humidity range | non-condensing |
General
| Output voltage | 0 ... 2.5 VDC 0 ... 5 VDC |
| Output frequency | 500 ... 1100 Hz |
| Resolution | 0.1 hPa |
Accuracy
| Linearity* | ±0.25 hPa |
| Hysteresis* | ±0.03 hPa |
| Repeatability* | ±0.03 hPa |
| Pressure calibration uncertainty** | ±0.15 hPa |
| Accuracy at +20 °C*** | ±0.3 hPa |
| Total accuracy at: | |
| +15 ... +25 °C (+59 ... +77 °F) 0 ... +40 °C (+32 ... +104 °F) -20 ... +45 °C (-4 ... +113 °F) -40 ... +60 °C (-40 ... +140 °F) | ±0.3 hPa ±0.6 hPa ±1.0 hPa ±1.5 hPa |
* Defined as ±2 standard deviation limits of end-point non-linearity, hysteresis error or repeatability error.
** Defined as ±2 standard deviation limits of inaccuracy of the working standard including traceability to NIST.
*** Defined as the root sum of the squares (RSS) of end-point non-linearity, hysteresis error, repeatability error and calibration uncertainty at room temperature when using voltage output.
More detailed information can be found in the manufacturer's data sheet and user's guide.
Vaisala Temperature and Relative Humidity HMP Sensors
A family of sensors and instruments (sensors plus integral displays or loggers) for the measurement of air temperature and relative humidity. All are based on a probe containing a patent (HUMICAP) capacitive thin polymer film capacitanece humidity sensor and a Pt100 platinum resistance thermometer. The probes are available with a wide range of packaging, cabling and interface options all of which have designations of the form HMPnn or HMPnnn such as HMP45 and HMP230. Vaisala sensors are incorporated into weather stations and marketed by Campbell Scientific.
All versions operate at up to 100% humidity. Operating temperature ranges vary between models, allowing users to select the version best suited to their requirements.
Further details can be found in the manufacturer's specification sheets for the HMP 45 series, HMP 70 series and HMP 230 series.
RRS James Cook cruise JC187 meteorology data processing procedures
Originator's Data Processing
The data were logged by the TECHSAS (TECHnical and Scientific sensors Acquisition System) version 5.11 data logging system which is the main data logging system on NMF-SS operated research vessels. Data were processed using the National Oceanography Centre data processing routines into daily NetCDF files, and these TECHSAS (NetCDF) meteorology files provided to BODC were used for BODC processing. Please refer to the cruise report for more information.
Files delivered to BODC
| Filename | Content description | Format | Interval | Start date/time (UTC) | End date/time (UTC) | Comments |
| *-*-MET-SURFMETv3.SURFMETv3 | Relative wind speed and direction, air temperature and humidity | NetCDF | 1 hz | 29-Aug-2019 16:28:15 | 07-Oct-2019 09:41:18 | - |
| *-*-Light-SURFMETv3.SURFMETv3 | Air pressure, port and starboard photosynthetically active radiation (PAR) and total irradiance (TIR) | NetCDF | 1 hz | 29-Aug-2019 16:28:15 | 07-Oct-2019 09:41:18 | - |
BODC Data Processing
The data were reformatted to the BODC internal format using standard banking procedures, and averaged at 60 second intervals. The following table shows how variables within the files were mapped to appropriate BODC parameter codes:
*-*-MET-SURFMETv3.SURFMETv3
| Originator's variable | Originator's units | Description | BODC Code | BODC Units | Unit conversion | Comments |
| speed | m/s | Relative wind speed | ERWSSS01 | m/s | N/A | - |
| direct | degrees | Relative wind direction | ERWDSS01 | degrees | N/A | - |
| air temp | °C | Air temperature | CDTAZZ01 | °C | N/A | - |
| humid | (100*Pa)/Pa | Relative humidity | CRELZZ01 | percent | N/A, units equivalent | - |
*-*-Light-SURFMETv3.SURFMETv3
| Originator's variable | Originator's units | Description | BODC Code | BODC Units | Unit conversion | Comments |
| pres | mbar | Air pressure | CAPHTU01 | mbar | N/A | - |
| ppar | centimilliVolts | Port PAR | DVLTRPSD | volts | *0.00001 | - |
| spar | centimilliVolts | Starboard PAR | DVLTRSSD | volts | *0.00001 | - |
| ptir | centimilliVolts | Port TIR | CVLTRP01 | volts | *0.00001 | - |
| stir | centimilliVolts | Starboard TIR | CVLTRS01 | volts | *0.00001 | - |
All data expressed at measurement altitude.
Calibrations
Field Calibrations
No field calibrations were applied to the data at BODC.
Manufacturers Calibrations
Air pressure
A manufacturer's calibration was not applied to the Vaisala PTB110 barometer because there was no significant offset reported on the certified calibration certificate.
PAR/TIR
The following manufacturer's calibrations were applied to the PAR and TIR light sensors using:
y (W m -2 ) = (a x 10 6 )/b
Where 'a' is the raw data in volts and 'b' is the calibration offset (µV per W m -2 ) as shown below:
| Sensor | Serial No. | Location | Offset (µV per W m -2 ) |
| PAR | 28559 | Port | 10.51 |
| PAR | 48926 | Starboard | 10.00 |
| TIR | 973135 | Port | 11.87 |
| TIR | 994133 | Starboard | 9.61 |
Relative wind speed and direction
Relative wind speed and direction were corrected for the ship's heading and speed using the POS MV gyro heading, ship velocities (calculated at BODC from the main positional channels) and an anemometer orientation of 0° on the bow following the Shipboard Automated Meteorological and Oceanographic System (SAMOS) method, thus obtaining the BODC derived absolute wind speed and direction parameters, with codes EWSBSS01 and EWDASS01 respectively.
Relative humidity and air temperature
Manufacturer's calibrations were not applied to the Vaisala HMP45AL temperature and humidity probe data because there were no significant offsets reported on the certified calibration certificate.
Screening
All reformatted data were visualised using the in-house EDSERPLO software. Where calibrations had been applied, only the calibrated versions of those parameters were screened. Suspect data were marked by adding an appropriate quality control flag.
Project Information
How do deep-ocean turbidity currents behave that form the largest sediment accumulations on Earth?
Background
Seafloor flows called turbidity currents form the largest sediment accumulations on Earth (submarine fans). They flush globally significant amounts of sediment, organic carbon, nutrients and fresher-water into the deep ocean, and affect its oxygen levels. Only rivers transport comparable volumes of sediment across such large expanses of our planet, although a single turbidity current can transport more sediment than the combined annual flux from all of the World's rivers combined. This project aimed to improve understanding of turbidity currents, and their wider impacts, by making the first detailed measurements of turbidity currents that runout into the deep (2-5 km) ocean. This project followed recent successful tests of new methods and technology for measuring turbidity currents in shallower (less than 2 km) water, which can now be applied to deep-water, large-scale submarine fan settings. Such measurements at 2 km water depth are the deepest yet for turbidity currents. Surprisingly, they showed that individual turbidity currents lasted for almost a week, and occupied 20% of the time. This was surprising because all previously measured oceanic turbidity currents lasted for just a few hours or minutes, and occurred for <0.1% of the total time. It suggests that turbidity currents that runout into the deep ocean to form major submarine fans may differ from their shallow water cousins in key regards. Preliminary measurements from 2010 and 2013 showed how monitoring is feasible for the study area here, the Congo Canyon off West Africa. The overall aim was to show how deep-sea turbidity current behave using the first direct measurements, and understand causes and wider implications of this behaviour.
This project set out to answer the following key questions about flow behaviour:
- What controls flow duration, and does flow stretching cause near-continuous canyon flushing? We will test a new hypothesis that predicts flows will stretch dramatically as a 'hot spot' of faster moving fluid runs away from the rest of the event, thereby producing near-continuous flushing of submarine canyons.
- What controls runout and whether flows become more powerful? We will test whether turbidity currents tend towards one of two distinct modes of behaviour, in which they erode and accelerate (a process termed ignition), or deposit sediment and dissipate.
- How is flow behaviour and character recorded by deposits? This is important because deposits are the only record of most turbidity currents.
- How does flow behaviour affect the transfer and burial of terrestrial organic carbon in the deep-sea? It was proposed recently that burial of terrestrial organic carbon in the deep sea is very efficient, and an important control on long-term atmospheric CO2 levels. This hypothesis implies little fractionation of terrestrial organic carbon occurs during submarine transport. Composition of organic carbon buried by the offshore flows is similar to that supplied by the river. We will test this hypothesis by analysing amounts and types of organic carbon along the offshore pathway in both flows and deposits.
Fieldwork
Data were collected on James Cook cruise JC187 between August and October 2019. Eight moorings were deployed along the Congo Canyon at warer depths of 2 to 5 km to measure frequency, duration, and run-out distance of multiple flows; together with their velocity, turbulence and sediment concentration structures; as well as changes in water, sediment and organic carbon discharge.
Participants
- Professor Peter Talling (Principal Investigator - Parent Grant) Durham University
- Dr Mattieu Cartigny (Co-Investigator) Durham University
- Professor Robert Hilton (Co-Investigator) Durham University
- Professor Jim McElwaine (Co-Investigator) Durham University
- Professor Daniel Parsons (Principal Investigator - Child Grant) University of Hull
Funding
This project was funded by Natural Environment Research Council parent and child grants NE/R001952/1 and NE/R001960/1, entitled 'How do deep-ocean turbidity currents behave that form the largest sediment accumulations on Earth?', with the former, parent grant led by Professor Peter Talling, Durham University, and the latter child grant led by Professor Daniel Parsons, University of Hull.
Data Activity or Cruise Information
Cruise
| Cruise Name | JC187 |
| Departure Date | 2019-08-31 |
| Arrival Date | 2019-10-07 |
| Principal Scientist(s) | Peter J Talling (University of Durham Department of Geography) |
| Ship | RRS James Cook |
Complete Cruise Metadata Report is available here
Fixed Station Information
No Fixed Station Information held for the Series
BODC Quality Control Flags
The following single character qualifying flags may be associated with one or more individual parameters with a data cycle:
| Flag | Description |
|---|---|
| Blank | Unqualified |
| < | Below detection limit |
| > | In excess of quoted value |
| A | Taxonomic flag for affinis (aff.) |
| B | Beginning of CTD Down/Up Cast |
| C | Taxonomic flag for confer (cf.) |
| D | Thermometric depth |
| E | End of CTD Down/Up Cast |
| G | Non-taxonomic biological characteristic uncertainty |
| H | Extrapolated value |
| I | Taxonomic flag for single species (sp.) |
| K | Improbable value - unknown quality control source |
| L | Improbable value - originator's quality control |
| M | Improbable value - BODC quality control |
| N | Null value |
| O | Improbable value - user quality control |
| P | Trace/calm |
| Q | Indeterminate |
| R | Replacement value |
| S | Estimated value |
| T | Interpolated value |
| U | Uncalibrated |
| W | Control value |
| X | Excessive difference |
SeaDataNet Quality Control Flags
The following single character qualifying flags may be associated with one or more individual parameters with a data cycle:
| Flag | Description |
|---|---|
| 0 | no quality control |
| 1 | good value |
| 2 | probably good value |
| 3 | probably bad value |
| 4 | bad value |
| 5 | changed value |
| 6 | value below detection |
| 7 | value in excess |
| 8 | interpolated value |
| 9 | missing value |
| A | value phenomenon uncertain |
| B | nominal value |
| Q | value below limit of quantification |
