Metadata Report for BODC Series Reference Number 529208
Metadata Summary
Problem Reports
Data Access Policy
Narrative Documents
Project Information
Data Activity or Cruise Information
Fixed Station Information
BODC Quality Flags
SeaDataNet Quality Flags
Metadata Summary
Data Description |
|||||||||||||||||||||||||||||||||||||||||||||
|
|||||||||||||||||||||||||||||||||||||||||||||
Data Identifiers |
|||||||||||||||||||||||||||||||||||||||||||||
|
|||||||||||||||||||||||||||||||||||||||||||||
Time Co-ordinates(UT) |
|||||||||||||||||||||||||||||||||||||||||||||
|
|||||||||||||||||||||||||||||||||||||||||||||
Spatial Co-ordinates | |||||||||||||||||||||||||||||||||||||||||||||
|
|||||||||||||||||||||||||||||||||||||||||||||
Parameters |
|||||||||||||||||||||||||||||||||||||||||||||
|
|||||||||||||||||||||||||||||||||||||||||||||
|
|||||||||||||||||||||||||||||||||||||||||||||
Problem Reports
The wind direction data from this deployment are not valid. A rope caught on the direction vane during the deployment of the mooring. Comparison with concomitant wind direction data from met stations on the nearby Beryl and Frigg oil rigs shows that this incident hindered the good functioning of the met buoy wind direction sensor for the totality of the deployment.
Data Access Policy
Public domain data
These data have no specific confidentiality restrictions for users. However, users must acknowledge data sources as it is not ethical to publish data without proper attribution. Any publication or other output resulting from usage of the data should include an acknowledgment.
The recommended acknowledgment is
"This study uses data from the data source/organisation/programme, provided by the British Oceanographic Data Centre and funded by the funding body."
Narrative Documents
Meteorological Buoy
The meteorological monitoring buoy consisted of a large surface toroid buoy secured at the sea floor by an anchor chain and surmounted by a light metal tower. The structure of the tower included a sail and a metal rail for instrument mountings (at an approximate distance of 2 m above sea surface).
Instrumentation
Aanderaa wind direction sensor 3590 (averaging) and buoy orientation sensor 2864
The wind direction sensor consists of a light wind vane mounted on a pivot on top of a housing. The housing is fitted with a built-in compass which is magnetically coupled to the vane. True wind speed measurement is obtained by combining measurements from the wind direction sensor and from the buoy orientation sensor.
Manufacturer's specifications for the wind direction sensor:
| Threshold speed | <0.3 m/s |
|---|---|
| Accuracy | better than ±5 degrees |
| Temperature | -40 to +50 °C |
Manufacturer's specifications for the buoy orientation sensor:
| Accuracy | better than ±5 degrees |
|---|---|
| Temperature | -40 to +50 °C |
Aanderaa wind speed sensor 2740
This sensor measures the average and maximum wind speed (gust) during the sampling interval. It consists of a three cup rotor on top of an aluminium housing. The rotor bearings consists of two stainless steel ball bearings protected by a surrounding skirt. The lower end of the skirt is furnished with a magnet. The magnet's rotation is sensed by a reed switch located into the housing. The sensor has two output signals: average and maximum wind speed (gust). The arithmetic mean of the wind is obtained regardless of sampling interval providing the sampling interval is between 4 seconds and 36 hours. The maximum wind speed is the highest speed occurring over a two-second period at any time during the sampling interval.
Manufacturer's specifications:
| Threshold speed | 30-50 cm/s |
|---|---|
| Range | up to 76 m/s |
| Accuracy | ±2% or ±20 cm/s (whichever is greater) |
| Operating temperature | -40 to +50 °C |
Aanderaa relative humidity sensor 3445
This sensor consists of a RH probe (model 3447) protected from direct sunshine and rains by a radiation screen.
Manufacturer's specifications:
| Range | 0 to 100% relative humidity (RH) |
|---|---|
| Accuracy | ±3% RH |
| Resolution | 0.1% |
| Operating temperature | -30 to +50 °C |
Aanderaa air temperature sensor 3455
This sensor consists of a platinum resistance thermometer protected from heating by direct sunshine by a radiation screen.
Manufacturer's specifications:
| Range | -44 to +49 °C |
|---|---|
| Resolution | 0.1% of range |
| Accuracy | ±0.1% of range |
Aanderaa solar radiation sensor 2770
This sensor measures incoming solar and sky radiations. The sensor employs a high sensitivity thermistor bridge which measures the temperature rise of a black surface under a borosilicate glass dome.
Manufacturer's specifications:
| Wavelength | 0.3 to 2.5 microns |
|---|---|
| Range | 0 - 2000 W/m2 |
| Accuracy | > ±20 W/m2 |
| Resolution | 4 W/m2 |
Aanderaa net radiation sensor 2811 (Pyrradiometer)
This sensor measures the difference between incoming and outgoing radiation (both sunlight and infrared) at the Earth's surface. The sensor consists of a radiation detector composed of two surfaces which absorb/emit radiation, inside an aluminium housing covered at one end by a teflon dome. One surface is exposed to radiation and the other is shielded inside the sensor housing. A thermistor-resistor network senses the temperature difference between the two surfaces of the detector giving a measure of net radiation.
Manufacturer's specifications
| Wavelength | 0.3 to 60 microns |
|---|---|
| Range | ±2000 W/m2 |
| Accuracy | ±1% of full scale |
| Resolution | 4 W/m2 |
| Operating temperature | -30 to +50 °C |
Data Quality Notes
From the start of the record to 01 October 1998, the wind speed values were generally low compared to wind speeds recorded by the weather stations on the Beryl and Frigg oil platforms. When excessive differences were observed, the wind speed recorded by the sensor on the met buoy was flagged as suspect. After 01 October 1998 the three records show good agreement.
Meteorological Buoy Data Processing
Data Originator's Processing
Raw data readings were converted to engineering units using factory calibrations. The calibration equations applied were as follow:
- Wind speed (m/s)= 0.0746 N + 0.4
- Wind direction (°M)= 0.349 N + 1.5
- Air temperature (°C)= 0.08042 N + 9.864 E-6 N2 - 43.06
- Relative humidity (%)= 0.1026 N - 2.36
- Net radiation (W/m2)= 4.098 N - 209.8
- Solar radiation (W/m2)= 4.202 N - 2168
where N is the datalogger reading.
BODC's Data Processing and Quality Control
BODC screen both the series header information and the parameter values in the data cycles.
Header information is inspected for:
- Irregularities such as suspect values.
- Inconsistencies between related information, for example:
- Times for mooring deployment and for start/end of data series.
- Length of record or number of data cycles, the cycle interval, the clock error and the period over which accrued.
- Parameters expected and the parameters actually present in the data cycles.
- Originator's comments on meter/mooring performance and data quality.
Documents are written by BODC highlighting irregularities which cannot be resolved.
Data cycles are inspected using time series plots of all parameters. Values suspected of being of unnatural origin may be tagged with BODC flag for suspect value.
Project Information
PROcesses of Vertical Exchange in Shelf Seas (PROVESS)
Introduction
PROVESS was an interdisciplinary study of the vertical fluxes of properties through the water column and the surface and bottom boundary layers. The project was funded by the European Community MAST-III programme (MAS3-CT97- 0159) and ran from March 1998 to May 2001.
Scientific Rationale
PROVESS was based on the integration of experimental, theoretical and modelling studies with the aim of improving understanding and quantification of vertical exchange processes in the water column, in particular in the surface and benthic boundary layers and across the> pycnocline. PROVESS also explored mechanisms of physical-biological coupling in which vertical exchanges and turbulence significantly affect the environmental conditions experienced by the biota with particular reference to aggregation, flocculation, sedimentation and trophic interactions.
Fieldwork
The experimental phase of the project was carried out at two contrasting sites in the North Sea: the northern North Sea site (NNS) and the southern North Sea site (SNS).
The two sites had the following characteristics:
| SNS | NNS | |
|---|---|---|
| Position | 52° 15.0' N, 4° 17.0' E | 59° 20.0' E, 1° 00.0' E |
| Time of year | April-May | September-November |
| Water depth (m) | 16 | 100 |
| M2 max amplitude (m s-1) | 0.75 | 0.15 |
| Max current (m s-1) | 1.0 | 0.6 |
| Delta T (deg C) | mixed | 7-1 |
| Thermocline depth (m) | mixed | 35-100 |
| Delta S | 1 | small |
| Halocline depth (m) | 5-10 | cf. thermocline depth |
| Max wind speed (m s-1) | 20 | 25 |
| Max wave height (m) | 5 | 10 |
| Max wave period (s) | 8 | 10 |
| Internal motion | No | Yes |
| Sediment | muddy-sand | muddy-sand |
| Biology | eutrophic | oligotrophic |
At both locations measurements were concentrated at a central position with additional measurements being made to estimate horizontal gradients. Moored instruments (including current meters, temperature and pressure sensors, fluorometers, transmissometers, nutrient analysers and meteorological sensors) were deployed between 7 September and 5 November 1998 at the NNS and between 29 March and 25 May 1999 at the SNS. Each experiment was supported by intensive measurement series made from oceanographic ships and involving turbulence dissipation profiler CTD, particle size profilers, optical profilers, benthic sampling and water bottle sampling.
Details of the cruises were as follows:
| Site | Ship (nationality) | Cruise Mnemonic | Date |
|---|---|---|---|
| NNS | Valdivia (GER) | VA174 | 5 - 17 Sep 1998 |
| Dana (DK) | D1198 | 14 - 26 Oct 1998 | |
| Pelagia (NL) | PE125 | 19 - 30 Oct 1998 | |
| Challenger (UK) | CH140 | 22 Oct - 9 Nov 1998 | |
| SNS | Pelagia (NL) | PE135 | 29 Mar - 9 Apr 1999 |
| Mitra (NL) | MT0499 | 19 - 30 Apr 1999 | |
| Belgica (BE) | BG9912 | 17 - 21 May 1999 |
Data Activity or Cruise Information
Data Activity
| Start Date (yyyy-mm-dd) | 1998-09-06 |
| End Date (yyyy-mm-dd) | 1998-11-16 |
| Organization Undertaking Activity | Proudman Oceanographic Laboratory (now National Oceanography Centre, Liverpool) |
| Country of Organization | United Kingdom |
| Originator's Data Activity Identifier | POLRIG#796 |
| Platform Category | moored surface buoy |
PROVESS Project POLRIG#796
This mooring was also known within PROVESS as 'Rig G'. It was one of a cluster of moorings deployed at the main focus of the Northern North Sea Site in the autumn of 1998. The rig was deployed by FS Valdivia (cruise #174) in September 1998 and recovered by RRS Challenger (cruise #140) in October/November 1998.
| Mooring type | Meteorological buoy with 8' surface toroid buoy |
|---|---|
| Instruments | Net radiation sensor Wind direction Wind speed Relative humidity Air temperature Solar radiation Buoy orientation |
Notes:
- All sensors and loggers owned by Nederlands Instituut voor Onderzoek der Zee (NIOZ), Texel, Netherlands.
- Wind direction fin caught up in grappler rope for all of the deployment.
- Complementary met data also available from the Beryl and Frigg oil rig meteorological stations ( 59° 33.99' N 01°32.00' E and 59° 54.00' N 02° 06.00' E respectively).
Cruise
| Cruise Name | VLD174 (PROVESS N-1) |
| Departure Date | 1998-09-05 |
| Arrival Date | 1998-09-17 |
| Principal Scientist(s) | Gunther Krause (Alfred Wegener Institute, Helmholtz Centre for Polar and Marine Research) |
| Ship | Valdivia |
Complete Cruise Metadata Report is available here
Fixed Station Information
Fixed Station Information
| Station Name | PROVESS Northern North Sea Site |
| Category | Offshore area |
| Latitude | 59° 18.00' N |
| Longitude | 1° 0.00' E |
| Water depth below MSL | 110.0 m |
PROVESS Northern North Sea Site
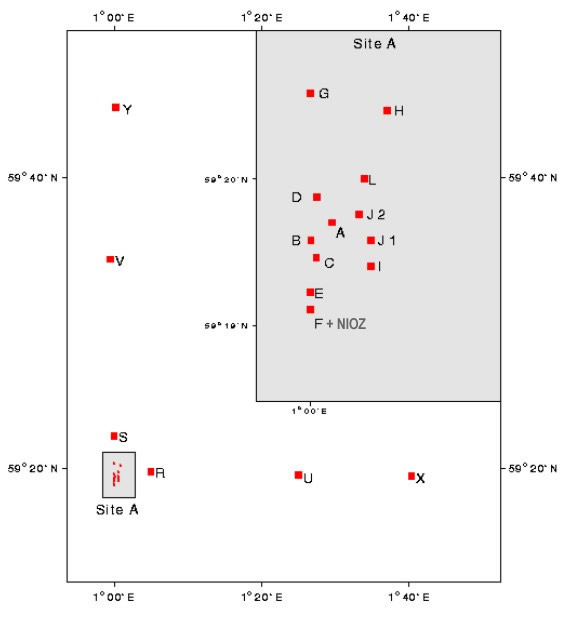
Nineteen mooring packages were deployed at PROVESS Northern North Sea site during the cruise Valdivia VA174 in September 1998. The layout of the mooring assemblage was L-shaped. It consisted of an heavily-instrumented site centred close to 59° 20' N, 1° 00'E (Site A with rigs A, B, Ca/b, D, E, Fa/b, G, H, I, J1, J2 and L) and secondary single-rig sites extending up to 40 km north (V and Y) and east (U and X). An addition mooring package, NIOZ or Rig M, was also deployed at Site A during the RV Pelagia PE125 cruise in October 1998.
Rigs Ca/b and Fa/b were two short-term rigs which were recovered at the end of the cruise VA174 and redeployed during the cruise Challenger CH140 in October. All the other rigs were recovered during the cruise CH140 in October-November 1998 apart from rigs H and L which could not be found and rig Cb which was trawled and recovered from Peterhead (Scotland).
The layout of the mooring array was:
Mooring data
The data returned from each rig were as follows:
| Rig identifier | Data | |
|---|---|---|
| A | POLRIG#790 | ADCP currents Water level Near-bed temperature |
| B | POLRIG#791 | ADCP currents Near-bed temperature |
| Ca | POLRIG#792 | Near-bed temperature |
| Cb | POLRIG#808 | Rig trawled, no data returned |
| D | POLRIG#793 | Currents Temperature, salinity and attenuance |
| E | POLRIG#794 | Currents |
| Fa | POLRIG#795 | Currents |
| Fb | POLRIG#809 | |
| NIOZ | Unknown | Thermistor chain |
| G | POLRIG#796 | Meteorology |
| H | POLRIG#797 | Mooring lost, no data returned |
| I | POLRIG#798 | Surface attenuance, nutrients and chlorophyll |
| J1 | POLRIG#799 | Mid-water attenuance, nutrients and chlorophyll |
| J2 | POLRIG#800 | Near-bed attenuance, nutrients and chlorophyll |
| L | POLRIG#801 | Mooring lost, no data returned |
| R | POLRIG#802 | Water column temperature |
| S | POLRIG#803 | Water column temperature |
| U | POLRIG#804 | ADCP currents Water level Near-bed temperature |
| V | POLRIG#805 | ADCP currents Near-bed temperature |
| X | POLRIG#806 | Water level |
| Y | POLRIG#807 | |
CTD data
A total of 352 CTD casts were also collected during the four cruises surveying this area. These include:
| Cruise identifier | Cruise dates | No. of CTD casts |
|---|---|---|
| FS Valdivia (#174) | 05 September - 17 September 1998 | 168 |
| Dana (#1198) | 14 October - 26 October 1998 | 51 |
| RV Pelagia (#125) | 19 October - 30 October 1998 | 73 |
| RRS Challenger (#140) | 21 October - 11 November 1998 | 60 |
Additonal data
Complementary meteorological and sea state data for PROVESS Northern North Sea Experiment were obtained from Marine Weather Stations located on Beryl and Frigg oil platforms in the Northern North Sea.
Related Fixed Station activities are detailed in Appendix 1
BODC Quality Control Flags
The following single character qualifying flags may be associated with one or more individual parameters with a data cycle:
| Flag | Description |
|---|---|
| Blank | Unqualified |
| < | Below detection limit |
| > | In excess of quoted value |
| A | Taxonomic flag for affinis (aff.) |
| B | Beginning of CTD Down/Up Cast |
| C | Taxonomic flag for confer (cf.) |
| D | Thermometric depth |
| E | End of CTD Down/Up Cast |
| G | Non-taxonomic biological characteristic uncertainty |
| H | Extrapolated value |
| I | Taxonomic flag for single species (sp.) |
| K | Improbable value - unknown quality control source |
| L | Improbable value - originator's quality control |
| M | Improbable value - BODC quality control |
| N | Null value |
| O | Improbable value - user quality control |
| P | Trace/calm |
| Q | Indeterminate |
| R | Replacement value |
| S | Estimated value |
| T | Interpolated value |
| U | Uncalibrated |
| W | Control value |
| X | Excessive difference |
SeaDataNet Quality Control Flags
The following single character qualifying flags may be associated with one or more individual parameters with a data cycle:
| Flag | Description |
|---|---|
| 0 | no quality control |
| 1 | good value |
| 2 | probably good value |
| 3 | probably bad value |
| 4 | bad value |
| 5 | changed value |
| 6 | value below detection |
| 7 | value in excess |
| 8 | interpolated value |
| 9 | missing value |
| A | value phenomenon uncertain |
| B | nominal value |
| Q | value below limit of quantification |
Appendix 1: PROVESS Northern North Sea Site
Related series for this Fixed Station are presented in the table below. Further information can be found by following the appropriate links.
If you are interested in these series, please be aware we offer a multiple file download service. Should your credentials be insufficient for automatic download, the service also offers a referral to our Enquiries Officer who may be able to negotiate access.
| Series Identifier | Data Category | Start date/time | Start position | Cruise |
|---|---|---|---|---|
| 518087 | Hydrography time series at depth | 1998-09-07 10:30:27 | 59.332 N, 1.6715 E | Valdivia VLD174 (PROVESS N-1) |
| 517766 | Hydrography time series at depth | 1998-09-07 11:40:00 | 59.333 N, 1.4178 E | Valdivia VLD174 (PROVESS N-1) |
| 518106 | Hydrography time series at depth | 1998-09-07 11:40:27 | 59.333 N, 1.4178 E | Valdivia VLD174 (PROVESS N-1) |
| 524935 | Currents -subsurface Eulerian | 1998-09-07 11:45:00 | 59.333 N, 1.4178 E | Valdivia VLD174 (PROVESS N-1) |
| 541883 | Currents -subsurface Eulerian | 1998-09-08 06:59:13 | 59.3312 N, 1.001 E | Valdivia VLD174 (PROVESS N-1) |
| 524173 | Hydrography time series at depth | 1998-09-08 07:05:00 | 59.3312 N, 1.001 E | Valdivia VLD174 (PROVESS N-1) |
| 517729 | Hydrography time series at depth | 1998-09-08 09:10:00 | 59.3283 N, 1.0037 E | Valdivia VLD174 (PROVESS N-1) |
| 518118 | Hydrography time series at depth | 1998-09-08 09:10:27 | 59.3283 N, 1.0037 E | Valdivia VLD174 (PROVESS N-1) |
| 524947 | Currents -subsurface Eulerian | 1998-09-08 09:14:59 | 59.3283 N, 1.0037 E | Valdivia VLD174 (PROVESS N-1) |
| 517730 | Hydrography time series at depth | 1998-09-08 11:35:00 | 59.3237 N, 1.0013 E | Valdivia VLD174 (PROVESS N-1) |
| 524923 | Currents -subsurface Eulerian | 1998-09-08 12:22:30 | 59.3257 N, 0.9998 E | Valdivia VLD174 (PROVESS N-1) |
| 517742 | Hydrography time series at depth | 1998-09-08 12:30:00 | 59.3257 N, 0.9998 E | Valdivia VLD174 (PROVESS N-1) |
| 518099 | Hydrography time series at depth | 1998-09-08 15:10:26 | 59.75 N, 1.0013 E | Valdivia VLD174 (PROVESS N-1) |
| 524204 | Transmittance/attenuance, turbidity, or SPM conc. | 1998-09-09 07:35:00 | 59.3228 N, 1.0108 E | Valdivia VLD174 (PROVESS N-1) |
| 541951 | Fluorescence or pigments | 1998-09-09 08:00:00 | 59.3228 N, 1.0108 E | Valdivia VLD174 (PROVESS N-1) |
| 541963 | Fluorescence or pigments | 1998-09-09 08:00:00 | 59.3228 N, 1.0108 E | Valdivia VLD174 (PROVESS N-1) |
| 524751 | Currents -subsurface Eulerian | 1998-09-09 10:05:00 | 59.3202 N, 1.0003 E | Valdivia VLD174 (PROVESS N-1) |
| 524763 | Currents -subsurface Eulerian | 1998-09-09 10:05:00 | 59.3202 N, 1.0003 E | Valdivia VLD174 (PROVESS N-1) |
| 541914 | Water column chemistry | 1998-09-09 10:08:40 | 59.3228 N, 1.0108 E | Valdivia VLD174 (PROVESS N-1) |
| 524775 | Currents -subsurface Eulerian | 1998-09-09 12:26:00 | 59.3183 N, 0.9998 E | Valdivia VLD174 (PROVESS N-1) |
| 524799 | Currents -subsurface Eulerian | 1998-09-09 12:26:00 | 59.3183 N, 0.9998 E | Valdivia VLD174 (PROVESS N-1) |
| 517754 | Hydrography time series at depth | 1998-09-09 16:30:00 | 59.5767 N, 0.9933 E | Valdivia VLD174 (PROVESS N-1) |
| 524959 | Currents -subsurface Eulerian | 1998-09-09 16:35:00 | 59.5767 N, 0.9933 E | Valdivia VLD174 (PROVESS N-1) |
| 541975 | Fluorescence or pigments | 1998-09-09 18:00:00 | 59.3292 N, 1.0088 E | Valdivia VLD174 (PROVESS N-1) |
| 524185 | Currents -subsurface Eulerian | 1998-09-09 18:05:04 | 59.3292 N, 1.0088 E | Valdivia VLD174 (PROVESS N-1) |
| 553128 | Water column chemistry | 1998-09-09 19:39:23 | 59.3292 N, 1.0088 E | Valdivia VLD174 (PROVESS N-1) |
| 524197 | Currents -subsurface Eulerian | 1998-09-10 09:45:04 | 59.3262 N, 1.0112 E | Valdivia VLD174 (PROVESS N-1) |
| 541987 | Fluorescence or pigments | 1998-09-10 10:00:00 | 59.3262 N, 1.0112 E | Valdivia VLD174 (PROVESS N-1) |
| 517613 | Hydrography time series at depth | 1998-09-10 12:25:00 | 59.3333 N, 1.0833 E | Valdivia VLD174 (PROVESS N-1) |
| 517625 | Hydrography time series at depth | 1998-09-10 12:25:00 | 59.3333 N, 1.0833 E | Valdivia VLD174 (PROVESS N-1) |
| 517637 | Hydrography time series at depth | 1998-09-10 12:25:00 | 59.3333 N, 1.0833 E | Valdivia VLD174 (PROVESS N-1) |
| 517649 | Hydrography time series at depth | 1998-09-10 12:25:00 | 59.3333 N, 1.0833 E | Valdivia VLD174 (PROVESS N-1) |
| 529233 | Hydrography time series at depth | 1998-09-10 12:25:04 | 59.3333 N, 1.0833 E | Valdivia VLD174 (PROVESS N-1) |
| 517650 | Hydrography time series at depth | 1998-09-10 14:20:00 | 59.3742 N, 1.0 E | Valdivia VLD174 (PROVESS N-1) |
| 517662 | Hydrography time series at depth | 1998-09-10 14:20:00 | 59.3742 N, 1.0 E | Valdivia VLD174 (PROVESS N-1) |
| 517674 | Hydrography time series at depth | 1998-09-10 14:20:00 | 59.3742 N, 1.0 E | Valdivia VLD174 (PROVESS N-1) |
| 517686 | Hydrography time series at depth | 1998-09-10 14:20:00 | 59.3742 N, 1.0 E | Valdivia VLD174 (PROVESS N-1) |
| 517698 | Hydrography time series at depth | 1998-09-10 14:20:00 | 59.3742 N, 1.0 E | Valdivia VLD174 (PROVESS N-1) |
| 517705 | Hydrography time series at depth | 1998-09-10 14:20:00 | 59.3742 N, 1.0 E | Valdivia VLD174 (PROVESS N-1) |
| 517717 | Hydrography time series at depth | 1998-09-10 14:20:00 | 59.3742 N, 1.0 E | Valdivia VLD174 (PROVESS N-1) |
| 529221 | Hydrography time series at depth | 1998-09-10 14:20:04 | 59.3742 N, 1.0 E | Valdivia VLD174 (PROVESS N-1) |
| 564231 | Hydrography time series at depth | 1998-10-21 14:11:54 | 59.3175 N, 1.0087 E | RV Pelagia PE125 |
| 524787 | Currents -subsurface Eulerian | 1998-10-24 09:44:00 | 59.312 N, 0.9967 E | RRS Challenger CH140 (PROVESS N-4) |
| 524806 | Currents -subsurface Eulerian | 1998-10-24 09:44:00 | 59.312 N, 0.9967 E | RRS Challenger CH140 (PROVESS N-4) |
