Metadata Report for BODC Series Reference Number 553128
Metadata Summary
Problem Reports
Data Access Policy
Narrative Documents
Project Information
Data Activity or Cruise Information
Fixed Station Information
BODC Quality Flags
SeaDataNet Quality Flags
Metadata Summary
Data Description |
|||||||||||||||||||||||||
|
|||||||||||||||||||||||||
Data Identifiers |
|||||||||||||||||||||||||
|
|||||||||||||||||||||||||
Time Co-ordinates(UT) |
|||||||||||||||||||||||||
|
|||||||||||||||||||||||||
Spatial Co-ordinates | |||||||||||||||||||||||||
|
|||||||||||||||||||||||||
Parameters |
|||||||||||||||||||||||||
|
|||||||||||||||||||||||||
|
|||||||||||||||||||||||||
Problem Reports
No Problem Report Found in the Database
Data Access Policy
Open Data
These data have no specific confidentiality restrictions for users. However, users must acknowledge data sources as it is not ethical to publish data without proper attribution. Any publication or other output resulting from usage of the data should include an acknowledgment.
If the Information Provider does not provide a specific attribution statement, or if you are using Information from several Information Providers and multiple attributions are not practical in your product or application, you may consider using the following:
"Contains public sector information licensed under the Open Government Licence v1.0."
Narrative Documents
NAS-2E in situ Nutrient Analyser
The NAS-2E in situ Nutrient Analyser is a submersible instrument for the automated measurement of dissolved nutrient concentrations in marine and fresh waters. It employs colorimetric wet-chemistry to determine nutrient concentrations by measuring the light absorbance of a coloured dye produced by a chemical reaction. The instrument, manufactured by WS Ocean Systems Ltd., Hans, UK, is designed for deployment on moorings. Versions have been developed for nitrate+nitrite, phosphate and silicate. The use of standard wet-chemistry techniques ensure comparability with laboratory results.
References for manufacturer's standard chemical methods are:
- Nitrate and Nitrite: adapted from Armstrong, Stearns and Strickland (1967), modified by Stainton (1974)
- Silicate: adapted from Grasshoff et al. (1983) and Hydes (1984)
- Phosphate: adapted from Murphy and Riley (1962)
although these may be altered by the user.
The system utilizes a syringe pump and rotary valve to acquire and react discrete water samples. For nitrate+nitrite analysis, the samples is first passed over a copper-cadmium column to reduce nitrate to nitrite before reacting with the reagents to form the dye. Once the reaction takes place the sample is injected into the colorimeter where optical beam attenuation is measured. An integral system controller drives the syringe and valve via stepper motors and records the colorimeter readings.
The analysis routines include blank measurements for turbidity and optical fouling. An on-board calibration standard is periodically analysed to ensure the continuous integrity of the results. Programmable controls allows the operator to develop and program alternative chemical routines. All raw data are recorded as voltages representing beam transmission through the sample within the colorimeter pathlength. Following recovery of the instrument, raw data are downloaded to a PC and converted to absorbance units and nutrient concentration using manufacturer's calibration and on- board blank and standard readings.
Manufacturer's specification:
| Wavelength | 560 nm | 880 nm |
|---|---|---|
| Accuracy | 2% of range | 5% of range |
| Sensitivity | 0.5% of range | 2.5% of range |
Level of detection (PL = colorimeter path length):
| Nitrate (µM) | 0-300 with 5 mm PL |
|---|---|
| 0-60 with 10 mm PL | |
| 0-10 with 20 mm PL | |
| 0-5 with 40 mm PL | |
| Silicate (µM) | 0-60 with 10 mm PL |
| 0-10 with 20 mm PL | |
| Phosphate (µM) | 0-3 with 20 mm PL |
| 0-1 with 40 mm PL |
Data Processing Notes
Narrative
Data processing carried out at the Southampton Oceanographic Laboratory, UK. On-board standard readings were not available for this data series because the outlet from the on-board standard reservoir was blocked. As a result silicate concentrations could not be quantified. Absorption readings were left unconverted and, absorption being linearly proportional to concentration, they provide information on the relative changes in silicate concentration during the deployment.
Data Quality
Due to the problem with on-board standard sampling mentioned above, erroneous absorbance readings are present in the data series every 9 hours, corresponding to the first water sample reading following the programmed standard sampling. These records were flagged as suspect in the banked time-series.
General Data Screening carried out by BODC
BODC screen both the series header qualifying information and the parameter values in the data cycles themselves.
Header information is inspected for:
- Irregularities such as unfeasible values
- Inconsistencies between related information, for example:
- Times for instrument deployment and for start/end of data series
- Length of record and the number of data cycles/cycle interval
- Parameters expected and the parameters actually present in the data cycles
- Originator's comments on meter/mooring performance and data quality
Documents are written by BODC highlighting irregularities which cannot be resolved.
Data cycles are inspected using time or depth series plots of all parameters. Currents are additionally inspected using vector scatter plots and time series plots of North and East velocity components. These presentations undergo intrinsic and extrinsic screening to detect infeasible values within the data cycles themselves and inconsistencies as seen when comparing characteristics of adjacent data sets displaced with respect to depth, position or time. Values suspected of being of non-oceanographic origin may be tagged with the BODC flag denoting suspect value; the data values will not be altered.
The following types of irregularity, each relying on visual detection in the plot, are amongst those which may be flagged as suspect:
- Spurious data at the start or end of the record.
- Obvious spikes occurring in periods free from meteorological disturbance.
- A sequence of constant values in consecutive data cycles.
If a large percentage of the data is affected by irregularities then a Problem Report will be written rather than flagging the individual suspect values. Problem Reports are also used to highlight irregularities seen in the graphical data presentations.
Inconsistencies between the characteristics of the data set and those of its neighbours are sought and, where necessary, documented. This covers inconsistencies such as the following:
- Maximum and minimum values of parameters (spikes excluded).
- The occurrence of meteorological events.
This intrinsic and extrinsic screening of the parameter values seeks to confirm the qualifying information and the source laboratory's comments on the series. In screening and collating information, every care is taken to ensure that errors of BODC making are not introduced.
Project Information
PROcesses of Vertical Exchange in Shelf Seas (PROVESS)
Introduction
PROVESS was an interdisciplinary study of the vertical fluxes of properties through the water column and the surface and bottom boundary layers. The project was funded by the European Community MAST-III programme (MAS3-CT97- 0159) and ran from March 1998 to May 2001.
Scientific Rationale
PROVESS was based on the integration of experimental, theoretical and modelling studies with the aim of improving understanding and quantification of vertical exchange processes in the water column, in particular in the surface and benthic boundary layers and across the> pycnocline. PROVESS also explored mechanisms of physical-biological coupling in which vertical exchanges and turbulence significantly affect the environmental conditions experienced by the biota with particular reference to aggregation, flocculation, sedimentation and trophic interactions.
Fieldwork
The experimental phase of the project was carried out at two contrasting sites in the North Sea: the northern North Sea site (NNS) and the southern North Sea site (SNS).
The two sites had the following characteristics:
| SNS | NNS | |
|---|---|---|
| Position | 52° 15.0' N, 4° 17.0' E | 59° 20.0' E, 1° 00.0' E |
| Time of year | April-May | September-November |
| Water depth (m) | 16 | 100 |
| M2 max amplitude (m s-1) | 0.75 | 0.15 |
| Max current (m s-1) | 1.0 | 0.6 |
| Delta T (deg C) | mixed | 7-1 |
| Thermocline depth (m) | mixed | 35-100 |
| Delta S | 1 | small |
| Halocline depth (m) | 5-10 | cf. thermocline depth |
| Max wind speed (m s-1) | 20 | 25 |
| Max wave height (m) | 5 | 10 |
| Max wave period (s) | 8 | 10 |
| Internal motion | No | Yes |
| Sediment | muddy-sand | muddy-sand |
| Biology | eutrophic | oligotrophic |
At both locations measurements were concentrated at a central position with additional measurements being made to estimate horizontal gradients. Moored instruments (including current meters, temperature and pressure sensors, fluorometers, transmissometers, nutrient analysers and meteorological sensors) were deployed between 7 September and 5 November 1998 at the NNS and between 29 March and 25 May 1999 at the SNS. Each experiment was supported by intensive measurement series made from oceanographic ships and involving turbulence dissipation profiler CTD, particle size profilers, optical profilers, benthic sampling and water bottle sampling.
Details of the cruises were as follows:
| Site | Ship (nationality) | Cruise Mnemonic | Date |
|---|---|---|---|
| NNS | Valdivia (GER) | VA174 | 5 - 17 Sep 1998 |
| Dana (DK) | D1198 | 14 - 26 Oct 1998 | |
| Pelagia (NL) | PE125 | 19 - 30 Oct 1998 | |
| Challenger (UK) | CH140 | 22 Oct - 9 Nov 1998 | |
| SNS | Pelagia (NL) | PE135 | 29 Mar - 9 Apr 1999 |
| Mitra (NL) | MT0499 | 19 - 30 Apr 1999 | |
| Belgica (BE) | BG9912 | 17 - 21 May 1999 |
Data Activity or Cruise Information
Data Activity
| Start Date (yyyy-mm-dd) | 1998-09-09 |
| End Date (yyyy-mm-dd) | 1998-11-01 |
| Organization Undertaking Activity | Proudman Oceanographic Laboratory (now National Oceanography Centre, Liverpool) |
| Country of Organization | United Kingdom |
| Originator's Data Activity Identifier | POLRIG#800 |
| Platform Category | subsurface mooring |
PROVESS Project POLRIG#800
This mooring was also known within PROVESS as 'Rig J2'. It was one of a cluster of moorings deployed at the main focus of the Northern North Sea Site in the autumn of 1998. The rig was deployed by FS Valdivia (cruise #174) in September 1998 and recovered by RRS Challenger (cruise #140) in October/November 1998.
| Mooring type | Near-bed environmental single line mooring with sub-surface buoyancy. |
|---|---|
| Instruments | DML fluorometer at 11 m above seabed NAS nitrate analyser at 8 m above seabed NAS silicate analyser at 8 m above seabed Aandara RCM7 fitted with SeaTech transmissometer at 10 m above seabed. |
Related Data Activity activities are detailed in Appendix 1
Cruise
| Cruise Name | VLD174 (PROVESS N-1) |
| Departure Date | 1998-09-05 |
| Arrival Date | 1998-09-17 |
| Principal Scientist(s) | Gunther Krause (Alfred Wegener Institute, Helmholtz Centre for Polar and Marine Research) |
| Ship | Valdivia |
Complete Cruise Metadata Report is available here
Fixed Station Information
Fixed Station Information
| Station Name | PROVESS Northern North Sea Site |
| Category | Offshore area |
| Latitude | 59° 18.00' N |
| Longitude | 1° 0.00' E |
| Water depth below MSL | 110.0 m |
PROVESS Northern North Sea Site
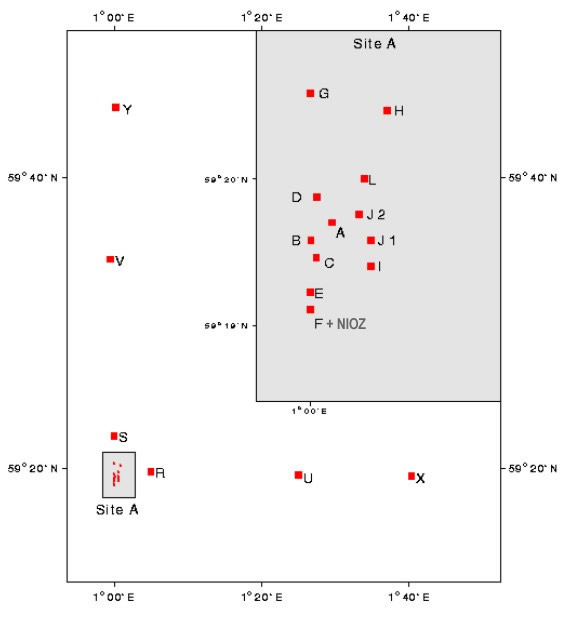
Nineteen mooring packages were deployed at PROVESS Northern North Sea site during the cruise Valdivia VA174 in September 1998. The layout of the mooring assemblage was L-shaped. It consisted of an heavily-instrumented site centred close to 59° 20' N, 1° 00'E (Site A with rigs A, B, Ca/b, D, E, Fa/b, G, H, I, J1, J2 and L) and secondary single-rig sites extending up to 40 km north (V and Y) and east (U and X). An addition mooring package, NIOZ or Rig M, was also deployed at Site A during the RV Pelagia PE125 cruise in October 1998.
Rigs Ca/b and Fa/b were two short-term rigs which were recovered at the end of the cruise VA174 and redeployed during the cruise Challenger CH140 in October. All the other rigs were recovered during the cruise CH140 in October-November 1998 apart from rigs H and L which could not be found and rig Cb which was trawled and recovered from Peterhead (Scotland).
The layout of the mooring array was:
Mooring data
The data returned from each rig were as follows:
| Rig identifier | Data | |
|---|---|---|
| A | POLRIG#790 | ADCP currents Water level Near-bed temperature |
| B | POLRIG#791 | ADCP currents Near-bed temperature |
| Ca | POLRIG#792 | Near-bed temperature |
| Cb | POLRIG#808 | Rig trawled, no data returned |
| D | POLRIG#793 | Currents Temperature, salinity and attenuance |
| E | POLRIG#794 | Currents |
| Fa | POLRIG#795 | Currents |
| Fb | POLRIG#809 | |
| NIOZ | Unknown | Thermistor chain |
| G | POLRIG#796 | Meteorology |
| H | POLRIG#797 | Mooring lost, no data returned |
| I | POLRIG#798 | Surface attenuance, nutrients and chlorophyll |
| J1 | POLRIG#799 | Mid-water attenuance, nutrients and chlorophyll |
| J2 | POLRIG#800 | Near-bed attenuance, nutrients and chlorophyll |
| L | POLRIG#801 | Mooring lost, no data returned |
| R | POLRIG#802 | Water column temperature |
| S | POLRIG#803 | Water column temperature |
| U | POLRIG#804 | ADCP currents Water level Near-bed temperature |
| V | POLRIG#805 | ADCP currents Near-bed temperature |
| X | POLRIG#806 | Water level |
| Y | POLRIG#807 | |
CTD data
A total of 352 CTD casts were also collected during the four cruises surveying this area. These include:
| Cruise identifier | Cruise dates | No. of CTD casts |
|---|---|---|
| FS Valdivia (#174) | 05 September - 17 September 1998 | 168 |
| Dana (#1198) | 14 October - 26 October 1998 | 51 |
| RV Pelagia (#125) | 19 October - 30 October 1998 | 73 |
| RRS Challenger (#140) | 21 October - 11 November 1998 | 60 |
Additonal data
Complementary meteorological and sea state data for PROVESS Northern North Sea Experiment were obtained from Marine Weather Stations located on Beryl and Frigg oil platforms in the Northern North Sea.
Related Fixed Station activities are detailed in Appendix 2
BODC Quality Control Flags
The following single character qualifying flags may be associated with one or more individual parameters with a data cycle:
| Flag | Description |
|---|---|
| Blank | Unqualified |
| < | Below detection limit |
| > | In excess of quoted value |
| A | Taxonomic flag for affinis (aff.) |
| B | Beginning of CTD Down/Up Cast |
| C | Taxonomic flag for confer (cf.) |
| D | Thermometric depth |
| E | End of CTD Down/Up Cast |
| G | Non-taxonomic biological characteristic uncertainty |
| H | Extrapolated value |
| I | Taxonomic flag for single species (sp.) |
| K | Improbable value - unknown quality control source |
| L | Improbable value - originator's quality control |
| M | Improbable value - BODC quality control |
| N | Null value |
| O | Improbable value - user quality control |
| P | Trace/calm |
| Q | Indeterminate |
| R | Replacement value |
| S | Estimated value |
| T | Interpolated value |
| U | Uncalibrated |
| W | Control value |
| X | Excessive difference |
SeaDataNet Quality Control Flags
The following single character qualifying flags may be associated with one or more individual parameters with a data cycle:
| Flag | Description |
|---|---|
| 0 | no quality control |
| 1 | good value |
| 2 | probably good value |
| 3 | probably bad value |
| 4 | bad value |
| 5 | changed value |
| 6 | value below detection |
| 7 | value in excess |
| 8 | interpolated value |
| 9 | missing value |
| A | value phenomenon uncertain |
| B | nominal value |
| Q | value below limit of quantification |
Appendix 1: POLRIG#800
Related series for this Data Activity are presented in the table below. Further information can be found by following the appropriate links.
If you are interested in these series, please be aware we offer a multiple file download service. Should your credentials be insufficient for automatic download, the service also offers a referral to our Enquiries Officer who may be able to negotiate access.
| Series Identifier | Data Category | Start date/time | Start position | Cruise |
|---|---|---|---|---|
| 541975 | Fluorescence or pigments | 1998-09-09 18:00:00 | 59.3292 N, 1.0088 E | Valdivia VLD174 (PROVESS N-1) |
| 524185 | Currents -subsurface Eulerian | 1998-09-09 18:05:04 | 59.3292 N, 1.0088 E | Valdivia VLD174 (PROVESS N-1) |
Appendix 2: PROVESS Northern North Sea Site
Related series for this Fixed Station are presented in the table below. Further information can be found by following the appropriate links.
If you are interested in these series, please be aware we offer a multiple file download service. Should your credentials be insufficient for automatic download, the service also offers a referral to our Enquiries Officer who may be able to negotiate access.
| Series Identifier | Data Category | Start date/time | Start position | Cruise |
|---|---|---|---|---|
| 529208 | Meteorology -meteorological data buoy | 1998-09-06 12:42:00 | 59.3435 N, 0.9955 E | Valdivia VLD174 (PROVESS N-1) |
| 518087 | Hydrography time series at depth | 1998-09-07 10:30:27 | 59.332 N, 1.6715 E | Valdivia VLD174 (PROVESS N-1) |
| 517766 | Hydrography time series at depth | 1998-09-07 11:40:00 | 59.333 N, 1.4178 E | Valdivia VLD174 (PROVESS N-1) |
| 518106 | Hydrography time series at depth | 1998-09-07 11:40:27 | 59.333 N, 1.4178 E | Valdivia VLD174 (PROVESS N-1) |
| 524935 | Currents -subsurface Eulerian | 1998-09-07 11:45:00 | 59.333 N, 1.4178 E | Valdivia VLD174 (PROVESS N-1) |
| 541883 | Currents -subsurface Eulerian | 1998-09-08 06:59:13 | 59.3312 N, 1.001 E | Valdivia VLD174 (PROVESS N-1) |
| 524173 | Hydrography time series at depth | 1998-09-08 07:05:00 | 59.3312 N, 1.001 E | Valdivia VLD174 (PROVESS N-1) |
| 517729 | Hydrography time series at depth | 1998-09-08 09:10:00 | 59.3283 N, 1.0037 E | Valdivia VLD174 (PROVESS N-1) |
| 518118 | Hydrography time series at depth | 1998-09-08 09:10:27 | 59.3283 N, 1.0037 E | Valdivia VLD174 (PROVESS N-1) |
| 524947 | Currents -subsurface Eulerian | 1998-09-08 09:14:59 | 59.3283 N, 1.0037 E | Valdivia VLD174 (PROVESS N-1) |
| 517730 | Hydrography time series at depth | 1998-09-08 11:35:00 | 59.3237 N, 1.0013 E | Valdivia VLD174 (PROVESS N-1) |
| 524923 | Currents -subsurface Eulerian | 1998-09-08 12:22:30 | 59.3257 N, 0.9998 E | Valdivia VLD174 (PROVESS N-1) |
| 517742 | Hydrography time series at depth | 1998-09-08 12:30:00 | 59.3257 N, 0.9998 E | Valdivia VLD174 (PROVESS N-1) |
| 518099 | Hydrography time series at depth | 1998-09-08 15:10:26 | 59.75 N, 1.0013 E | Valdivia VLD174 (PROVESS N-1) |
| 524204 | Transmittance/attenuance, turbidity, or SPM conc. | 1998-09-09 07:35:00 | 59.3228 N, 1.0108 E | Valdivia VLD174 (PROVESS N-1) |
| 541951 | Fluorescence or pigments | 1998-09-09 08:00:00 | 59.3228 N, 1.0108 E | Valdivia VLD174 (PROVESS N-1) |
| 541963 | Fluorescence or pigments | 1998-09-09 08:00:00 | 59.3228 N, 1.0108 E | Valdivia VLD174 (PROVESS N-1) |
| 524751 | Currents -subsurface Eulerian | 1998-09-09 10:05:00 | 59.3202 N, 1.0003 E | Valdivia VLD174 (PROVESS N-1) |
| 524763 | Currents -subsurface Eulerian | 1998-09-09 10:05:00 | 59.3202 N, 1.0003 E | Valdivia VLD174 (PROVESS N-1) |
| 541914 | Water column chemistry | 1998-09-09 10:08:40 | 59.3228 N, 1.0108 E | Valdivia VLD174 (PROVESS N-1) |
| 524775 | Currents -subsurface Eulerian | 1998-09-09 12:26:00 | 59.3183 N, 0.9998 E | Valdivia VLD174 (PROVESS N-1) |
| 524799 | Currents -subsurface Eulerian | 1998-09-09 12:26:00 | 59.3183 N, 0.9998 E | Valdivia VLD174 (PROVESS N-1) |
| 517754 | Hydrography time series at depth | 1998-09-09 16:30:00 | 59.5767 N, 0.9933 E | Valdivia VLD174 (PROVESS N-1) |
| 524959 | Currents -subsurface Eulerian | 1998-09-09 16:35:00 | 59.5767 N, 0.9933 E | Valdivia VLD174 (PROVESS N-1) |
| 541975 | Fluorescence or pigments | 1998-09-09 18:00:00 | 59.3292 N, 1.0088 E | Valdivia VLD174 (PROVESS N-1) |
| 524185 | Currents -subsurface Eulerian | 1998-09-09 18:05:04 | 59.3292 N, 1.0088 E | Valdivia VLD174 (PROVESS N-1) |
| 524197 | Currents -subsurface Eulerian | 1998-09-10 09:45:04 | 59.3262 N, 1.0112 E | Valdivia VLD174 (PROVESS N-1) |
| 541987 | Fluorescence or pigments | 1998-09-10 10:00:00 | 59.3262 N, 1.0112 E | Valdivia VLD174 (PROVESS N-1) |
| 517613 | Hydrography time series at depth | 1998-09-10 12:25:00 | 59.3333 N, 1.0833 E | Valdivia VLD174 (PROVESS N-1) |
| 517625 | Hydrography time series at depth | 1998-09-10 12:25:00 | 59.3333 N, 1.0833 E | Valdivia VLD174 (PROVESS N-1) |
| 517637 | Hydrography time series at depth | 1998-09-10 12:25:00 | 59.3333 N, 1.0833 E | Valdivia VLD174 (PROVESS N-1) |
| 517649 | Hydrography time series at depth | 1998-09-10 12:25:00 | 59.3333 N, 1.0833 E | Valdivia VLD174 (PROVESS N-1) |
| 529233 | Hydrography time series at depth | 1998-09-10 12:25:04 | 59.3333 N, 1.0833 E | Valdivia VLD174 (PROVESS N-1) |
| 517650 | Hydrography time series at depth | 1998-09-10 14:20:00 | 59.3742 N, 1.0 E | Valdivia VLD174 (PROVESS N-1) |
| 517662 | Hydrography time series at depth | 1998-09-10 14:20:00 | 59.3742 N, 1.0 E | Valdivia VLD174 (PROVESS N-1) |
| 517674 | Hydrography time series at depth | 1998-09-10 14:20:00 | 59.3742 N, 1.0 E | Valdivia VLD174 (PROVESS N-1) |
| 517686 | Hydrography time series at depth | 1998-09-10 14:20:00 | 59.3742 N, 1.0 E | Valdivia VLD174 (PROVESS N-1) |
| 517698 | Hydrography time series at depth | 1998-09-10 14:20:00 | 59.3742 N, 1.0 E | Valdivia VLD174 (PROVESS N-1) |
| 517705 | Hydrography time series at depth | 1998-09-10 14:20:00 | 59.3742 N, 1.0 E | Valdivia VLD174 (PROVESS N-1) |
| 517717 | Hydrography time series at depth | 1998-09-10 14:20:00 | 59.3742 N, 1.0 E | Valdivia VLD174 (PROVESS N-1) |
| 529221 | Hydrography time series at depth | 1998-09-10 14:20:04 | 59.3742 N, 1.0 E | Valdivia VLD174 (PROVESS N-1) |
| 564231 | Hydrography time series at depth | 1998-10-21 14:11:54 | 59.3175 N, 1.0087 E | RV Pelagia PE125 |
| 524787 | Currents -subsurface Eulerian | 1998-10-24 09:44:00 | 59.312 N, 0.9967 E | RRS Challenger CH140 (PROVESS N-4) |
| 524806 | Currents -subsurface Eulerian | 1998-10-24 09:44:00 | 59.312 N, 0.9967 E | RRS Challenger CH140 (PROVESS N-4) |
