Metadata Report for BODC Series Reference Number 541809
Metadata Summary
Problem Reports
Data Access Policy
Narrative Documents
Project Information
Data Activity or Cruise Information
Fixed Station Information
BODC Quality Flags
SeaDataNet Quality Flags
Metadata Summary
Data Description |
|||||||||||||||||||||||||||||
|
|||||||||||||||||||||||||||||
Data Identifiers |
|||||||||||||||||||||||||||||
|
|||||||||||||||||||||||||||||
Time Co-ordinates(UT) |
|||||||||||||||||||||||||||||
|
|||||||||||||||||||||||||||||
Spatial Co-ordinates | |||||||||||||||||||||||||||||
|
|||||||||||||||||||||||||||||
Parameters |
|||||||||||||||||||||||||||||
|
|||||||||||||||||||||||||||||
|
|||||||||||||||||||||||||||||
Problem Reports
Temperature, salinity and attenuance records from this instrument show a high variability with very abrupt changes in all three parameters. This high variability made the task of identifying spurious data very difficult and only the most obvious spikes were flagged. Therefore and in addition to the specific caution notices detailed below, users are generally advised to use data from all three channels carefully.
The absolute attenuance values should be used with caution as it was not possible to use the calibration data obtained during the post-cruise calibration exercise carried out on Belgica BG9912 to convert raw counts into beam attenuation. Instead the raw count values were calibrated against attenuance measurements extracted from CTD casts made close to the mooring site at various times during the deployment. This is subject to potential error due to the high degree of patchiness in the vertical and horizontal distribution of suspended particulate matter within the study area.
Comparison of temperature and salinity records from this instrument with measurements obtained from the moored Temperature-Conductivity chain SN1460 (series ref. 541730) and from concomitant ships's surface underway measurements from Belgica and Pelagia cruises suggests that the conductivity and temperature sensors on this instrument were not accurate.
Surface temperature appears underestimated by ca. 0.5 degrees and the salinity record drifts during the deployment starting with an overestimation of true salinity by ca. 1 PSU to finish with an underestimation of true salinity by ca. 2.5 PSU.
Data Access Policy
Open Data
These data have no specific confidentiality restrictions for users. However, users must acknowledge data sources as it is not ethical to publish data without proper attribution. Any publication or other output resulting from usage of the data should include an acknowledgment.
If the Information Provider does not provide a specific attribution statement, or if you are using Information from several Information Providers and multiple attributions are not practical in your product or application, you may consider using the following:
"Contains public sector information licensed under the Open Government Licence v1.0."
Narrative Documents
TRB-1 and TRB-2 Self-recording Transmissometers
The TRB-1 self-recording transmissometer was designed by the School of Ocean Sciences, University of Wales, Bangor and was sometimes known as the 'Mark III Transmissometer'. The instrument was developed commercially by W.S. Ocean Systems Limited and marketed with the designation TRB-2.
The instrument used a 660nm (red) source modulated at 400 Hz. The optical assembly incorporated a folded beam design to reduce instrument size to a minimum. The light beam was collimated using an achromatic lens, passed through a fixed length of the water column and reflected back to a photodiode receiver via a prism reflector. The optical path length could be fixed at either 5 cm, 10 cm or 25 cm.
Data were logged at the top of each minute as the average of 200 samples taken at 400 Hz. Timing was based on an accurate real-time clock emulated by the processor BIOS extension. Data were acquired by a multi-channel 12- bit data acquisition system resident on the motherboard resulting in a count between 0 and 4095.
Data were stored internally on a 2 MByte SRAM card giving storage for 120 days of data. After deployment, the data were downloaded in a simple ASCII format onto a PC.
TRB-2 instruments could be fitted with additional conductivity and temperature sensors.
Data Processing Notes
Transmissometer calibration (R. McCandliss, UNW, Bangor, UK)
Transmission readings from the TRB-2 transmissometer SN1761 were converted to attenuance using the following values (see 'Caution notes' for details on calibration procedures):
Air correction reading = 2770
Blanked path reading = 7
General Data Screening carried out by BODC
BODC screen both the series header qualifying information and the parameter values in the data cycles themselves.
Header information is inspected for:
- Irregularities such as unfeasible values
- Inconsistencies between related information, for example:
- Times for instrument deployment and for start/end of data series
- Length of record and the number of data cycles/cycle interval
- Parameters expected and the parameters actually present in the data cycles
- Originator's comments on meter/mooring performance and data quality
Documents are written by BODC highlighting irregularities which cannot be resolved.
Data cycles are inspected using time or depth series plots of all parameters. Currents are additionally inspected using vector scatter plots and time series plots of North and East velocity components. These presentations undergo intrinsic and extrinsic screening to detect infeasible values within the data cycles themselves and inconsistencies as seen when comparing characteristics of adjacent data sets displaced with respect to depth, position or time. Values suspected of being of non-oceanographic origin may be tagged with the BODC flag denoting suspect value; the data values will not be altered.
The following types of irregularity, each relying on visual detection in the plot, are amongst those which may be flagged as suspect:
- Spurious data at the start or end of the record.
- Obvious spikes occurring in periods free from meteorological disturbance.
- A sequence of constant values in consecutive data cycles.
If a large percentage of the data is affected by irregularities then a Problem Report will be written rather than flagging the individual suspect values. Problem Reports are also used to highlight irregularities seen in the graphical data presentations.
Inconsistencies between the characteristics of the data set and those of its neighbours are sought and, where necessary, documented. This covers inconsistencies such as the following:
- Maximum and minimum values of parameters (spikes excluded).
- The occurrence of meteorological events.
This intrinsic and extrinsic screening of the parameter values seeks to confirm the qualifying information and the source laboratory's comments on the series. In screening and collating information, every care is taken to ensure that errors of BODC making are not introduced.
Project Information
PROcesses of Vertical Exchange in Shelf Seas (PROVESS)
Introduction
PROVESS was an interdisciplinary study of the vertical fluxes of properties through the water column and the surface and bottom boundary layers. The project was funded by the European Community MAST-III programme (MAS3-CT97- 0159) and ran from March 1998 to May 2001.
Scientific Rationale
PROVESS was based on the integration of experimental, theoretical and modelling studies with the aim of improving understanding and quantification of vertical exchange processes in the water column, in particular in the surface and benthic boundary layers and across the> pycnocline. PROVESS also explored mechanisms of physical-biological coupling in which vertical exchanges and turbulence significantly affect the environmental conditions experienced by the biota with particular reference to aggregation, flocculation, sedimentation and trophic interactions.
Fieldwork
The experimental phase of the project was carried out at two contrasting sites in the North Sea: the northern North Sea site (NNS) and the southern North Sea site (SNS).
The two sites had the following characteristics:
| SNS | NNS | |
|---|---|---|
| Position | 52° 15.0' N, 4° 17.0' E | 59° 20.0' E, 1° 00.0' E |
| Time of year | April-May | September-November |
| Water depth (m) | 16 | 100 |
| M2 max amplitude (m s-1) | 0.75 | 0.15 |
| Max current (m s-1) | 1.0 | 0.6 |
| Delta T (deg C) | mixed | 7-1 |
| Thermocline depth (m) | mixed | 35-100 |
| Delta S | 1 | small |
| Halocline depth (m) | 5-10 | cf. thermocline depth |
| Max wind speed (m s-1) | 20 | 25 |
| Max wave height (m) | 5 | 10 |
| Max wave period (s) | 8 | 10 |
| Internal motion | No | Yes |
| Sediment | muddy-sand | muddy-sand |
| Biology | eutrophic | oligotrophic |
At both locations measurements were concentrated at a central position with additional measurements being made to estimate horizontal gradients. Moored instruments (including current meters, temperature and pressure sensors, fluorometers, transmissometers, nutrient analysers and meteorological sensors) were deployed between 7 September and 5 November 1998 at the NNS and between 29 March and 25 May 1999 at the SNS. Each experiment was supported by intensive measurement series made from oceanographic ships and involving turbulence dissipation profiler CTD, particle size profilers, optical profilers, benthic sampling and water bottle sampling.
Details of the cruises were as follows:
| Site | Ship (nationality) | Cruise Mnemonic | Date |
|---|---|---|---|
| NNS | Valdivia (GER) | VA174 | 5 - 17 Sep 1998 |
| Dana (DK) | D1198 | 14 - 26 Oct 1998 | |
| Pelagia (NL) | PE125 | 19 - 30 Oct 1998 | |
| Challenger (UK) | CH140 | 22 Oct - 9 Nov 1998 | |
| SNS | Pelagia (NL) | PE135 | 29 Mar - 9 Apr 1999 |
| Mitra (NL) | MT0499 | 19 - 30 Apr 1999 | |
| Belgica (BE) | BG9912 | 17 - 21 May 1999 |
Data Activity or Cruise Information
Data Activity
| Start Date (yyyy-mm-dd) | 1999-03-29 |
| End Date (yyyy-mm-dd) | 1999-05-18 |
| Organization Undertaking Activity | Proudman Oceanographic Laboratory (now National Oceanography Centre, Liverpool) |
| Country of Organization | United Kingdom |
| Originator's Data Activity Identifier | POLRIG#823 |
| Platform Category | moored surface buoy |
PROVESS Project POLRIG#823
This mooring was known within PROVESS as 'Rig G', but was sometimes referred to as the 'surface environmental mooring'. It was one of a cluster of moorings deployed at the main focus of the Southern North Sea Site during the spring of 1999.
| Mooring type | Surface toroid with sub-surface instrument cage. |
|---|---|
| Instruments (1 m below surface) | TRB-2 transmissometer (S/N 1761) DML NAS nitrate analyser (S/N 1714) DML fluorometer (S/N 012) |
Related Data Activity activities are detailed in Appendix 1
Cruise
| Cruise Name | PE136 |
| Departure Date | 1999-03-29 |
| Arrival Date | 1999-04-09 |
| Principal Scientist(s) | Hans van Haren (Royal Netherlands Institute for Sea Research) |
| Ship | RV Pelagia |
Complete Cruise Metadata Report is available here
Fixed Station Information
Fixed Station Information
| Station Name | PROVESS Southern North Sea Site |
| Category | Offshore area |
| Latitude | 52° 18.00' N |
| Longitude | 4° 18.00' E |
| Water depth below MSL | 16.0 m |
PROVESS Southern North Sea Site
Eleven mooring packages were deployed at PROVESS Southern North Sea site by Pelagia cruise PE136 in March 1999. One of these (Rig U) was lost, the NIOZ mooring was recovered by PE136 in April 1999 and the remaining nine were recovered by either RV Belgica cruise BG9912 (8 moorings) or RV Zirfea (Rig V) in May 1999.
The layout of the mooring array was:
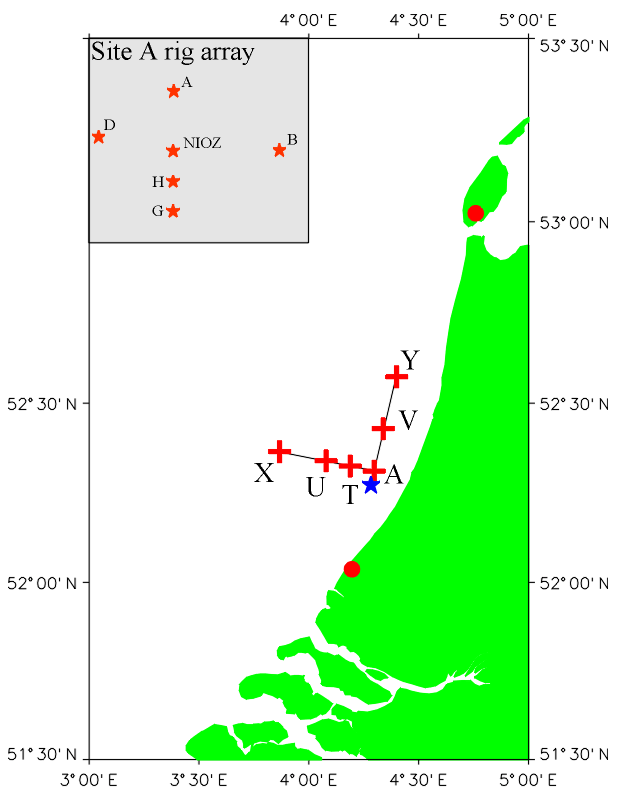
The asterisk represents an array of five moorings as detailed in the inset map.
Mooring data
The data returned from each rig were as follows:
| Rig identifier | Data | |
|---|---|---|
| A | POLRIG#820 | Near-bed currents Temperature, salinity and attenuance |
| B | POLRIG#821 | ADCP currents Water level Thermistor plus conductivity chain |
| D | POLRIG#822 | Currents |
| H | POLRIG#824 | Currents Nutrients (nitrate + nitrite, silicate) Chlorophyll |
| G | POLRIG#823 | Surface attenuance, nutrients (nitrate + nitrite) and chlorophyll |
| NIOZ | ADCP currents Thermistor chain Wave statistics (considered suspect) | |
| V | POLRIG#827 | Currents Temperature (4 depths) |
| Y | POLRIG#829 | Water level Near-bed temperature |
| T | POLRIG#825 | ADCP currents Water level Thermistor plus conductivity chain |
| U | Unknown | None |
| X | POLRIG#828 | Water level Near-bed temperature |
CTD data
A total of 356 CTD casts were also collected during the three cruises surveying this area. These include:
| Cruise identifier | Cruise dates | No. of CTD casts |
|---|---|---|
| RV Pelagia (#136) | 29 March - 09 April 1999 | 133 |
| Mitra (#0499) | 19 April - 30 April 1999 | 170 |
| RV Belgica (#9912) | 17 May - 21 May 1999 | 53 |
Additonal data
Supporting meteorological data (including sea surface temperature and wave statistics) from two platforms (52° 33' N, 4° 3.5' E and 52° 16.4' N, 4° 17.8' E) were supplied to the project and are held by BODC. These series run from the beginning of March 1999 until the end of May 1999.
Related Fixed Station activities are detailed in Appendix 2
BODC Quality Control Flags
The following single character qualifying flags may be associated with one or more individual parameters with a data cycle:
| Flag | Description |
|---|---|
| Blank | Unqualified |
| < | Below detection limit |
| > | In excess of quoted value |
| A | Taxonomic flag for affinis (aff.) |
| B | Beginning of CTD Down/Up Cast |
| C | Taxonomic flag for confer (cf.) |
| D | Thermometric depth |
| E | End of CTD Down/Up Cast |
| G | Non-taxonomic biological characteristic uncertainty |
| H | Extrapolated value |
| I | Taxonomic flag for single species (sp.) |
| K | Improbable value - unknown quality control source |
| L | Improbable value - originator's quality control |
| M | Improbable value - BODC quality control |
| N | Null value |
| O | Improbable value - user quality control |
| P | Trace/calm |
| Q | Indeterminate |
| R | Replacement value |
| S | Estimated value |
| T | Interpolated value |
| U | Uncalibrated |
| W | Control value |
| X | Excessive difference |
SeaDataNet Quality Control Flags
The following single character qualifying flags may be associated with one or more individual parameters with a data cycle:
| Flag | Description |
|---|---|
| 0 | no quality control |
| 1 | good value |
| 2 | probably good value |
| 3 | probably bad value |
| 4 | bad value |
| 5 | changed value |
| 6 | value below detection |
| 7 | value in excess |
| 8 | interpolated value |
| 9 | missing value |
| A | value phenomenon uncertain |
| B | nominal value |
| Q | value below limit of quantification |
Appendix 1: POLRIG#823
Related series for this Data Activity are presented in the table below. Further information can be found by following the appropriate links.
If you are interested in these series, please be aware we offer a multiple file download service. Should your credentials be insufficient for automatic download, the service also offers a referral to our Enquiries Officer who may be able to negotiate access.
| Series Identifier | Data Category | Start date/time | Start position | Cruise |
|---|---|---|---|---|
| 541902 | Fluorescence or pigments | 1999-03-29 17:00:00 | 52.298 N, 4.2997 E | RV Pelagia PE136 |
| 541926 | Water column chemistry | 1999-04-02 21:01:40 | 52.298 N, 4.2997 E | RV Pelagia PE136 |
Appendix 2: PROVESS Southern North Sea Site
Related series for this Fixed Station are presented in the table below. Further information can be found by following the appropriate links.
If you are interested in these series, please be aware we offer a multiple file download service. Should your credentials be insufficient for automatic download, the service also offers a referral to our Enquiries Officer who may be able to negotiate access.
| Series Identifier | Data Category | Start date/time | Start position | Cruise |
|---|---|---|---|---|
| 564206 | Meteorology -unspecified | 1999-03-01 00:00:00 | 52.55 N, 4.0583 E | Not applicable |
| 564218 | Meteorology -unspecified | 1999-03-01 00:00:00 | 52.2739 N, 4.2959 E | Not applicable |
| 564243 | Waves (statistics) | 1999-03-29 14:08:00 | 52.3022 N, 4.3003 E | RV Pelagia PE136 |
| 541766 | Hydrography time series at depth | 1999-03-29 14:55:02 | 52.3063 N, 4.3002 E | RV Pelagia PE136 |
| 541902 | Fluorescence or pigments | 1999-03-29 17:00:00 | 52.298 N, 4.2997 E | RV Pelagia PE136 |
| 529269 | Hydrography time series at depth | 1999-03-29 18:45:00 | 52.3632 N, 3.867 E | RV Pelagia PE136 |
| 529325 | Hydrography time series at depth | 1999-03-29 18:49:40 | 52.3632 N, 3.867 E | RV Pelagia PE136 |
| 541791 | Transmittance/attenuance, turbidity, or SPM conc. | 1999-03-30 08:15:00 | 52.3198 N, 4.1953 E | RV Pelagia PE136 |
| 541742 | Hydrography time series at depth | 1999-03-30 08:15:06 | 52.3198 N, 4.1953 E | RV Pelagia PE136 |
| 541822 | Currents -subsurface Eulerian | 1999-03-30 08:17:30 | 52.3198 N, 4.1953 E | RV Pelagia PE136 |
| 529245 | Hydrography time series at depth | 1999-03-30 08:20:00 | 52.3198 N, 4.1953 E | RV Pelagia PE136 |
| 529350 | Hydrography time series at depth | 1999-03-30 08:25:52 | 52.3198 N, 4.1953 E | RV Pelagia PE136 |
| 541858 | Currents -subsurface Eulerian | 1999-03-30 09:04:59 | 52.3198 N, 4.1953 E | RV Pelagia PE136 |
| 541778 | Currents -subsurface Eulerian | 1999-03-30 10:05:08 | 52.3002 N, 4.3002 E | RV Pelagia PE136 |
| 541895 | Fluorescence or pigments | 1999-03-30 11:00:00 | 52.3002 N, 4.3002 E | RV Pelagia PE136 |
| 541938 | Water column chemistry | 1999-03-30 11:01:40 | 52.3002 N, 4.3002 E | RV Pelagia PE136 |
| 541871 | Currents -subsurface Eulerian | 1999-03-30 11:48:06 | 52.3063 N, 4.3002 E | RV Pelagia PE136 |
| 553141 | Water column chemistry | 1999-03-30 12:32:15 | 52.3002 N, 4.3002 E | RV Pelagia PE136 |
| 541730 | Hydrography time series at depth | 1999-03-30 13:15:06 | 52.3032 N, 4.3055 E | RV Pelagia PE136 |
| 541810 | Currents -subsurface Eulerian | 1999-03-30 13:45:00 | 52.302 N, 4.2945 E | RV Pelagia PE136 |
| 529257 | Hydrography time series at depth | 1999-03-30 14:00:00 | 52.3023 N, 4.3067 E | RV Pelagia PE136 |
| 529349 | Hydrography time series at depth | 1999-03-30 14:00:26 | 52.3023 N, 4.3067 E | RV Pelagia PE136 |
| 541834 | Currents -subsurface Eulerian | 1999-03-30 14:05:00 | 52.3023 N, 4.3067 E | RV Pelagia PE136 |
| 541846 | Currents -subsurface Eulerian | 1999-03-30 14:09:58 | 52.3023 N, 4.3067 E | RV Pelagia PE136 |
| 529282 | Hydrography time series at depth | 1999-03-30 16:50:00 | 52.4385 N, 4.3503 E | RV Pelagia PE136 |
| 529294 | Hydrography time series at depth | 1999-03-30 16:50:00 | 52.4385 N, 4.3503 E | RV Pelagia PE136 |
| 529301 | Hydrography time series at depth | 1999-03-30 16:50:00 | 52.4385 N, 4.3503 E | RV Pelagia PE136 |
| 529313 | Hydrography time series at depth | 1999-03-30 16:50:00 | 52.4385 N, 4.3503 E | RV Pelagia PE136 |
| 541754 | Currents -subsurface Eulerian | 1999-03-30 16:55:07 | 52.4385 N, 4.3503 E | RV Pelagia PE136 |
| 529270 | Hydrography time series at depth | 1999-03-30 18:15:00 | 52.5682 N, 4.4002 E | RV Pelagia PE136 |
| 529337 | Hydrography time series at depth | 1999-03-30 18:20:26 | 52.5682 N, 4.4002 E | RV Pelagia PE136 |
| 553313 | Offshore sea floor pressure series | 1999-04-01 16:07:58 | 52.3022 N, 4.3003 E | RV Pelagia PE136 |
| 553294 | Currents -subsurface Eulerian | 1999-04-01 16:09:20 | 52.3022 N, 4.3003 E | RV Pelagia PE136 |
| 553301 | Hydrography time series at depth | 1999-04-01 16:09:20 | 52.3022 N, 4.3003 E | RV Pelagia PE136 |
| 541926 | Water column chemistry | 1999-04-02 21:01:40 | 52.298 N, 4.2997 E | RV Pelagia PE136 |
