Metadata Report for BODC Series Reference Number 2046841
Metadata Summary
Problem Reports
Data Access Policy
Narrative Documents
Project Information
Data Activity or Cruise Information
Fixed Station Information
BODC Quality Flags
SeaDataNet Quality Flags
Metadata Summary
Data Description |
|||||||||||||||||||||||||||||||||||||||||||||||||
|
|||||||||||||||||||||||||||||||||||||||||||||||||
Data Identifiers |
|||||||||||||||||||||||||||||||||||||||||||||||||
|
|||||||||||||||||||||||||||||||||||||||||||||||||
Time Co-ordinates(UT) |
|||||||||||||||||||||||||||||||||||||||||||||||||
|
|||||||||||||||||||||||||||||||||||||||||||||||||
Spatial Co-ordinates | |||||||||||||||||||||||||||||||||||||||||||||||||
|
|||||||||||||||||||||||||||||||||||||||||||||||||
Parameters |
|||||||||||||||||||||||||||||||||||||||||||||||||
|
|||||||||||||||||||||||||||||||||||||||||||||||||
|
|||||||||||||||||||||||||||||||||||||||||||||||||
Problem Reports
No Problem Report Found in the Database
Data Access Policy
Open Data
These data have no specific confidentiality restrictions for users. However, users must acknowledge data sources as it is not ethical to publish data without proper attribution. Any publication or other output resulting from usage of the data should include an acknowledgment.
If the Information Provider does not provide a specific attribution statement, or if you are using Information from several Information Providers and multiple attributions are not practical in your product or application, you may consider using the following:
"Contains public sector information licensed under the Open Government Licence v1.0."
Narrative Documents
YSI 6-Series multiparameter water quality sondes
Basic information
Comprehensive multi-parameter, water quality monitoring sondes. Designed for long-term monitoring, profiling and spot sampling. The 6-series may be split into several categories: V2 Sondes, 600 Sondes, Drinking Water Sondes and System. Each category has a slightly different design purpose with V2 Sondes ideal for long-term monitoring with a greater number of parameters, whereas 600 sondes are ideal for specific applications with fewer parameters available.
Model features/parameters
| Features/Parameters | V2 Sondes | 600 Sondes | Drinking Water | System | ||||||||
|---|---|---|---|---|---|---|---|---|---|---|---|---|
| 6600 | 6600EDS | 6920 | 6820 | 600OMS | 600R | 600XL | 600XLM | 600LS | 6920DW | 600DW-B | 600QS | |
| Field-replaceable probes | S | S | S | S | S | S | S | S | S | |||
| RS-232 and SDI-12 standard | S | S | S | S | S | S | S | S | S | S | S | S |
| Fits 2" wells | S | S | S | S | S | S | S | |||||
| Internal memory | S | S | S | S | S | S | S | S | S | S | S | S |
| Internal power (batteries) | S | S | S | CS | S | CS | S | S | ||||
| Flow cell | CS | SO | CS | CS | CS | CS | CS | CS | CS | CS | ||
| Ammonium/ammonia* | I | CS | CS | SO | SO | |||||||
| Blue green algae | CS | CS | CS | CS | CS | R1 | R1 | |||||
| Chloride* | I | CS | CS | SO | SO | |||||||
| Chlorophyll | CS | CS | CS | CS | CS | R1 | R1 | |||||
| Conductivity | S | S | S | S | S | S | S | S | CS | S | S | S |
| Depth | CS | CS | CS | CS | CS | CS | CS | CS | ||||
| Dissolved oxygen | I | CS | R2 | R2 | CS | CS | CS | CS | ||||
| Dissolved oxygen, optical | CS | CS | CS | CS | CS | R1 | R1 | |||||
| Free chlorine | CS | CS | ||||||||||
| Nitrate* | I | CS | CS | SO | SO | |||||||
| Open channel flow** | CS | CS | CS | CS | CS | CS | CS | S | ||||
| ORP | CS | CS | CS | CS | CS | CS | CS | CS | CS | |||
| PAR (Photosynthetically Active Radiation) | I | I | ||||||||||
| pH | CS | CS | CS | CS | CS | CS | CS | CS | CS | CS | ||
| Resistivity** | S | S | S | S | S | S | S | S | CS | S | S | S |
| Rhodamine | CS | CS | CS | CS | CS | R1 | R1 | |||||
| Salinity | S | S | S | S | S | S | S | S | CS | S | S | S |
| Specific conductance** | S | S | S | S | S | S | S | S | CS | S | S | S |
| Temperature | S | S | S | S | S | S | S | S | S | S | S | S |
| Total dissolved solids** | S | S | S | S | S | S | S | S | CS | S | S | S |
| Turbidity | CS | CS | CS | CS | CS | R1 | R1 | CS | ||||
| Vented level | CS | CS | CS | CS | CS | CS | CS | S | ||||
*Freshwater only**Calculated parameters
| Where | ||
| S | = | Standard |
| CS | = | Customer Selectable |
| SO | = | Special Order |
| R1 | = | Available only on 600XL V2 or 600XLM V2 |
| R2 | = | Available on 6920 V2-1 or 6820 V2-1 |
| I | = | Available only on 6600 V2-2 |
Sensor Specifications
| Range | Resolution | Accuracy | |
|---|---|---|---|
| Rapid Pulse dissolved oxygen % air saturation | 0 to 500% | 0.1% | 0 to 200%: ±2% of reading or 2% air saturation saturation, whichever is greater; 200 to 500%: ±6% of reading |
| Rapid Pulse dissolved oxygen mg/L | 0 to 50 mg/L | 0.01 mg/L | 0 to 20 mg/L: ±2% of reading or 0.2 mg/L, mg/L whichever is greater; 20 to 50 mg/L: ±6% of reading |
| ROX optical dissolved oxygena % air saturation | 0 to 500% | 0.1% | 0 to 200%: ±1% of reading or 1% air % air saturation saturation, whichever is greater; 200 to 500%: ±15% of reading; relative to calibration gases |
| ROX optical dissolved oxygena mg/L | 0 to 50 mg/L | 0.01 mg/L | 0 to 20 mg/L: ±1% of reading or 0.1 mg/L, mg/L whichever is greater; 20 to 50 mg/L: ±15% of reading; relative to calibration gases |
| Conductivityc | 0 to 100 mS/cm | 0.001 to 0.1 mS/cm | ±0.5% of reading + 0.001 mS/cm (range-dependent) |
| Temperature | -5 to 50°C | 0.01°C | ±0.15°C |
| pH | 0 to 14 units | 0.01 unit | ±0.2 unit |
| Shallow depth | 0 to 9.1 m (0 to 30 ft) | 0.001 m (0.001 ft) | ±0.018 m (±0.06 ft) |
| Medium depth | 0 to 61 m (0 to 200 ft) | 0.001 m (0.001 ft) | ±0.12 m (±0.4 ft) |
| Deep depth | 0 to 200 m (0 to 656 ft) | 0.001 m (0.001 ft) | ±0.3 m (±1 ft) |
| Vented level | 0 to 9.1 m (0 to 30 ft) | 0.001 m (0.001 ft) | ±0.003 m (?0.01 ft) |
| Open-channel flow | Calculated measurement, requires vented level | ||
| Free chlorine | 0 to 3 mg/L | 0.01 mg/L | ±15% of reading or 0.05 mg/L, whichever is greater |
| ORP | -999 to +999 mV | 0.1 mV | ±20 mV in Redox standard solutions |
| Salinity | 0 to 70 ppt | 0.01 ppt | ±1% of reading or 0.1 ppt, whichever is greater |
| Nitrate/nitrogenb | 0 to 200 mg/L-N | 0.001 to 1 mg/L-N | ±10% of reading or 2 mg/L, (range dependent) whichever is greater |
| Ammonium/ammoniab | 0 to 200 mg/L-N | 0.001 to 1 mg/L-N | ±10% of reading or 2 mg/L, nitrogen (range dependent) whichever is greater |
| Chlorideb | 0 to 1000 mg/L | 0.001 to 1 mg/L | ±15% of reading or 5 mg/L, (range dependent) whichever is greater |
| Turbiditya | 0 to 1,000 NTU | 0.1 NTU | ±2% of reading or 0.3 NTU, whichever is greater in YSI AMCO-AEPA Polymer Standards |
| Rhodamine WTa | 0-200 µg/L | 0.1 µg/L | ±5% of reading or ±1 µg/L, whichever is greater |
| Chlorophylla | |||
| Range | Resolution | Linearity | |
| 0 to 400 µg/L chl a | 0.1 µg/L chl a | R2 > 0.9999 for serial dilution of Rhodamine | |
| 0 to 100 RFU | 0.1% FS; 0.1 RFU | WT solution from 0 to 500 µg/L | |
| Blue-green algaea,e phycocyanin | Range | Resolution | Linearity |
| 0-280,000 cells/mL | 220 cells/mL | R2 = 0.9999 for serial dilution of Rhodamine WT from 0 to 400 µg/L | |
| Blue-green algaea,e phycoerythrin | |||
| 0-200,000 cells/mL | 450 cells/mL | R2 = 0.9999 for serial dilution of Rhodamine WT from 0 to 8 µg/L | |
| PAR | Range | Calibration | Stability |
| 400-700 nm waveband | ±5% | < ±2% change over 1 year | |
| Linearity | Sensitivity | ||
| Max. deviation of 1% | Typically 3µA per 1000 mmol s-1 m-2 in water | ||
| a Depth rating for optical probes is 61 m (200 ft); depth rating for anti-fouling optical probes with copper-alloy probe housing is 200 m (656 ft). |
| b Freshwater only. Maximum depth rating of 15.2 m (50 ft). |
| c Report outputs of specific conductance (conductivity correct to 25° C), resistivity, and total dissolved solids are also provided. These values are automatically calculated from conductivity according to algorithms found in Standard Methods for the Examination of Water and Wastewater (ed 1989). |
| d To maintain accuracy specification, flow must be at least 500 mL/min and pH should not change by more than ±0.3 units if mean pH is between 8.5 and 9.3. |
| e Specification determined using monocultures of Isochrysis sp. and fluorometric extraction of chlorophyll a. Actual detection limits will vary depending on natural algae assemblage. |
| f Estimated from cultures of Microcystis aeruginosa. |
| g Estimated from cultures of Synechococcus sp. |
For further information, please see the manufacturer's manual and data sheet.
SEPA Mooring Instrumentation
The SEPA long-term monitoring project has obtained hydrographic data across various moorings through the deployment of a YSI 6600 multi-parameter-sonde attached to a fixed mooring buoy at the surface of the water column.
These mooring sites include: Dunoon, Gunnet Ledge, Inner Clyde Estuary, Campbelltown, Loch Striven, Ythan, Loch Sunart, South Alloa, and Moray Firth.
The South Alloa site had two Hydrolab MS5 probes up until the 3rd of March 2011, at which point a YSI 6600 probe was used.
The Inner Clyde Estuary site also has a probe attached approximately 1 m from the sea floor in addition to the probe at the surface.
The Moray Firth site was monitored solely between July and December 2018.
The depth of the sensors at the time of measurement at each site is available upon request for the 2016 and 2017 data.
The turbidity sensors are deemed, by the manufacturer, to be used as guidance in events such as observing storm events or spotting discharges. SEPA rely on a suspended solids laboratory procedure for their turbidity reported data. The same situation occurs for chlorophyll, SEPA have a lab method they use to report it as high turbidity can interfere with the readings. This is not generally an issue in low turbidity areas.
BODC processing of SEPA's long-term monitoring buoys
Data Acquisition and Transfer
The data were sent by SEPA as yearly .csv files and following BODC's procedures the files were checked for consistency and subsequently archived.
The data were reformatted to QXF format using BODC's established procedures. During the transfer process each yearly file was split into cruise-to-cruise series events. The table below shows how the originator's parameters were mapped to BODC parameters and their units:
| Originator's Parameter | Originator's Units | BODC Parameter Code | BODC Units | Comments |
|---|---|---|---|---|
| Temp | deg C | TEMPPR01 | °C | |
| pH | pH Units | PHXXZZXX | pH Units | |
| Salin | ppt | ODSDM021 | ppt | |
| DO% | % Sat | OXYSZZ01 | % | For legacy data Oxygen saturation is not derived by BODC but taken from the data supplied. |
| DO | mg/l | DOXYZZ01 | µmol/l | Conversion of * 31.252 was applied during transfer (Bittig et al., 2018) |
| Turb | NTU | TURBXXXX | NTU | |
| Chl | µg/l | CPHLZZXX | mg/m3 | |
| Depth | m | PPSBPS01 | m | Depth has been transferred for 2018 onwards, and is available on request for 2016 and 2017. Depth is not available for data previous to 2016. |
Data Quality and Screening
Not all parameters occur in all series, particularly pH, turbidity and chlorophyll.
Oxygen saturation is not derived by BODC for consistency across all years and due to missing channels as mentioned in the originator's processing document.
The standard unit conversion factor of * 31.252 was applied to oxygen concentration during transfer to obtain the BODC units of µmol/l. (Bittig et al., 2018)
Post transfer analysis and crosschecks were applied according to BODC procedures. This involved the screening of data to check flags were appropriately applied whilst also applying further quality control flags where appropriate. Originator flags for "No sensor; Quality Control failure; Quality Control Spike Removed; Quality Control Spike removed, wiper incorrectly parking over sensor; Power Failure, Sensor failure" were all flagged as 'Null' as no data were available when these were applied.
References
Bittig, H., Körtzinger, A., Johnson, K., Claustre, H., Emerson, S., Fennel, K., ... & Xing, X. 2018. SCOR WG 142: Quality Control Procedures for Oxygen and Other Biogeochemical Sensors on Floats and Gliders. Recommendations on the conversion between oxygen quantities for Bio-Argo floats and other autonomous sensor platforms.
SEPA originator's processing document for Inner Clyde Estuary long-term monitoring buoy.
Data Acquisition and Analysis
Data were obtained from two YSI probes deployed in the Inner Clyde Estuary. Two separate moorings were deployed at the same location, one with a sensor attached 1 m from the surface and the other with a sensor attached 1 m from the bottom of the river bed. The moorings were serviced and deployed by the Scottish Environment Protection Agency (SEPA) for the purpose of a long-term investigation monitoring dissolved oxygen levels in the given area. All data were submitted in GMT format.
Quality and Screening
Once downloaded the data went through SEPA data quality checks with suspect data removed and relevant flags attached to inform future users of the reasons for any missing data.
Submission
The data were then submitted to BODC through ftp as .csv files.
Project Information
No Project Information held for the Series
Data Activity or Cruise Information
Cruise
| Cruise Name | SJM20180221 |
| Departure Date | 2018-02-21 |
| Arrival Date | 2018-02-21 |
| Principal Scientist(s) | Matthew V Blackburn (Scottish Environment Protection Agency, Edinburgh) |
| Ship | Sir John Murray |
Complete Cruise Metadata Report is available here
Fixed Station Information
Fixed Station Information
| Station Name | SEPA_ICE |
| Category | Coastal location |
| Latitude | 55° 52.07' N |
| Longitude | 4° 19.05' W |
| Water depth below MSL | 7.5 m |
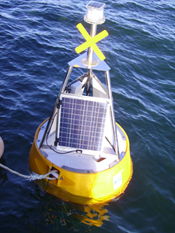
SEPA Inner Clyde Estuary Fixed Station Mooring
| Location name | Inner Clyde Estuary |
|---|---|
| Nominal Latitude (+ve N) | 55.86778 |
| Nominal Longitude (+ve E) | -4.31746 |
| Water depth | 6-9 m |
| Period of data collection | Initiated in 2011 |
The buoy is located in the Clyde estuary and provides measurements of dissolved oxygen, salinity, temperature, pH, chlorophyll and turbidity. Maintenance takes place on a monthly basis using one of SEPA's support vessels. Samples are mostly collected every 15 minutes, with occasional periods where a sample is collected every 30 minutes.
The water depth at the mooring ranges between 6 and 9 m depending on the tide.
More information may be found at the SEPA monitoring buoy network page for Inner Clyde Estuary.
Related Fixed Station activities are detailed in Appendix 1
BODC Quality Control Flags
The following single character qualifying flags may be associated with one or more individual parameters with a data cycle:
| Flag | Description |
|---|---|
| Blank | Unqualified |
| < | Below detection limit |
| > | In excess of quoted value |
| A | Taxonomic flag for affinis (aff.) |
| B | Beginning of CTD Down/Up Cast |
| C | Taxonomic flag for confer (cf.) |
| D | Thermometric depth |
| E | End of CTD Down/Up Cast |
| G | Non-taxonomic biological characteristic uncertainty |
| H | Extrapolated value |
| I | Taxonomic flag for single species (sp.) |
| K | Improbable value - unknown quality control source |
| L | Improbable value - originator's quality control |
| M | Improbable value - BODC quality control |
| N | Null value |
| O | Improbable value - user quality control |
| P | Trace/calm |
| Q | Indeterminate |
| R | Replacement value |
| S | Estimated value |
| T | Interpolated value |
| U | Uncalibrated |
| W | Control value |
| X | Excessive difference |
SeaDataNet Quality Control Flags
The following single character qualifying flags may be associated with one or more individual parameters with a data cycle:
| Flag | Description |
|---|---|
| 0 | no quality control |
| 1 | good value |
| 2 | probably good value |
| 3 | probably bad value |
| 4 | bad value |
| 5 | changed value |
| 6 | value below detection |
| 7 | value in excess |
| 8 | interpolated value |
| 9 | missing value |
| A | value phenomenon uncertain |
| B | nominal value |
| Q | value below limit of quantification |
Appendix 1: SEPA_ICE
Related series for this Fixed Station are presented in the table below. Further information can be found by following the appropriate links.
If you are interested in these series, please be aware we offer a multiple file download service. Should your credentials be insufficient for automatic download, the service also offers a referral to our Enquiries Officer who may be able to negotiate access.
| Series Identifier | Data Category | Start date/time | Start position | Cruise |
|---|---|---|---|---|
| 1774458 | Hydrography time series at depth | 2011-08-03 09:00:00 | 55.86778 N, 4.31745 W | Sir John Murray SJM20110803 |
| 1774422 | Hydrography time series at depth | 2011-08-03 09:30:00 | 55.86778 N, 4.31745 W | Sir John Murray SJM20110803 |
| 1774471 | Hydrography time series at depth | 2011-08-15 12:30:00 | 55.86778 N, 4.31745 W | Sir John Murray SJM20110815 |
| 1774434 | Hydrography time series at depth | 2011-08-30 09:15:00 | 55.86778 N, 4.31745 W | Sir John Murray SJM20110830 |
| 1774483 | Hydrography time series at depth | 2011-09-28 09:45:00 | 55.86778 N, 4.31745 W | Sir John Murray SJM20110928 |
| 1774495 | Hydrography time series at depth | 2011-10-30 12:30:00 | 55.86778 N, 4.31745 W | Sir John Murray SJM20111030 |
| 1774502 | Hydrography time series at depth | 2011-12-06 12:15:00 | 55.86778 N, 4.31745 W | Sir John Murray SJM20111206 |
| 1774446 | Hydrography time series at depth | 2011-12-06 12:30:00 | 55.86778 N, 4.31745 W | Sir John Murray SJM20111206 |
| 1774514 | Hydrography time series at depth | 2012-01-01 00:00:00 | 55.86778 N, 4.31745 W | Sir John Murray SJM20111206 |
| 1774631 | Hydrography time series at depth | 2012-01-01 00:00:00 | 55.86778 N, 4.31745 W | Sir John Murray SJM20111206 |
| 1774526 | Hydrography time series at depth | 2012-02-23 11:15:00 | 55.86778 N, 4.31745 W | Sir John Murray SJM20120223 |
| 1774538 | Hydrography time series at depth | 2012-03-21 10:30:00 | 55.86778 N, 4.31745 W | Sir John Murray SJM20120321 |
| 1774551 | Hydrography time series at depth | 2012-05-29 10:15:00 | 55.86778 N, 4.31745 W | Sir John Murray SJM20120529 |
| 1774563 | Hydrography time series at depth | 2012-06-26 12:00:00 | 55.86778 N, 4.31745 W | Sir John Murray SJM20120626 |
| 1774575 | Hydrography time series at depth | 2012-07-18 11:00:00 | 55.86778 N, 4.31745 W | Sir John Murray SJM20120718 |
| 1774587 | Hydrography time series at depth | 2012-08-07 12:15:00 | 55.86778 N, 4.31745 W | Sir John Murray SJM20120807 |
| 1774599 | Hydrography time series at depth | 2012-09-05 09:00:00 | 55.86778 N, 4.31745 W | Sir John Murray SJM20120905 |
| 1774606 | Hydrography time series at depth | 2012-10-30 10:30:00 | 55.86778 N, 4.31745 W | Sir John Murray SJM20121030 |
| 1774618 | Hydrography time series at depth | 2012-12-07 10:15:00 | 55.86778 N, 4.31745 W | Sir John Murray SJM20121207 |
| 1778460 | Hydrography time series at depth | 2013-01-01 00:00:00 | 55.86778 N, 4.31745 W | Sir John Murray SJM20121207 |
| 1778472 | Hydrography time series at depth | 2013-01-17 10:30:00 | 55.86778 N, 4.31745 W | Sir John Murray SJM20130117 |
| 1778484 | Hydrography time series at depth | 2013-02-14 10:45:00 | 55.86778 N, 4.31745 W | Sir John Murray SJM20130214 |
| 1778496 | Hydrography time series at depth | 2013-06-14 09:30:00 | 55.86778 N, 4.31745 W | Sir John Murray SJM20130614 |
| 1778503 | Hydrography time series at depth | 2013-07-08 23:00:00 | 55.86778 N, 4.31745 W | Sir John Murray SJM20130708 |
| 1778515 | Hydrography time series at depth | 2013-08-07 11:00:00 | 55.86778 N, 4.31745 W | Sir John Murray SJM20130807 |
| 1778552 | Hydrography time series at depth | 2013-09-10 11:00:00 | 55.86778 N, 4.31745 W | Sir John Murray SJM20130910 |
| 1778527 | Hydrography time series at depth | 2013-09-10 13:00:00 | 55.86778 N, 4.31745 W | Sir John Murray SJM20130910 |
| 1778564 | Hydrography time series at depth | 2013-10-29 12:00:00 | 55.86778 N, 4.31745 W | Sir John Murray SJM20131029 |
| 1778539 | Hydrography time series at depth | 2013-10-29 13:00:00 | 55.86778 N, 4.31745 W | Sir John Murray SJM20131029 |
| 1778576 | Hydrography time series at depth | 2013-12-12 13:01:00 | 55.86778 N, 4.31745 W | Sir John Murray SJM20131212 |
| 1778540 | Hydrography time series at depth | 2013-12-12 14:00:00 | 55.86778 N, 4.31745 W | Sir John Murray SJM20131212 |
| 1763657 | Hydrography time series at depth | 2014-01-21 12:00:00 | 55.86778 N, 4.31745 W | Sir John Murray SJM 20140121 |
| 1763762 | Hydrography time series at depth | 2014-01-21 12:01:00 | 55.86778 N, 4.31745 W | Sir John Murray SJM 20140121 |
| 1763774 | Hydrography time series at depth | 2014-02-19 13:31:00 | 55.86778 N, 4.31745 W | Sir John Murray SJM 20140219 |
| 1763669 | Hydrography time series at depth | 2014-02-21 01:00:00 | 55.86778 N, 4.31745 W | Sir John Murray SJM 20140221 |
| 1763786 | Hydrography time series at depth | 2014-03-04 11:31:00 | 55.86778 N, 4.31745 W | Sir John Murray SJM 20140304 |
| 1763670 | Hydrography time series at depth | 2014-03-04 12:00:00 | 55.86778 N, 4.31745 W | Sir John Murray SJM 20140304 |
| 1763798 | Hydrography time series at depth | 2014-04-02 11:01:00 | 55.86778 N, 4.31745 W | Sir John Murray SJM 20140402 |
| 1763682 | Hydrography time series at depth | 2014-04-02 12:30:00 | 55.86778 N, 4.31745 W | Sir John Murray SJM 20140402 |
| 1763805 | Hydrography time series at depth | 2014-05-07 12:01:00 | 55.86778 N, 4.31745 W | Sir John Murray SJM 20140507 |
| 1763694 | Hydrography time series at depth | 2014-05-07 12:30:00 | 55.86778 N, 4.31745 W | Sir John Murray SJM 20140507 |
| 1763701 | Hydrography time series at depth | 2014-07-09 11:00:00 | 55.86778 N, 4.31745 W | Sir John Murray SJM 20140709 |
| 1763817 | Hydrography time series at depth | 2014-07-09 11:31:00 | 55.86778 N, 4.31745 W | Sir John Murray SJM 20140709 |
| 1763713 | Hydrography time series at depth | 2014-08-20 11:30:00 | 55.86778 N, 4.31745 W | Sir John Murray SJM 20140820 |
| 1763829 | Hydrography time series at depth | 2014-08-20 11:46:00 | 55.86778 N, 4.31745 W | Sir John Murray SJM 20140820 |
| 1763830 | Hydrography time series at depth | 2014-09-09 11:46:00 | 55.86778 N, 4.31745 W | Sir John Murray SJM 20140909 |
| 1763725 | Hydrography time series at depth | 2014-09-09 13:29:00 | 55.86778 N, 4.31745 W | Sir John Murray SJM 20140909 |
| 1763842 | Hydrography time series at depth | 2014-10-21 11:16:00 | 55.86778 N, 4.31745 W | Sir John Murray SJM 20141021 |
| 1763737 | Hydrography time series at depth | 2014-10-22 11:45:00 | 55.86778 N, 4.31745 W | Sir John Murray SJM 20141022 |
| 1763749 | Hydrography time series at depth | 2014-11-19 12:15:00 | 55.86778 N, 4.31745 W | Sir John Murray SJM 20141119 |
| 1763854 | Hydrography time series at depth | 2014-11-19 12:31:00 | 55.86778 N, 4.31745 W | Sir John Murray SJM 20141119 |
| 1763866 | Hydrography time series at depth | 2014-12-11 07:46:00 | 55.86778 N, 4.31745 W | Sir John Murray SJM 20141211 |
| 1763750 | Hydrography time series at depth | 2014-12-11 11:45:00 | 55.86778 N, 4.31745 W | Sir John Murray SJM 20141211 |
| 1805220 | Hydrography time series at depth | 2015-01-01 00:01:00 | 55.86778 N, 4.31746 W | Sir John Murray SJM 20141211 |
| 1805373 | Hydrography time series at depth | 2015-01-01 00:01:00 | 55.86778 N, 4.31746 W | Sir John Murray SJM 20141211 |
| 1805232 | Hydrography time series at depth | 2015-01-21 12:01:00 | 55.86778 N, 4.31746 W | Sir John Murray SJM 20150121 |
| 1805385 | Hydrography time series at depth | 2015-01-21 12:16:00 | 55.86778 N, 4.31746 W | Sir John Murray SJM 20150121 |
| 1805244 | Hydrography time series at depth | 2015-02-03 13:01:00 | 55.86778 N, 4.31746 W | Sir John Murray SJM 20150203 |
| 1805404 | Hydrography time series at depth | 2015-03-18 12:16:00 | 55.86778 N, 4.31746 W | Sir John Murray SJM 20150318 |
| 1805256 | Hydrography time series at depth | 2015-03-18 13:31:00 | 55.86778 N, 4.31746 W | Sir John Murray SJM 20150318 |
| 1805268 | Hydrography time series at depth | 2015-04-15 11:31:00 | 55.86778 N, 4.31746 W | Sir John Murray SJM 20150415 |
| 1805416 | Hydrography time series at depth | 2015-05-19 11:16:00 | 55.86778 N, 4.31746 W | Sir John Murray SJM 20150519 |
| 1805281 | Hydrography time series at depth | 2015-05-19 12:46:00 | 55.86778 N, 4.31746 W | Sir John Murray SJM 20150519 |
| 1805293 | Hydrography time series at depth | 2015-06-04 10:31:00 | 55.86778 N, 4.31746 W | Sir John Murray SJM 20150604 |
| 1805428 | Hydrography time series at depth | 2015-06-04 10:31:00 | 55.86778 N, 4.31746 W | Sir John Murray SJM 20150604 |
| 1805441 | Hydrography time series at depth | 2015-07-21 10:31:00 | 55.86778 N, 4.31746 W | Sir John Murray SJM 20150721 |
| 1805453 | Hydrography time series at depth | 2015-08-12 10:31:00 | 55.86778 N, 4.31746 W | Sir John Murray SJM 20150812 |
| 1805312 | Hydrography time series at depth | 2015-08-12 10:46:00 | 55.86778 N, 4.31746 W | Sir John Murray SJM 20150812 |
| 1805465 | Hydrography time series at depth | 2015-09-16 10:31:00 | 55.86778 N, 4.31746 W | Sir John Murray SJM 20150916 |
| 1805336 | Hydrography time series at depth | 2015-10-07 09:31:00 | 55.86778 N, 4.31746 W | Sir John Murray SJM 20151007 |
| 1805477 | Hydrography time series at depth | 2015-10-07 09:31:00 | 55.86778 N, 4.31746 W | Sir John Murray SJM 20151007 |
| 1805489 | Hydrography time series at depth | 2015-11-24 11:46:00 | 55.86778 N, 4.31746 W | Sir John Murray SJM 20151124 |
| 1805348 | Hydrography time series at depth | 2015-11-24 12:01:00 | 55.86778 N, 4.31746 W | Sir John Murray SJM 20151124 |
| 1805361 | Hydrography time series at depth | 2015-12-15 11:31:00 | 55.86778 N, 4.31746 W | Sir John Murray SJM 20151215 |
| 1805490 | Hydrography time series at depth | 2015-12-15 11:46:00 | 55.86778 N, 4.31746 W | Sir John Murray SJM 20151215 |
| 1806597 | Hydrography time series at depth | 2016-01-01 00:01:00 | 55.86778 N, 4.31746 W | Sir John Murray SJM 20151215 |
| 1806745 | Hydrography time series at depth | 2016-01-01 00:01:00 | 55.86778 N, 4.31746 W | Sir John Murray SJM 20151215 |
| 1806604 | Hydrography time series at depth | 2016-01-12 11:46:00 | 55.86778 N, 4.31746 W | Sir John Murray SJM20160112 |
| 1806757 | Hydrography time series at depth | 2016-01-12 12:01:00 | 55.86778 N, 4.31746 W | Sir John Murray SJM20160112 |
| 1806616 | Hydrography time series at depth | 2016-02-11 11:16:00 | 55.86778 N, 4.31746 W | Sir John Murray SJM20160211 |
| 1806628 | Hydrography time series at depth | 2016-03-08 11:46:00 | 55.86778 N, 4.31746 W | Sir John Murray SJM20160308 |
| 1806769 | Hydrography time series at depth | 2016-03-08 12:01:00 | 55.86778 N, 4.31746 W | Sir John Murray SJM20160308 |
| 1806641 | Hydrography time series at depth | 2016-04-14 11:16:00 | 55.86778 N, 4.31746 W | Sir John Murray SJM20160414 |
| 1806770 | Hydrography time series at depth | 2016-04-14 11:16:00 | 55.86778 N, 4.31746 W | Sir John Murray SJM20160414 |
| 1806653 | Hydrography time series at depth | 2016-05-10 10:31:00 | 55.86778 N, 4.31746 W | Sir John Murray SJM20160510 |
| 1806782 | Hydrography time series at depth | 2016-05-10 10:31:00 | 55.86778 N, 4.31746 W | Sir John Murray SJM20160510 |
| 1806665 | Hydrography time series at depth | 2016-06-07 10:16:00 | 55.86778 N, 4.31746 W | Sir John Murray SJM20160607 |
| 1806794 | Hydrography time series at depth | 2016-06-07 10:16:00 | 55.86778 N, 4.31746 W | Sir John Murray SJM20160607 |
| 1806677 | Hydrography time series at depth | 2016-07-06 10:16:00 | 55.86778 N, 4.31746 W | Sir John Murray SJM20160706 |
| 1806801 | Hydrography time series at depth | 2016-07-06 10:16:00 | 55.86778 N, 4.31746 W | Sir John Murray SJM20160706 |
| 1806813 | Hydrography time series at depth | 2016-08-03 11:15:00 | 55.86778 N, 4.31746 W | Sir John Murray SJM20160803 |
| 1806689 | Hydrography time series at depth | 2016-08-03 11:31:00 | 55.86778 N, 4.31746 W | Sir John Murray SJM20160803 |
| 1806825 | Hydrography time series at depth | 2016-09-06 11:30:00 | 55.86778 N, 4.31746 W | Sir John Murray SJM20160906 |
| 1806690 | Hydrography time series at depth | 2016-09-06 11:31:00 | 55.86778 N, 4.31746 W | Sir John Murray SJM20160906 |
| 1806708 | Hydrography time series at depth | 2016-10-06 11:45:00 | 55.86778 N, 4.31746 W | Sir John Murray SJM20161006 |
| 1806837 | Hydrography time series at depth | 2016-10-06 12:15:00 | 55.86778 N, 4.31746 W | Sir John Murray SJM20161006 |
| 1806721 | Hydrography time series at depth | 2016-11-02 11:00:00 | 55.86778 N, 4.31746 W | Sir John Murray SJM20161102 |
| 1806849 | Hydrography time series at depth | 2016-11-02 11:00:00 | 55.86778 N, 4.31746 W | Sir John Murray SJM20161102 |
| 1806733 | Hydrography time series at depth | 2016-12-07 12:00:00 | 55.86778 N, 4.31746 W | Sir John Murray SJM20161207 |
| 1806850 | Hydrography time series at depth | 2016-12-07 12:00:00 | 55.86778 N, 4.31746 W | Sir John Murray SJM20161207 |
| 2046693 | Hydrography time series at depth | 2018-01-01 00:00:00 | 55.86778 N, 4.31746 W | Sir John Murray SJM20171213 |
| 2046816 | Hydrography time series at depth | 2018-01-01 00:00:00 | 55.86778 N, 4.31746 W | Sir John Murray SJM20171213 |
| 2046700 | Hydrography time series at depth | 2018-01-31 11:00:00 | 55.86778 N, 4.31746 W | Sir John Murray SJM20180131 |
| 2046828 | Hydrography time series at depth | 2018-01-31 11:45:00 | 55.86778 N, 4.31746 W | Sir John Murray SJM20180131 |
| 2046853 | Hydrography time series at depth | 2018-03-07 11:45:00 | 55.86778 N, 4.31746 W | Sir John Murray SJM20180307 |
| 2046712 | Hydrography time series at depth | 2018-03-07 12:00:00 | 55.86778 N, 4.31746 W | Sir John Murray SJM20180307 |
| 2046724 | Hydrography time series at depth | 2018-04-25 09:45:00 | 55.86778 N, 4.31746 W | Sir John Murray SJM20180425 |
| 2046736 | Hydrography time series at depth | 2018-05-09 09:15:00 | 55.86778 N, 4.31746 W | Sir John Murray SJM20180509 |
| 2046865 | Hydrography time series at depth | 2018-05-09 09:45:00 | 55.86778 N, 4.31746 W | Sir John Murray SJM20180509 |
| 2046748 | Hydrography time series at depth | 2018-06-13 10:15:00 | 55.86778 N, 4.31746 W | Sir John Murray SJM20180613 |
| 2046761 | Hydrography time series at depth | 2018-07-04 10:45:00 | 55.86778 N, 4.31746 W | Sir John Murray SJM20180704 |
| 2046773 | Hydrography time series at depth | 2018-08-08 11:15:00 | 55.86778 N, 4.31746 W | Sir John Murray SJM20180808 |
| 2046877 | Hydrography time series at depth | 2018-09-11 11:00:00 | 55.86778 N, 4.31746 W | Sir John Murray SJM20180911 |
| 2046785 | Hydrography time series at depth | 2018-10-25 09:30:00 | 55.86778 N, 4.31746 W | Sir John Murray SJM20181025 |
| 2046889 | Hydrography time series at depth | 2018-10-25 09:45:00 | 55.86778 N, 4.31746 W | Sir John Murray SJM20181025 |
| 2046797 | Hydrography time series at depth | 2018-11-07 12:00:00 | 55.86778 N, 4.31746 W | Sir John Murray SJM20181107 |
| 2046890 | Hydrography time series at depth | 2018-11-07 12:00:00 | 55.86778 N, 4.31746 W | Sir John Murray SJM20181107 |
| 2046804 | Hydrography time series at depth | 2018-12-12 11:45:00 | 55.86778 N, 4.31746 W | Sir John Murray SJM20181212 |
| 2046908 | Hydrography time series at depth | 2018-12-12 12:30:00 | 55.86778 N, 4.31746 W | Sir John Murray SJM20181212 |
