Metadata Report for BODC Series Reference Number 1075614
Metadata Summary
Problem Reports
Data Access Policy
Narrative Documents
Project Information
Data Activity or Cruise Information
Fixed Station Information
BODC Quality Flags
SeaDataNet Quality Flags
Metadata Summary
Data Description |
|||||||||||||||||||||||||||||
|
|||||||||||||||||||||||||||||
Data Identifiers |
|||||||||||||||||||||||||||||
|
|||||||||||||||||||||||||||||
Time Co-ordinates(UT) |
|||||||||||||||||||||||||||||
|
|||||||||||||||||||||||||||||
Spatial Co-ordinates | |||||||||||||||||||||||||||||
|
|||||||||||||||||||||||||||||
Parameters |
|||||||||||||||||||||||||||||
|
|||||||||||||||||||||||||||||
|
|||||||||||||||||||||||||||||
Problem Reports
No Problem Report Found in the Database
Data Access Policy
Open Data
These data have no specific confidentiality restrictions for users. However, users must acknowledge data sources as it is not ethical to publish data without proper attribution. Any publication or other output resulting from usage of the data should include an acknowledgment.
If the Information Provider does not provide a specific attribution statement, or if you are using Information from several Information Providers and multiple attributions are not practical in your product or application, you may consider using the following:
"Contains public sector information licensed under the Open Government Licence v1.0."
Narrative Documents
Falmouth Scientific Inc. OEM CT sensor
The OEM CT sensor is designed to provide high accuracy conductivity and temperature measurements in a package that can be readily integrated into user systems. The CT sensor relies on an inductively coupled conductivity sensor, with a large inside diameter that eliminates the need for pumps. A high grade Platinum Resistance Thermometer is used to measure temperature.
Sensor specifications are given in the table below. Since 2009 this instrument has been manufactured by Teledyne RD Instruments as a Citadel CT-EK Sensor. More information about the instrument can be found on the Teledyne Citadel specification sheet.
Sensor Specifications
| Instrument Parameter | Small CT Cell Conductivity | Large CT Cell Conductivity | Temperature | |
|---|---|---|---|---|
| Range | 0 to 70 mS cm-1 | 0 to 70 mS cm-1 | -2 to 35 degrees C | |
| Accuracy | ±0.020 mS cm-1 | ±0.010 mS cm-1 | ±0.050 degrees C | |
| Stability | ±0.005 mS cm-1 mo-1 | ±0.003 mS cm-1 | ±0.005 degrees C mo-1 | |
| Response | 20 cm @ 1 m s-1 | 15 cm @ 1 m s-1 | 20 seconds internal, 1 second external |
| Power Input | 50 mW @ 6 VDC, voltage range 6 - 14 VDC |
|---|---|
| Logic | 2 0 - 5 VDC control lines |
| Output Impedance | 500 ohms |
Cefas SmartBuoy data processing
This document outlines the procedures in place at Cefas in August 2005 for processing and quality assuring SmartBuoy data.
Raw data files are processed and the data move through 4 levels, starting with raw data at level 0 through to level 3, where data are fully quality-assured and expressed in appropriate units. The application of the procedures at each level result in data deemed fit to progress to the next level.
Cefas Quality Assurance (QA) Protocols
At Level 0, raw binary data files from the loggers are transferred to the network.
Automated checks - Level 1
Level 1 involves applying automated quality assurance procedures to the data. These include the following steps:
- Burst data are loaded into memory for processing.
- Calibration data for all instruments and sensors used on the deployment are retrieved from the SmartBuoy database. These may be manufacturers' sensor calibrations or the most current laboratory calibrations. Instruments are returned to the manufacturer and re-calibrated at regular intervals.
- mV are converted to volts, where necessary.
- LiCor signals are converted from Volts to PAR irradiance in µE m-2 s-1.
- Salinity is derived from C and T using UNESCO 88 (PSS78) formula.
- Burst data maximum and minimum ranges are checked and flagged if they fail the checks.
- Burst means, result count, and result standard deviation are calculated from non-flagged burst data.
- If there are data from two PAR sensors at different depths, Kd (m-1) is calculated for burst mean data only as LN(PAR1m/PAR2m).
- Burst mean data maximum, minimum and rate of change checks are carried out and flags applied to any failures.
- Time stamped burst and burst mean data with default units are stored on SmartBuoy database.
The data are now at QA status = 1.
Manual checks - Level 2
Level 1 burst mean data are now ready for manual QA procedures in order to progress to Level 2. Deployment notes are consulted for any comments on sensor performance or malfunction and post-deployment photographs of sensors, if available, are examined.
Cefas use a data visualisation tool to examine the SmartBuoy data.
- A comparison is made between the end of one deployment with beginning of the next to identify possible drift and/or biofouling of OBS, Fluorometer, Salinity, PAR, and oxygen sensors.
- Battery voltages are checked for sudden jumps and, if present, other sensors are examined for similar jumps to determine whether there is a problem with the sensor or if the buoy was disturbed.
- Reference voltages on the FSI CT module are checked.
- The standard deviation of OBS is examined. A steady increase in standard deviation is a good indication of the onset of biofouling. It is also used as a rough indicator for fluorometers during summer, except during spring, when there are large fluctuations in chlorophyll.
- Li-Cor is examined for fouling, which could be indicated by a steady drop in daily maximum or a steady increase in standard deviation. If above-water Li-Cor data are available, they are used for comparison.
- Pressure is examined for sudden decreases, indicating when the buoy was taken out of the water.
- Roll and pitch are examined for any anomalies. It is expected that the spring/neap cycle will be present in the buoy tilt signal.
- Where possible, comparison is made between burst mean data from sensors measuring the same variable. This is in order to determine whether there is a systematic offset (drift) or sensor fault and whether biofouling is present.
- Comparison is made between burst mean sensor outputs from different variables as this can be helpful in determining the onset of biofouling. Any data that fail the checks are flagged with flags specific to the check that was failed.
Calibrations - Level 3
The combined information from Level 2 is used to determine the periods during which the data series are considered suspect. The data have now reached QA status = 2 and can progress to Level 3, where they will be fully calibrated with field-derived sample data.
- For salinity an offset is calculated as the difference between result output from logger and the result from a discrete sample collected at the same time.
- Calibration from regression analysis of field samples and logger output is applied to derive new parameters, e.g. chlorophyll calculated from fluorescence, suspended load calculated from OBS.
- Chlorophyll calibrations are determined from GF/F filtered water samples, which are extracted in acetone and measured for fluorescence using a Turner Designs Fluorometer.
- Suspended matter calibrations are determined from a known volume of water sample filtered through pre-weighed 0.4 µm Cyclopore filters. The filters are dried and reweighed to determine the weight of material per unit volume.
- Salinity is calibrated using water samples that have been analysed with a Guildline Autosal salinometer.
- Water samples from the Aqua Monitor are analysed for nutrients by colorimetric analysis of 0.4 µm Cyclopore-filtered samples.
The data have now reached QA status = 3 as time stamped, field calibrated burst mean data with parameter codes and units stored on SmartBuoy database with associated uncertainty or 95% confidence limits as appropriate. All SmartBuoy data banked at BODC have passed full Cefas QA procedures. Data that fail the Cefas QA checks are not submitted for banking.
SmartBuoy data processing by BODC
The following outlines the procedures that take place at BODC for banking Cefas SmartBuoy data.
BODC receives SmartBuoy data from Cefas after all quality checks have been passed and all possible calibrations applied. The data files are submitted as separate MS Excel spreadsheets for each parameter, i.e. there are separate files for temperature and salinity from the same instrument. An exact copy of the data is archived for safekeeping upon arrival.
Once the submitted data files are safely archived, the data undergo standard reformatting and banking procedures:
- The data files are reformatted using an in-house program into a common format, which is a NetCDF subset.
- Data files arising from the same instrument are combined into a single file.
- Standard parameter codes are assigned that accurately describe the data.
- Unit conversions are applied, if necessary, so that units are standardised. Oxygen concentration supplied by the originator in units of mg l-1 is converted to µmol l-1 by multiplying by 31.25.
- The data are screened visually and any spikes or instrument malfunctions can be clearly labelled with quality control flags.
- Comprehensive documentation is prepared describing the collection, processing and quality of each data series.
- Detailed metadata and documents are loaded to the database and linked to each series so that the information is readily available to future users.
Project Information
Oceans 2025 - The NERC Marine Centres' Strategic Research Programme 2007-2012
Who funds the programme?
The Natural Environment Research Council (NERC) funds the Oceans 2025 programme, which was originally planned in the context of NERC's 2002-2007 strategy and later realigned to NERC's subsequent strategy (Next Generation Science for Planet Earth; NERC 2007).
Who is involved in the programme?
The Oceans 2025 programme was designed by and is to be implemented through seven leading UK marine centres. The marine centres work together in coordination and are also supported by cooperation and input from government bodies, universities and other partners. The seven marine centres are:
- National Oceanography Centre, Southampton (NOCS)
- Plymouth Marine Laboratory (PML)
- Marine Biological Association (MBA)
- Sir Alister Hardy Foundation for Marine Science (SAHFOS)
- Proudman Oceanographic Laboratory (POL)
- Scottish Association for Marine Science (SAMS)
- Sea Mammal Research Unit (SMRU)
Oceans2025 provides funding to three national marine facilities, which provide services to the wider UK marine community, in addition to the Oceans 2025 community. These facilities are:
- British Oceanographic Data Centre (BODC), hosted at POL
- Permanent Service for Mean Sea Level (PSMSL), hosted at POL
- Culture Collection of Algae and Protozoa (CCAP), hosted at SAMS
The NERC-run Strategic Ocean Funding Initiative (SOFI) provides additional support to the programme by funding additional research projects and studentships that closely complement the Oceans 2025 programme, primarily through universities.
What is the programme about?
Oceans 2025 sets out to address some key challenges that face the UK as a result of a changing marine environment. The research funded through the programme sets out to increase understanding of the size, nature and impacts of these changes, with the aim to:
- improve knowledge of how the seas behave, not just now but in the future;
- help assess what that might mean for the Earth system and for society;
- assist in developing sustainable solutions for the management of marine resources for future generations;
- enhance the research capabilities and facilities available for UK marine science.
In order to address these aims there are nine science themes supported by the Oceans 2025 programme:
- Climate, circulation and sea level (Theme 1)
- Marine biogeochemical cycles (Theme 2)
- Shelf and coastal processes (Theme 3)
- Biodiversity and ecosystem functioning (Theme 4)
- Continental margins and deep ocean (Theme 5)
- Sustainable marine resources (Theme 6)
- Technology development (Theme 8)
- Next generation ocean prediction (Theme 9)
- Integration of sustained observations in the marine environment (Theme 10)
In the original programme proposal there was a theme on health and human impacts (Theme 7). The elements of this Theme have subsequently been included in Themes 3 and 9.
When is the programme active?
The programme started in April 2007 with funding for 5 years.
Brief summary of the programme fieldwork/data
Programme fieldwork and data collection are to be achieved through:
- physical, biological and chemical parameters sampling throughout the North and South Atlantic during collaborative research cruises aboard NERC's research vessels RRS Discovery, RRS James Cook and RRS James Clark Ross;
- the Continuous Plankton Recorder being deployed by SAHFOS in the North Atlantic and North Pacific on 'ships of opportunity';
- physical parameters measured and relayed in near real-time by fixed moorings and ARGO floats;
- coastal and shelf sea observatory data (Liverpool Bay Coastal Observatory (LBCO) and Western Channel Observatory (WCO)) using the RV Prince Madog and RV Quest.
The data is to be fed into models for validation and future projections. Greater detail can be found in the Theme documents.
Oceans 2025 Theme 10
Oceans 2025 is a strategic marine science programme, bringing marine researchers together to increase people's knowledge of the marine environment so that they are better able to protect it for future generations.
Theme 10: Integration of Sustained Observations in the Marine Environment spans all marine domains from the sea-shore to the global ocean, providing data and knowledge on a wide range of ecosystem properties and processes (from ocean circulation to biodiversity) that are critical to understanding Earth system behaviour and identifying change. They have been developed not merely to provide long-term data sets, but to capture extreme or episodic events, and play a key role in the initialisation and validation of models. Many of these SOs will be integrated into the newly developing UK Marine Monitoring Strategy - evolving from the Defra reports Safeguarding our Seas (2002) and Charting Progress (2005), thus contributing to the underpinning knowledge for national marine stewardship. They will also contribute to the UK GOOS Strategic Plan (IACMST, 2006) and the Global Marine Assessment.
Weblink: http://www.oceans2025.org/
Oceans 2025 Theme 10, Sustained Observation Activity 11: Liverpool Bay and Irish Sea Coastal Observatory
Sustained, systematic observations of the ocean and continental shelf seas at appropriate time and space scales allied to numerical models are key to understanding and prediction. In shelf seas these observations address issues as fundamental as 'what is the capacity of shelf seas to absorb change?' encompassing the impacts of climate change, biological productivity and diversity, sustainable management, pollution and public health, safety at sea and extreme events. Advancing understanding of coastal processes to use and manage these resources better is challenging; important controlling processes occur over a broad range of spatial and temporal scales which cannot be simultaneously studied solely with satellite or ship-based platforms.
Considerable effort has been spent by the Proudman Oceangraphic Laboratory (POL) in the years 2001 - 2006 in setting up an integrated observational and now-cast modelling system in Liverpool Bay (see Figure), with the recent POL review stating the observatory was seen as a leader in its field and a unique 'selling' point of the laboratory. Cost benefit analysis (IACMST, 2004) shows that benefits really start to accrue after 10 years. In 2007 - 2012 exploitation of (i) the time series being acquired, (ii) the model-data synthesis and (iii) the increasingly available quantities of real-time data (e.g. river flows) can be carried out through Sustained Observation Activity (SO) 11, to provide an integrated assessment and short term forecasts of the coastal ocean state.
Overall Aims and Purpose of SO 11
- To continue and enlarge the scope of the existing coastal observatory in Liverpool Bay to routinely monitor the northern Irish Sea
- To develop the synthesis of measurements and models in the coastal ocean to optimize measurement arrays and forecast products. Driving forward shelf seas' operational oceanography with the direct objective of improving the national forecasting capability, expressed through links to the National Centre for Ocean Forecasting (NCOF)
- To exploit the long time-series of observations and model outputs to: a) identify the roles of climate and anthropogenic inputs on the coastal ocean's physical and biological functioning (including impacts of nutrient discharges, offshore renewable energy installations and fishing activity) taking into consideration the importance of events versus mean storms / waves, river discharge / variable salinity stratification / horizontal gradients; b) predict the impacts of climate change scenarios; and c) provide new insights to Irish Sea dynamics for variables either with seasonal cycles and interannual variability, or which show weak or no seasonal cycles
- To provide and maintain a 'laboratory' within which a variety of observational and model experiments can be undertaken (Oceans 2025 Themes 3, 6, 8, 9), including capture of extreme events
- Demonstrate the value of an integrated approach in assessment and forecasting
- Demonstrate the coastal observatory as a tool for marine management strategies through collaboration with the Environment Agency (EA), Department for Environment, Food and Rural Affairs (DEFRA), Joint Nature Conservation Commmittee (JNCC), English Nature (EN), Department of Agriculture and Rural Development (DARD), and Local Authorities, providing management information pertinent to policy (e.g. Water Framework Directive)
Measurement and Modelling Activities
- East Mooring Site: Bottom frame with full suite of physical measurements (high frequency Acoustic Doppler Current Profiler (ADCP), conductivity, temperature, turbidity and fluorescence), a Centre for Environment, Fisheries and Aquaculture Science (CEFAS) directional wavebuoy, and a CEFAS Smartbuoy collecting surface properties including salinity, temperature, turbidity, nutrients, irradiance and chlorophyll. All transmit data in real-time via Orbcomm. The Smartbuoy also collects daily water samples.
- West Mooring Site: Bottom frame with full suite of physical measurements (high frequency ADCP, conductivity, temperature, turbidity and fluorescence), CEFAS Smartbuoy.
- Spatial Survey: Four - six week intervals (determined by biofouling of optical sensors). Spatial surveys comprise of vertical profiles of CTD, suspended particulate material (SPM), some bed sediment sampling and surface and bed nutrients, phytoplankton, zooplankton.
- Ferry: The Birkenhead - Belfast ferry samples near surface (5 m depth) temperature, salinity, turbidity, chlorophyll, with data transmitted by Orbcomm. The route is scientifically varied passing through six completely different hydrodynamic regions, which significantly impact on their ecological function.
- Tide gauges: Real-time data are obtained from tide gauges operated by Mersey Docks and Harbour Company (MDHC) and the UK tide gauge network.
- Satellite imagery: Weekly composite satellite data, Advanced Very High Resolution Radiometer (AVHRR) sea surface temperature (SST) and ocean colour (chlorophyll and suspended sediment), are provided by the Remote Sensing Data Analysis Service (RSDAS) based at Plymouth Marine Laboratory (PML).
- HF radar: A phased array HF radar system (a 12-16MHz WERA HF radar) measuring surface currents and waves with maximum range 75km at a resolution of 4km for sea surface currents and for 2-D wave spectra.
- Meteorology station: With web camera, located on Hilbre Island at the mouth of the Dee Estuary
- Operational models: The Coastal Observatory uses Proudman Oceanographic Laboratory Coastal Ocean Modelling System (POLCOMS), which is part of Oceans 2025 Theme 9.
More detailed information on this Work Package is available at pages 32 - 35 of the official Oceans 2025 Theme 10 document: Oceans 2025 Theme 10
Weblink: http://www.oceans2025.org/
References:
IACMST., 2004. The Economics of Sustained Marine Measurements. IACMST Information Document, N0.11, Southampton: IACMST, 96 pp
Data Activity or Cruise Information
Data Activity
| Start Date (yyyy-mm-dd) | 2010-09-29 |
| End Date (yyyy-mm-dd) | 2010-11-23 |
| Organization Undertaking Activity | National Oceanography Centre, Liverpool |
| Country of Organization | United Kingdom |
| Originator's Data Activity Identifier | LB2_041 / POLRIG1110 |
| Platform Category | moored surface buoy |
COBs Site B SmartBuoy deployment LB2_041/1110
Deployment and recovery
This mooring was deployed in a collaboration between Cefas and the POL Liverpool Bay Coastal Observatory. The rig was deployed in September 2010 during RV Prince Madog cruise PD36/10. The rig was recovered in December 2010 during RV Prince Madog cruisePD49/10.
Rig Description
The SmartBuoy carried a suite of Cefas instruments mounted just below the surface, as well as instrumentation belonging to POL upto 15 m deep. Further information is given in the table below.
The single point mooring was composed mainly of 0.5 inch long link chain, marked by a 1.8 m diameter toroid and anchored by a half tonne clump of scrap chain.
The following instruments were connected to a Eco System Monitor;
| Instrument | Serial Number | Meter depth (m) | Record Length (days) | Owner |
|---|---|---|---|---|
| MiniTracka Chlorophyll Fluorometer | 175064 | 1 | 30 | Cefas |
| Falmouth Scientific OEM CT sensor | 1406 | 1 | 56 | Cefas |
| Druck 5 bar Pressure Transducer | 1759544 | 1 | 71 | Cefas |
| Seapoint Turbidity Meter | 1434 | 1 | 56 | Cefas |
The following instruments were stand alone sensors;
| Instrument | Serial Number | Meter depth (m) | Record Length (days) | Owner |
|---|---|---|---|---|
| Sea-Bird 37 MicroCAT | 5433 | 5 | 71 | NOC |
| Sea-Bird 37 MicroCAT | 4966 | 10 | 71 | NOC |
| Minilogger | 2849 | 15 | 71 | NOC |
| Minilogger | 2852 | 20 | 71 | NOC |
- Cefas - The Centre for Environment, Fisheries and Aquaculture Science, Lowestoft (UK)
- NOC - The National Oceanography Centre, Liverpool (UK) (formerly the Proudman Oceanographic Laboratory, Liverpool (UK))
Related Data Activity activities are detailed in Appendix 1
Cruise
| Cruise Name | PD36/10 |
| Departure Date | 2010-09-27 |
| Arrival Date | 2010-09-30 |
| Principal Scientist(s) | Phil J Knight (National Oceanography Centre, Liverpool) |
| Ship | RV Prince Madog |
Complete Cruise Metadata Report is available here
Fixed Station Information
Fixed Station Information
| Station Name | Coastal Observatory Site 20 |
| Category | Offshore area |
| Latitude | 53° 32.13' N |
| Longitude | 3° 38.39' W |
| Water depth below MSL | 32.5 m |
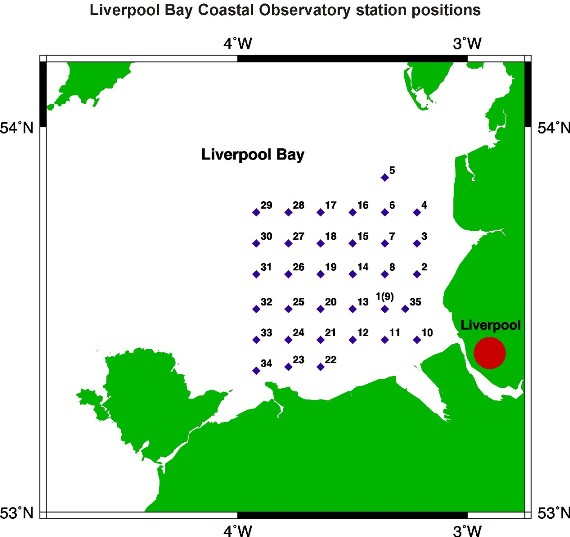
Liverpool Bay Coastal Observatory Site 20
This station is one of 34 stations regularly visited by the Proudman Oceanographic Laboratory (POL) as part of the Liverpool Bay Coastal Observatory. During each site visit CTD profiles are collected and since March 2010 (when this became the secondary mooring site for the Coastal Observatory (also known as Site B)) moorings are deployed. The station lies within a box of mean water depth 32.5 m with the following co-ordinates:
| Box Corner | Latitude | Longitude |
|---|---|---|
| North-west corner | 53.54052° | -3.65075° |
| South-east corner | 53.53041° | -3.62923° |
The position of this station relative to the other POL Coastal Observatory sites can be seen from the figure below.
CTD Sampling History
| Year | Number of Visits | Total Casts per year |
| 2011 | 5 | 11 |
| 2010 | 8 | 22 |
| 2009 | 6 | 6 |
| 2008 | 7 | 7 |
| 2007 | 7 | 7 |
| 2006 | 7 | 8 |
| 2005 | 7 | 7 |
| 2004 | 8 | 8 |
| 2003 | 9 | 9 |
| 2002 | 2 | 2 |
The CTD instrument package for these cruises was a Sea-Bird 911plus, with beam transmissometer, fluorometer, LICOR PAR sensor, LISST-25, and oxygen sensor.
Related Fixed Station activities are detailed in Appendix 2
BODC Quality Control Flags
The following single character qualifying flags may be associated with one or more individual parameters with a data cycle:
| Flag | Description |
|---|---|
| Blank | Unqualified |
| < | Below detection limit |
| > | In excess of quoted value |
| A | Taxonomic flag for affinis (aff.) |
| B | Beginning of CTD Down/Up Cast |
| C | Taxonomic flag for confer (cf.) |
| D | Thermometric depth |
| E | End of CTD Down/Up Cast |
| G | Non-taxonomic biological characteristic uncertainty |
| H | Extrapolated value |
| I | Taxonomic flag for single species (sp.) |
| K | Improbable value - unknown quality control source |
| L | Improbable value - originator's quality control |
| M | Improbable value - BODC quality control |
| N | Null value |
| O | Improbable value - user quality control |
| P | Trace/calm |
| Q | Indeterminate |
| R | Replacement value |
| S | Estimated value |
| T | Interpolated value |
| U | Uncalibrated |
| W | Control value |
| X | Excessive difference |
SeaDataNet Quality Control Flags
The following single character qualifying flags may be associated with one or more individual parameters with a data cycle:
| Flag | Description |
|---|---|
| 0 | no quality control |
| 1 | good value |
| 2 | probably good value |
| 3 | probably bad value |
| 4 | bad value |
| 5 | changed value |
| 6 | value below detection |
| 7 | value in excess |
| 8 | interpolated value |
| 9 | missing value |
| A | value phenomenon uncertain |
| B | nominal value |
| Q | value below limit of quantification |
Appendix 1: LB2_041 / POLRIG1110
Related series for this Data Activity are presented in the table below. Further information can be found by following the appropriate links.
If you are interested in these series, please be aware we offer a multiple file download service. Should your credentials be insufficient for automatic download, the service also offers a referral to our Enquiries Officer who may be able to negotiate access.
| Series Identifier | Data Category | Start date/time | Start position | Cruise |
|---|---|---|---|---|
| 1075743 | Fluorescence or pigments | 2010-09-29 08:30:00 | 53.5405 N, 3.6363 W | RV Prince Madog PD36/10 |
| 1641998 | Hydrography time series at depth | 2010-09-29 08:30:00 | 53.5405 N, 3.63633 W | RV Prince Madog PD36/10 |
| 1642001 | Hydrography time series at depth | 2010-09-29 08:30:00 | 53.5405 N, 3.63633 W | RV Prince Madog PD36/10 |
| 1076132 | Transmittance/attenuance, turbidity, or SPM conc. | 2010-09-29 08:30:00 | 53.5405 N, 3.6363 W | RV Prince Madog PD36/10 |
| 1641913 | Hydrography time series at depth | 2010-09-29 08:30:01 | 53.5405 N, 3.63633 W | RV Prince Madog PD36/10 |
| 1641937 | Hydrography time series at depth | 2010-09-29 08:30:01 | 53.5405 N, 3.63633 W | RV Prince Madog PD36/10 |
Appendix 2: Coastal Observatory Site 20
Related series for this Fixed Station are presented in the table below. Further information can be found by following the appropriate links.
If you are interested in these series, please be aware we offer a multiple file download service. Should your credentials be insufficient for automatic download, the service also offers a referral to our Enquiries Officer who may be able to negotiate access.
| Series Identifier | Data Category | Start date/time | Start position | Cruise |
|---|---|---|---|---|
| 1013118 | CTD or STD cast | 2006-11-02 06:18:00 | 53.53267 N, 3.64367 W | RV Prince Madog PD35/06 |
| 979271 | CTD or STD cast | 2007-02-15 17:26:00 | 53.53317 N, 3.63867 W | RV Prince Madog PD02/07 |
| 937772 | CTD or STD cast | 2007-04-20 02:36:00 | 53.53767 N, 3.64383 W | RV Prince Madog PD06/07 |
| 942239 | CTD or STD cast | 2007-05-17 06:12:00 | 53.53283 N, 3.63633 W | RV Prince Madog PD09/07 |
| 942995 | CTD or STD cast | 2007-06-21 06:23:00 | 53.5365 N, 3.64517 W | RV Prince Madog PD13/07 |
| 943396 | CTD or STD cast | 2007-07-27 06:37:00 | 53.53367 N, 3.62917 W | RV Prince Madog PD16/07 |
| 943808 | CTD or STD cast | 2007-08-30 05:46:00 | 53.53267 N, 3.6425 W | RV Prince Madog PD20/07 |
| 945759 | CTD or STD cast | 2007-10-04 06:47:00 | 53.5315 N, 3.63883 W | RV Prince Madog PD23/07 |
| 946818 | CTD or STD cast | 2008-01-11 02:24:00 | 53.53517 N, 3.6435 W | RV Prince Madog PD01/08 |
| 947084 | CTD or STD cast | 2008-03-14 05:52:00 | 53.533 N, 3.64533 W | RV Prince Madog PD07/08 |
| 947397 | CTD or STD cast | 2008-04-17 06:12:00 | 53.53583 N, 3.637 W | RV Prince Madog PD09/08 |
| 948235 | CTD or STD cast | 2008-05-15 13:00:00 | 53.53367 N, 3.64517 W | RV Prince Madog PD14/08 |
| 948585 | CTD or STD cast | 2008-06-25 20:03:00 | 53.53367 N, 3.641 W | RV Prince Madog PD19/08 |
| 949472 | CTD or STD cast | 2008-07-31 07:10:00 | 53.53367 N, 3.6365 W | RV Prince Madog PD23/08 |
| 950079 | CTD or STD cast | 2008-12-11 06:25:00 | 53.53117 N, 3.6365 W | RV Prince Madog PD37/08 |
| 950485 | CTD or STD cast | 2009-02-06 09:50:00 | 53.53367 N, 3.64533 W | RV Prince Madog PD02/09B |
| 951464 | CTD or STD cast | 2009-04-02 03:57:00 | 53.53183 N, 3.64217 W | RV Prince Madog PD12/09 |
| 953803 | CTD or STD cast | 2009-05-13 11:24:00 | 53.53433 N, 3.64083 W | RV Prince Madog PD18/09 |
| 1023149 | CTD or STD cast | 2009-06-17 21:35:00 | 53.53167 N, 3.64483 W | RV Prince Madog PD24/09 |
| 1023487 | CTD or STD cast | 2009-08-03 14:35:00 | 53.53283 N, 3.6415 W | RV Prince Madog PD33/09 |
| 1024349 | CTD or STD cast | 2009-09-16 04:31:00 | 53.53383 N, 3.643 W | RV Prince Madog PD38/09 |
| 1641347 | Hydrography time series at depth | 2010-01-26 11:40:03 | 53.53783 N, 3.64033 W | RV Prince Madog PD02/10 |
| 1624135 | Currents -subsurface Eulerian | 2010-01-26 11:45:00 | 53.53783 N, 3.64033 W | RV Prince Madog PD02/10 |
| 1030380 | CTD or STD cast | 2010-01-26 13:08:00 | 53.539 N, 3.64017 W | RV Prince Madog PD02/10 |
| 1641384 | Hydrography time series at depth | 2010-01-26 13:10:00 | 53.53833 N, 3.64033 W | RV Prince Madog PD02/10 |
| 1641396 | Hydrography time series at depth | 2010-01-26 13:10:00 | 53.53833 N, 3.64033 W | RV Prince Madog PD02/10 |
| 1641323 | Hydrography time series at depth | 2010-01-26 13:10:01 | 53.53833 N, 3.64033 W | RV Prince Madog PD02/10 |
| 1641335 | Hydrography time series at depth | 2010-01-26 13:10:02 | 53.53833 N, 3.64033 W | RV Prince Madog PD02/10 |
| 1075687 | Fluorescence or pigments | 2010-01-26 14:00:00 | 53.5383 N, 3.6403 W | RV Prince Madog PD02/10 |
| 1075558 | Hydrography time series at depth | 2010-01-26 14:00:00 | 53.5383 N, 3.6403 W | RV Prince Madog PD02/10 |
| 1076629 | Transmittance/attenuance, turbidity, or SPM conc. | 2010-01-26 14:00:00 | 53.5383 N, 3.6403 W | RV Prince Madog PD02/10 |
| 1030564 | CTD or STD cast | 2010-01-27 06:05:00 | 53.54083 N, 3.63667 W | RV Prince Madog PD02/10 |
| 1038333 | CTD or STD cast | 2010-03-17 15:37:00 | 53.5395 N, 3.64383 W | RV Prince Madog PD05/10 |
| 1641440 | Hydrography time series at depth | 2010-03-17 16:40:03 | 53.53783 N, 3.64217 W | RV Prince Madog PD05/10 |
| 1624080 | Currents -subsurface Eulerian | 2010-03-17 16:45:00 | 53.53783 N, 3.64217 W | RV Prince Madog PD05/10 |
| 1641488 | Hydrography time series at depth | 2010-03-17 16:50:00 | 53.539 N, 3.64017 W | RV Prince Madog PD05/10 |
| 1641507 | Hydrography time series at depth | 2010-03-17 16:50:00 | 53.539 N, 3.64017 W | RV Prince Madog PD05/10 |
| 1641415 | Hydrography time series at depth | 2010-03-17 16:50:01 | 53.539 N, 3.64017 W | RV Prince Madog PD05/10 |
| 1641439 | Hydrography time series at depth | 2010-03-17 16:50:01 | 53.539 N, 3.64017 W | RV Prince Madog PD05/10 |
| 1075699 | Fluorescence or pigments | 2010-03-17 17:00:00 | 53.539 N, 3.6402 W | RV Prince Madog PD05/10 |
| 1075571 | Hydrography time series at depth | 2010-03-17 17:00:00 | 53.539 N, 3.6402 W | RV Prince Madog PD05/10 |
| 1076120 | Transmittance/attenuance, turbidity, or SPM conc. | 2010-03-17 17:00:00 | 53.539 N, 3.6402 W | RV Prince Madog PD05/10 |
| 1038345 | CTD or STD cast | 2010-03-17 17:03:00 | 53.54 N, 3.6435 W | RV Prince Madog PD05/10 |
| 1641556 | Hydrography time series at depth | 2010-04-28 17:40:03 | 53.5395 N, 3.64017 W | RV Prince Madog PD10/10 |
| 1624031 | Currents -subsurface Eulerian | 2010-04-28 17:45:00 | 53.5395 N, 3.64017 W | RV Prince Madog PD10/10 |
| 1075706 | Fluorescence or pigments | 2010-04-28 18:00:00 | 53.5408 N, 3.6392 W | RV Prince Madog PD10/10 |
| 1075583 | Hydrography time series at depth | 2010-04-28 18:00:00 | 53.5408 N, 3.6392 W | RV Prince Madog PD10/10 |
| 1641600 | Hydrography time series at depth | 2010-04-28 18:00:00 | 53.54083 N, 3.63917 W | RV Prince Madog PD10/10 |
| 1641612 | Hydrography time series at depth | 2010-04-28 18:00:00 | 53.54083 N, 3.63917 W | RV Prince Madog PD10/10 |
| 1076630 | Transmittance/attenuance, turbidity, or SPM conc. | 2010-04-28 18:00:00 | 53.5408 N, 3.6392 W | RV Prince Madog PD10/10 |
| 1641519 | Hydrography time series at depth | 2010-04-28 18:00:01 | 53.54083 N, 3.63917 W | RV Prince Madog PD10/10 |
| 1641532 | Hydrography time series at depth | 2010-04-28 18:00:01 | 53.54083 N, 3.63917 W | RV Prince Madog PD10/10 |
| 1090696 | CTD or STD cast | 2010-06-10 16:48:00 | 53.53833 N, 3.638 W | RV Prince Madog PD17/10 |
| 1641685 | Hydrography time series at depth | 2010-06-10 18:00:03 | 53.53917 N, 3.641 W | RV Prince Madog PD17/10 |
| 1624079 | Currents -subsurface Eulerian | 2010-06-10 18:05:00 | 53.53917 N, 3.641 W | RV Prince Madog PD17/10 |
| 1075718 | Fluorescence or pigments | 2010-06-10 18:30:00 | 53.5405 N, 3.6386 W | RV Prince Madog PD17/10 |
| 1075595 | Hydrography time series at depth | 2010-06-10 18:30:00 | 53.5405 N, 3.6386 W | RV Prince Madog PD17/10 |
| 1090703 | CTD or STD cast | 2010-06-10 19:05:00 | 53.54333 N, 3.63433 W | RV Prince Madog PD17/10 |
| 1090893 | CTD or STD cast | 2010-07-07 21:40:00 | 53.543 N, 3.63967 W | RV Prince Madog PD21/10 |
| 1090997 | CTD or STD cast | 2010-07-08 06:04:00 | 53.53617 N, 3.635 W | RV Prince Madog PD21/10 |
| 1641790 | Hydrography time series at depth | 2010-07-08 07:40:03 | 53.5395 N, 3.64083 W | RV Prince Madog PD21/10 |
| 1624043 | Currents -subsurface Eulerian | 2010-07-08 07:45:00 | 53.5395 N, 3.64083 W | RV Prince Madog PD21/10 |
| 1075731 | Fluorescence or pigments | 2010-07-08 08:00:00 | 53.5378 N, 3.6367 W | RV Prince Madog PD21/10 |
| 1075602 | Hydrography time series at depth | 2010-07-08 08:00:00 | 53.5378 N, 3.6367 W | RV Prince Madog PD21/10 |
| 1641833 | Hydrography time series at depth | 2010-07-08 08:10:00 | 53.53783 N, 3.63667 W | RV Prince Madog PD21/10 |
| 1641845 | Hydrography time series at depth | 2010-07-08 08:10:00 | 53.53783 N, 3.63667 W | RV Prince Madog PD21/10 |
| 1641741 | Hydrography time series at depth | 2010-07-08 08:10:01 | 53.53783 N, 3.63667 W | RV Prince Madog PD21/10 |
| 1641777 | Hydrography time series at depth | 2010-07-08 08:10:01 | 53.53783 N, 3.63667 W | RV Prince Madog PD21/10 |
| 1091000 | CTD or STD cast | 2010-07-08 08:25:00 | 53.54233 N, 3.63367 W | RV Prince Madog PD21/10 |
| 1112294 | CTD or STD cast | 2010-08-12 06:06:00 | 53.53467 N, 3.64383 W | RV Prince Madog PD29/10 |
| 1112405 | CTD or STD cast | 2010-08-12 18:07:00 | 53.539 N, 3.643 W | RV Prince Madog PD29/10 |
| 1641870 | Hydrography time series at depth | 2010-08-12 19:10:03 | 53.5395 N, 3.64117 W | RV Prince Madog PD29/10 |
| 1112417 | CTD or STD cast | 2010-08-12 19:11:00 | 53.53667 N, 3.6385 W | RV Prince Madog PD29/10 |
| 1623967 | Currents -subsurface Eulerian | 2010-08-12 19:15:00 | 53.5395 N, 3.64117 W | RV Prince Madog PD29/10 |
| 1114160 | CTD or STD cast | 2010-09-29 04:05:00 | 53.5315 N, 3.64317 W | RV Prince Madog PD36/10 |
| 1114196 | CTD or STD cast | 2010-09-29 07:03:00 | 53.541 N, 3.64433 W | RV Prince Madog PD36/10 |
| 1641962 | Hydrography time series at depth | 2010-09-29 07:50:03 | 53.54017 N, 3.64167 W | RV Prince Madog PD36/10 |
| 1623851 | Currents -subsurface Eulerian | 2010-09-29 07:55:00 | 53.54017 N, 3.64167 W | RV Prince Madog PD36/10 |
| 1075743 | Fluorescence or pigments | 2010-09-29 08:30:00 | 53.5405 N, 3.6363 W | RV Prince Madog PD36/10 |
| 1641998 | Hydrography time series at depth | 2010-09-29 08:30:00 | 53.5405 N, 3.63633 W | RV Prince Madog PD36/10 |
| 1642001 | Hydrography time series at depth | 2010-09-29 08:30:00 | 53.5405 N, 3.63633 W | RV Prince Madog PD36/10 |
| 1076132 | Transmittance/attenuance, turbidity, or SPM conc. | 2010-09-29 08:30:00 | 53.5405 N, 3.6363 W | RV Prince Madog PD36/10 |
| 1641913 | Hydrography time series at depth | 2010-09-29 08:30:01 | 53.5405 N, 3.63633 W | RV Prince Madog PD36/10 |
| 1641937 | Hydrography time series at depth | 2010-09-29 08:30:01 | 53.5405 N, 3.63633 W | RV Prince Madog PD36/10 |
| 1114203 | CTD or STD cast | 2010-09-29 08:51:00 | 53.54033 N, 3.63717 W | RV Prince Madog PD36/10 |
| 1642062 | Hydrography time series at depth | 2010-12-07 15:20:03 | 53.5405 N, 3.64283 W | RV Prince Madog PD49/10 |
| 1623666 | Currents -subsurface Eulerian | 2010-12-07 15:25:00 | 53.5405 N, 3.64283 W | RV Prince Madog PD49/10 |
| 1642098 | Hydrography time series at depth | 2010-12-07 16:10:00 | 53.537 N, 3.638 W | RV Prince Madog PD49/10 |
| 1642105 | Hydrography time series at depth | 2010-12-07 16:10:00 | 53.537 N, 3.638 W | RV Prince Madog PD49/10 |
| 1642117 | Hydrography time series at depth | 2010-12-07 16:10:00 | 53.537 N, 3.638 W | RV Prince Madog PD49/10 |
| 1642013 | Hydrography time series at depth | 2010-12-07 16:10:01 | 53.537 N, 3.638 W | RV Prince Madog PD49/10 |
| 1642025 | Hydrography time series at depth | 2010-12-07 16:10:01 | 53.537 N, 3.638 W | RV Prince Madog PD49/10 |
| 1075755 | Fluorescence or pigments | 2010-12-07 16:30:00 | 53.5405 N, 3.6428 W | RV Prince Madog PD49/10 |
| 1075626 | Hydrography time series at depth | 2010-12-07 16:30:00 | 53.5405 N, 3.6428 W | RV Prince Madog PD49/10 |
| 1140953 | CTD or STD cast | 2010-12-07 16:46:00 | 53.53667 N, 3.646 W | RV Prince Madog PD49/10 |
| 1141016 | CTD or STD cast | 2010-12-07 21:10:00 | 53.534 N, 3.63433 W | RV Prince Madog PD49/10 |
| 1149067 | CTD or STD cast | 2011-01-13 08:03:00 | 53.54033 N, 3.64283 W | RV Prince Madog PD01/11 |
| 1149079 | CTD or STD cast | 2011-01-13 09:10:00 | 53.543 N, 3.6415 W | RV Prince Madog PD01/11 |
| 1642178 | Hydrography time series at depth | 2011-01-13 09:10:03 | 53.54033 N, 3.64383 W | RV Prince Madog PD01/11 |
| 1623771 | Currents -subsurface Eulerian | 2011-01-13 09:14:59 | 53.54033 N, 3.64383 W | RV Prince Madog PD01/11 |
| 1642209 | Hydrography time series at depth | 2011-01-13 15:10:00 | 53.54017 N, 3.63983 W | RV Prince Madog PD01/11 |
| 1642210 | Hydrography time series at depth | 2011-01-13 15:10:00 | 53.54017 N, 3.63983 W | RV Prince Madog PD01/11 |
| 1642222 | Hydrography time series at depth | 2011-01-13 15:10:00 | 53.54017 N, 3.63983 W | RV Prince Madog PD01/11 |
| 1642130 | Hydrography time series at depth | 2011-01-13 15:10:01 | 53.54017 N, 3.63983 W | RV Prince Madog PD01/11 |
| 1642142 | Hydrography time series at depth | 2011-01-13 15:10:01 | 53.54017 N, 3.63983 W | RV Prince Madog PD01/11 |
| 1149159 | CTD or STD cast | 2011-01-13 15:32:00 | 53.53833 N, 3.637 W | RV Prince Madog PD01/11 |
| 1149946 | CTD or STD cast | 2011-03-17 08:59:00 | 53.53833 N, 3.63967 W | RV Prince Madog PD07/11 |
| 1150112 | CTD or STD cast | 2011-03-18 10:34:00 | 53.542 N, 3.64017 W | RV Prince Madog PD07/11 |
| 1642295 | Hydrography time series at depth | 2011-03-18 11:20:03 | 53.53983 N, 3.64233 W | RV Prince Madog PD07/11 |
| 1624111 | Currents -subsurface Eulerian | 2011-03-18 11:25:00 | 53.53983 N, 3.64233 W | RV Prince Madog PD07/11 |
| 1642326 | Hydrography time series at depth | 2011-03-18 11:40:00 | 53.5385 N, 3.64017 W | RV Prince Madog PD07/11 |
| 1642338 | Hydrography time series at depth | 2011-03-18 11:40:00 | 53.5385 N, 3.64017 W | RV Prince Madog PD07/11 |
| 1642351 | Hydrography time series at depth | 2011-03-18 11:40:00 | 53.5385 N, 3.64017 W | RV Prince Madog PD07/11 |
| 1642246 | Hydrography time series at depth | 2011-03-18 11:40:01 | 53.5385 N, 3.64017 W | RV Prince Madog PD07/11 |
| 1642271 | Hydrography time series at depth | 2011-03-18 11:40:01 | 53.5385 N, 3.64017 W | RV Prince Madog PD07/11 |
| 1150124 | CTD or STD cast | 2011-03-18 11:55:00 | 53.54067 N, 3.64167 W | RV Prince Madog PD07/11 |
| 1117735 | CTD or STD cast | 2011-04-20 11:12:00 | 53.5395 N, 3.63167 W | RV Prince Madog PD11/11 |
| 1117747 | CTD or STD cast | 2011-04-20 12:05:00 | 53.53883 N, 3.63783 W | RV Prince Madog PD11/11 |
| 1118683 | CTD or STD cast | 2011-06-07 00:35:00 | 53.53917 N, 3.63383 W | RV Prince Madog PD43/11 |
