Metadata Report for BODC Series Reference Number 249102
Metadata Summary
Problem Reports
Data Access Policy
Narrative Documents
Project Information
Data Activity or Cruise Information
Fixed Station Information
BODC Quality Flags
SeaDataNet Quality Flags
Metadata Summary
Data Description |
|||||||||||||||||||||||||||||
|
|||||||||||||||||||||||||||||
Data Identifiers |
|||||||||||||||||||||||||||||
|
|||||||||||||||||||||||||||||
Time Co-ordinates(UT) |
|||||||||||||||||||||||||||||
|
|||||||||||||||||||||||||||||
Spatial Co-ordinates | |||||||||||||||||||||||||||||
|
|||||||||||||||||||||||||||||
Parameters |
|||||||||||||||||||||||||||||
|
|||||||||||||||||||||||||||||
|
|||||||||||||||||||||||||||||
Problem Reports
No Problem Report Found in the Database
Data Access Policy
Open Data
These data have no specific confidentiality restrictions for users. However, users must acknowledge data sources as it is not ethical to publish data without proper attribution. Any publication or other output resulting from usage of the data should include an acknowledgment.
If the Information Provider does not provide a specific attribution statement, or if you are using Information from several Information Providers and multiple attributions are not practical in your product or application, you may consider using the following:
"Contains public sector information licensed under the Open Government Licence v1.0."
Narrative Documents
Aanderaa Recording Current Meter Model 4/5
Manufacturer's specifications: Meter (recording unit: height 51cm, diameter 12.8cm, vane size 37x100cm; overall: length 137cm, height 75cm) is designed for depths down to 2000m (6000m RCM model 5). It incorporates a spindle which is shackled into the mooring line. The meter is attached to the spindle through a gimbal mounting which permits a maximum 27° deviation of the spindle from the vertical, the meter still remaining horizontal.
Meter comprises :-
-
Savonius rotor magnetically coupled to an electronic counter - the number of revolutions during the sampling interval giving the average current speed over the interval - starting speed 2cm/s (users find 1.5 to 3cm/s), range 2.5 to 250cm/s, accuracy greater of 1cm/s or 2 per cent.
-
Vane, which aligns instrument with current flow, has a balance weight ensuring static balance and tail fins to ensure dynamic balance in flows up to 250cm/s.
-
Magnetic compass (needle is clamped to potentiometer ring at instant of sampling only) - direction recorded with 0.35° resolution, 5° accuracy (1.5° claimed by MAFF, Lowestoft) for speeds 5 to 100cm/s, 7.5° accuracy for remaining speeds within 2.5 to 200cm/s range, maximum compass tilt (i.e. maximum deviation of the meter from the horizontal at which the meter still registers correctly) is 12° in both pitch and roll axes.
-
Quartz clock, accuracy better than 2sec/day within temperature range 0 to 20°C.
-
Thermistor (temperature sensor), standard range -2.46 to 21.48°C (max on high range 36.04°C), accuracy 0.15°C, resolution 0.1 per cent of range, 63 per cent response time 12sec.
-
Inductive cell conductivity sensor (optional), range 0 to 70mmho/cm standard resolution 0.1 per cent of range.
-
Bourdon tube pressure sensor (optional) driving a potentiometer - range 0 to 100, 200, 500, 1000 or (RCM4 to 3000psi), (RCM5 to 5000, or 8000psi), lowest calibrated pressure 14.24psi, accuracy 1 per cent of range, resolution 0.1 per cent of range.
-
Self balancing potentiometer which converts the output from each sensor into a 10 bit binary number for storage on magnetic tape.
-
Associated electronics.
Sample duration equals nominal interval between data cycles pre-chosen as 0.5, 1, 2, 5, 10, 15, 20, 30, 60 or 180 minutes. Sample recording order: meter reference number, temperature, (conductivity, pressure if installed), current direction, speed.
Manufacturer's calibration formulae:
Meters (manufactured prior to October 1974) with analogue measurement of speed, i.e. the Savonius rotor drives a potentiometer via a magnetically coupled follower and gearbox (6000 : 1 gear ratio):
speed = 1.5 + 246 * (M/T) cm/s (1)
meters with digital measurement of speed i.e. utilizing an electronic reed switch to count the total number of rotor revolutions during the sampling interval:
speed = 1.5 + 42 * B * (M/T) cm/s (2)
all meters:
direction = 1.5 + 0.349N ° magnetic (3)
where
B is the number of rotor revolutions per count, M (bits) binary is the count over the sampling interval T (sec) and N (bits) binary is the direction reading.
Note:
Data collecting laboratories may calibrate their own meters and so not use the manufacturer's calibration equations.
BODC Current Meter Screening
BODC screen both the series header qualifying information and the parameter values in the data cycles themselves.
Header information is inspected for:
- Irregularities such as unfeasible values
- Inconsistencies between related information. For example:
- Depths of meter and sea bed.
- Times for mooring deployment and for start/end of data series.
- Length of record or number of data cycles, the cycle interval, the clock error and the period over which accrued.
- Parameters stated as measured and the parameters actually present in the data cycles.
- Originator's comments on meter/mooring performance and data quality.
Documents are written by BODC highlighting irregularities which cannot be resolved.
Data cycles are inspected using time series plots of all parameters. Currents are additionally inspected using vector scatter plots and time series plots of North and East velocity components. These presentations undergo intrinsic and extrinsic screening to detect infeasible values within the data cycles themselves and inconsistencies as seen when comparing characteristics of adjacent data sets displaced with respect to depth, position or time. Values suspected of being of non- oceanographic origin may be tagged with the BODC flag denoting suspect value.
The following types of irregularity, each relying on visual detection in the time series plot, are amongst those which may be flagged as suspect:
- Spurious data at the start or end of the record.
- Obvious spikes occurring in periods free from meteorological disturbance.
- A sequence of constant values in consecutive data cycles.
If a large percentage of the data is affected by irregularities, deemed abnormal, then instead of flagging the individual suspect values, a caution may be documented. Likewise documents will highlight irregularities seen in the current vector scatter plots such as incongruous centre holes, evidence of mooring 'knock-down', abnormal asymmetry in tidally dominated records or gaps as when a range of speeds or directions go unregistered due to meter malfunction.
The term 'knock-down' refers to the situation when the 'drag' exerted on a mooring at high current speeds may cause instruments to tilt beyond the angle at which they are intended to operate. At this point the efficiency of the current sensors to accurately record the flow is reduced.
Inconsistencies between the characteristics of the data set and those of its neighbours are sought, and where necessary, documented. This covers inconsistencies in the following:
- Maximum and minimum values of parameters (spikes excluded).
- The orientation and symmetry of the current vector scatter plot.
- The direction of rotation of the current vectors.
- The approximate amplitude and periodicity of the tidal currents.
- The occurrence of meteorological events and, finally, for series for which no time check was possible, the phase.
This intrinsic and extrinsic screening of the parameter values seeks to confirm the qualifying information and the source laboratory's comments on the series. In screening and collating information, every care is taken to ensure that errors of BODC making are not introduced.
DML (formerly SMBA) CMD Calibration, Processing and Validation
Calibrations
The speed and pressure calibrations used are those supplied by the manufacturer, whereas for direction and, in some cases, temperature, meters are calibrated against the manufacturer's formulae. Direction calibrations are performed, before and after use, on a rotating table in an area free from magnetic interference. Two sets of readings are made at 30° intervals - accurate to ±1° - obtained with the meter moving alternately clockwise and anticlockwise. Extra readings are taken in the dead space. A calibration curve is fitted through the mean values of the readings at each interval. A table of corrections to the manufacturer's formula for each meter reading is obtained. Plessey thermistors are calibrated separately in a stirred waterbath with the thermistor in place in the instrument; for Aanderaa thermistors the manufacturer's formulae are often used.
Direction
SMBA calibration formulae for direction:
Plessey 9021 Meter
direction = 360 * N/1020 ° magnetic
Plessey M021 and Aanderaa RCM4 and RCM5 Meters
direction = 5.0 + 0.346N + C ° magnetic
where N(bits) binary is the direction reading and C is the calibration correction in degrees.
As stated above SMBA use the manufacturer's calibration formula for speed. For these formulae see BODC documentation on instrumentation, but note that if the count M(bits) binary over the sampling interval T(sec) equals zero, speeds are set to zero and the manufacturer's calibration equations are bypassed.
Data Processing and Validation
Data recorded on magnetic tape are translated into computer compatible format on paper tape. Calibrations are applied to temperature and, where measured, pressure data. Rotor revolutions or impeller rotations for the sampling interval are converted to speed using the manufacturer's calibration formula and a time and date is calculated for each data cycle, the nominal sample interval being assumed initially. Major data errors caused for example by instrument malfunction or tape translation faults are detected and replaced by interpolated data. Generally interpolated data will not exceed a maximum of one hour of consecutive readings. Data recorded during deployment and recovery are discarded. Corrections are made for the velocity potentiometer gap and records of direction are calibrated and corrected for magnetic variation which is obtained from Admiralty Charts covering the year and area of the data collection. The timing discrepancy is calculated. This is the difference between the actual elapsed time for which the meter was switched on and the apparent time deduced from the number of samples recorded and the nominal sample interval to which the meter was set. The apparent time is adjusted for the timing discrepancy and the actual sample interval is calculated based on the assumption that the rate of sampling was constant throughout the record. When a meter stops before recovery no timing discrepancy checks are possible and the nominal sample intervals cannot be corrected or confirmed. Time values of each data cycle are finally calculated based on the actual sample interval and the timing discrepancy accrued over the duration of the data series or deployment is quoted by BODC. The time assigned to the parameters is the end of the period over which the speed count was taken. The first record of a series contains integrated speed in cm/sec over the sampling interval SI terminating at time ST (where ST is the start time, i.e. the time of the first cycle in the data series) and direction in degrees true, measured at ST. The n th record contains the direction recorded at time ST + (n-1)SI and the average speed measured from ST + (n-2)SI to ST + (n-1)SI, i.e. over the interval terminating at ST + (n-1)SI. The time for the n th record is given as ST + (n-1)SI. When temperature (deg C), or pressure (mb) are measured, the time for these records is the same as for the speed and direction measurement. Note: Pressure measurements are supplied to BODC in (non-absolute) units of 0.1Kg/cm**2 and are converted to millibars using a multiplicative factor of 98.1.
After editing the data, north and east components of velocity are used to calculate hourly mean values which are then filtered to remove tidal frequencies using the Doodson 39-term filter. A daily mean is calculated from this filtered data. Further work carried out on the data includes: other filtering e.g. HILOW, tidal analysis, spectral analysis and comparison with meteorological data. The following data presentations are inspected:
- Plots of current speed and direction, north and east components of velocity and, where measured, temperature and pressure, against time.
- Progressive vector plots of the hourly mean values and of the (39 term) filtered hourly means.
- A vector stick plot of residual currents.
Data free from outstanding irregularities are now classed as good data by SMBA.
Note 1: The data processing details described apply regardless of the type of meter used.
Note 2: For current meter data processed by SMBA, the format of the originator's reference when quoted by BODC will be: meter serial number / SMBA mooring number.
Summary of DML (formerly SMBA) Standard Procedures for Current Meter Data
Calibration
Each meter is calibrated against the manufacturer's formulae for direction and Plessey meters are calibrated for temperature; Aanderaa meters use the manufacturer's temperature calibrations. The manufacturer's velocity and pressure calibrations are used.
Mooring System for Water Depths up to 200m
U shaped mooring i.e. pellet float to pellet line to sub-surface buoy to meter mooring line (with either in-line or A-frame mounting of meters) to anchor weight to ground line to anchor weight to marker buoy tow chain, then line to surface spar marker buoy and to pellet line and floats. The mooring is deployed in the order given and recovered in reverse order. Usually lengths of main wires are: buoy tow line D-15m, buoy tow chain 55m, sometimes buoy line is all chain, (prior to 1977 buoy tow line 2D used without chain), ground wire 2D (but never less than 150m), meter rope (excluding sub-surface buoy bridles and anchor bridles) D-X-3m where D is the depth of water and X is the depth of the sub-surface buoy. Generally X=30m but this may vary depending on the application of the mooring and the requirement for near surface current measurements. The mooring site is chosen by echo sounding to accord with the preset length of instrument line; however occasionally the length of the instrument line is adjusted on station. The site is positioned to an accuracy of 0.5nm using either Decca main chain, Loran or Satellite Navigation (GPS), depending on reception etc.
Data Sampling/Processing
Speed is integrated over the sampling interval. Direction and, where measured, temperature and pressure, are taken as spot measurements at the end of the sampling interval. Direction is corrected for magnetic variation. Pressure measurements are not corrected for atmospheric pressure.
Parameter values i.e. speed, direction, temperature and pressure are given at times incremented by the sample interval. The time assigned to each parameter is that of the end of the sampling interval. Time values are corrected for clock error should this occur.
Sea floor depths are relative to the instantaneous sea surface i.e. obtained from corrected echo soundings at the time of rig deployment (Matthew's corrections are applied).
Project Information
No Project Information held for the Series
Data Activity or Cruise Information
Data Activity
| Start Date (yyyy-mm-dd) | 1987-05-01 |
| End Date (yyyy-mm-dd) | 1987-09-01 |
| Organization Undertaking Activity | Scottish Marine Biological Association (now Scottish Association for Marine Science) |
| Country of Organization | United Kingdom |
| Originator's Data Activity Identifier | Tiree#210 |
| Platform Category | subsurface mooring |
Dunstaffnage Marine Laboratory Moored Instrument Rig#210
This rig was deployed in the Tiree Passage at site Y. The deployment forms part of the moored current meter series in the Tiree Passage, from 1981 to present.
| Rig Position | 56° 37.098' N, 06° 25.002' W |
|---|---|
| Deployed | 1 May 1987 13:00 from cruise CH14 |
| Recovered | 1 Sep 1987 06:27 from cruise FR18/87 |
The instruments formed a U-shaped mooring anchored by two 450 kg weights, connected by a 100 metre ground wire. A spar marker buoy was attached to one of the weights, with a recovery line. The instruments, attached to the second weight, were held erect by a sub-surface buoy.
Instruments deployed on the rig
| Height above Sea Bed | Instrument |
|---|---|
| 12 m | Aanderaa current meter (#07148) |
The mooring was also fitted with a temperature sensor.
Cruise
| Cruise Name | CH14 |
| Departure Date | 1987-04-24 |
| Arrival Date | 1987-05-07 |
| Principal Scientist(s) | David J Ellett (Scottish Marine Biological Association) |
| Ship | RRS Challenger |
Complete Cruise Metadata Report is available here
Fixed Station Information
Fixed Station Information
| Station Name | DML Tiree Passage Mooring |
| Category | Offshore location |
| Latitude | 56° 37.20' N |
| Longitude | 6° 24.00' W |
| Water depth below MSL | 50.0 m |
Tiree Passage Mooring
The Tiree Passage Mooring (also referred to as Y Mooring) is a current meter mooring at 56° 37.2' N, 6° 24.0' W. It has been maintained by the Dunstaffnage Marine Laboratory (DML)/ Scottish Association for Marine Science (SAMS) since 1981. The mooring is serviced approximately 3 times a year. The Tiree Passage Mooring is the longest moored time series of flow and temperature on the NW European continental shelf.
Between 21/05/1993 and 17/09/1997 the mooring included two Aanderaa current meters located 11 m and 22 m above the sea floor except for the period between 09/05/1994 and 15/08/1994 when there was no top current meter. The proportion of good data returned was exceptionally high.
Gaps in the time series are caused by fluctuations in funding, mooring losses and instrument failures (additional gaps in the current time series, usually due to fouling of mechanical current meters).
Although conductivity sensors were fitted to the Aanderaa current meters from 1994 to 1997, the reliability of these sensors over long periods is questionable, and more work needs to be done in cross calibrating the calculated salinity against the salinity of coincident 'Ellett Line/Extended Ellett Line' CTD casts.
It should be noted that some data were submitted to BODC from PML and not DML. This was due the relocation of the Principal Investigator responsible for the data. He subsequently returned to DML.
Summary of Key Activities
| Date | Activity |
|---|---|
| 1981 | Tiree mooring is first deployed |
| June 1981 | Hourly current and temperature measurements using Aanderaa recording current meters (RCMs) recorded at the bottom of the mooring (11 m above the bed) |
| November 1987 | Addition of Aanderaa recording current meters (RCMs) at 22 m above the bed |
| September 1993 | Hourly salinity measurements started to be taken at both depths using Aanderaa conductivity sensors |
| September 1997 | Collection of data at both depths stops |
| Between June 1999 and February 2000 | The mooring was re-deployed |
| May 2002 until the present | Mooring is fitted with RCMs at both 20 m and 45 m above the bed. |
| August 2002 | A Seabird MicroCAT salinity sensor was added at 20 m above bed. |
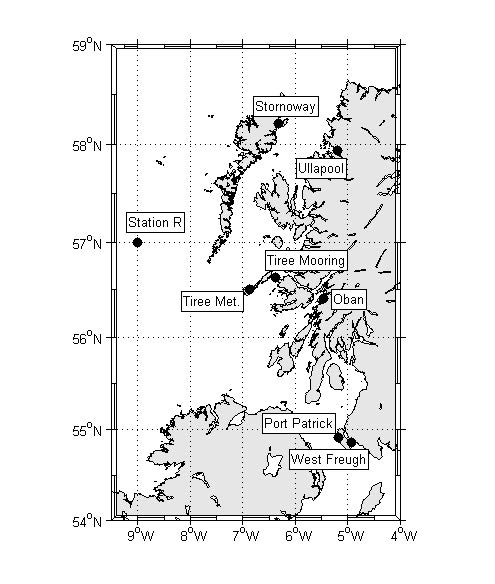
Figure 1: Map showing the locations of the Tiree mooring data time series.
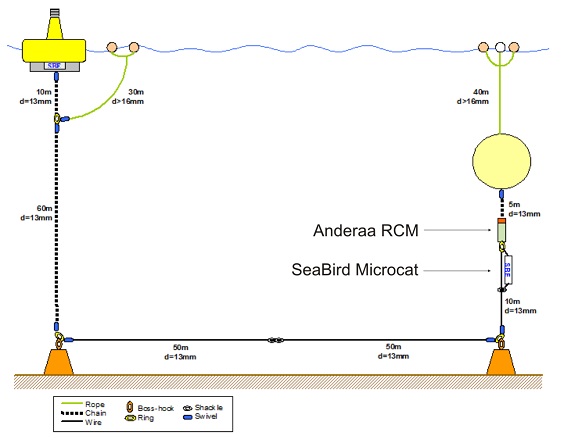
Figure 2: The typcial set up of the Tiree mooring.
References
Inall, M. and Griffiths, C., 2003 The Tiree Passage Time Series: 1981-2003 DEFRA MECN: Tiree Passage
Related Fixed Station activities are detailed in Appendix 1
BODC Quality Control Flags
The following single character qualifying flags may be associated with one or more individual parameters with a data cycle:
| Flag | Description |
|---|---|
| Blank | Unqualified |
| < | Below detection limit |
| > | In excess of quoted value |
| A | Taxonomic flag for affinis (aff.) |
| B | Beginning of CTD Down/Up Cast |
| C | Taxonomic flag for confer (cf.) |
| D | Thermometric depth |
| E | End of CTD Down/Up Cast |
| G | Non-taxonomic biological characteristic uncertainty |
| H | Extrapolated value |
| I | Taxonomic flag for single species (sp.) |
| K | Improbable value - unknown quality control source |
| L | Improbable value - originator's quality control |
| M | Improbable value - BODC quality control |
| N | Null value |
| O | Improbable value - user quality control |
| P | Trace/calm |
| Q | Indeterminate |
| R | Replacement value |
| S | Estimated value |
| T | Interpolated value |
| U | Uncalibrated |
| W | Control value |
| X | Excessive difference |
SeaDataNet Quality Control Flags
The following single character qualifying flags may be associated with one or more individual parameters with a data cycle:
| Flag | Description |
|---|---|
| 0 | no quality control |
| 1 | good value |
| 2 | probably good value |
| 3 | probably bad value |
| 4 | bad value |
| 5 | changed value |
| 6 | value below detection |
| 7 | value in excess |
| 8 | interpolated value |
| 9 | missing value |
| A | value phenomenon uncertain |
| B | nominal value |
| Q | value below limit of quantification |
Appendix 1: DML Tiree Passage Mooring
Related series for this Fixed Station are presented in the table below. Further information can be found by following the appropriate links.
If you are interested in these series, please be aware we offer a multiple file download service. Should your credentials be insufficient for automatic download, the service also offers a referral to our Enquiries Officer who may be able to negotiate access.
| Series Identifier | Data Category | Start date/time | Start position | Cruise |
|---|---|---|---|---|
| 46857 | Currents -subsurface Eulerian | 1983-02-19 11:15:00 | 56.6179 N, 6.3983 W | Not applicable |
| 46869 | Currents -subsurface Eulerian | 1983-05-30 04:15:00 | 56.6266 N, 6.3964 W | Not applicable |
| 60666 | Currents -subsurface Eulerian | 1984-06-26 17:15:00 | 56.6217 N, 6.3967 W | RRS Challenger CH2/84 |
| 249384 | Currents -subsurface Eulerian | 1985-01-28 18:45:06 | 56.63 N, 6.4017 W | RRS Challenger CH1/85 |
| 249396 | Currents -subsurface Eulerian | 1985-05-07 22:00:00 | 56.62 N, 6.4 W | RRS Challenger CH4/85 |
| 60863 | Currents -subsurface Eulerian | 1985-08-19 09:00:00 | 56.625 N, 6.4 W | RRS Challenger CH8/85 |
| 60967 | Currents -subsurface Eulerian | 1985-12-15 17:00:00 | 56.6167 N, 6.4 W | RRS Frederick Russell FR13/85 |
| 61018 | Currents -subsurface Eulerian | 1986-03-21 21:00:00 | 56.619 N, 6.4065 W | RRS Charles Darwin CD10B |
| 61092 | Currents -subsurface Eulerian | 1986-06-14 19:00:00 | 56.6233 N, 6.4033 W | MV Dawn Sky DSK1/86 |
| 249403 | Currents -subsurface Eulerian | 1987-01-09 16:00:06 | 56.6267 N, 6.3867 W | RRS Challenger CH9 |
| 249187 | Currents -subsurface Eulerian | 1987-09-01 09:00:00 | 56.625 N, 6.405 W | RRS Frederick Russell FR18/87 |
| 249280 | Currents -subsurface Eulerian | 1987-11-29 14:30:06 | 56.63 N, 6.41 W | RRS Challenger CH22 |
| 249292 | Currents -subsurface Eulerian | 1987-11-29 14:30:06 | 56.63 N, 6.41 W | RRS Challenger CH22 |
| 249323 | Currents -subsurface Eulerian | 1988-03-07 12:00:00 | 56.625 N, 6.415 W | RRS Challenger CH25 |
| 249311 | Currents -subsurface Eulerian | 1988-03-07 12:00:06 | 56.625 N, 6.415 W | RRS Challenger CH25 |
| 1803993 | Currents -subsurface Eulerian | 1988-06-08 15:00:00 | 56.62833 N, 6.40333 W | RRS Challenger CH30 |
| 1804007 | Currents -subsurface Eulerian | 1988-06-08 15:00:00 | 56.62833 N, 6.40333 W | RRS Challenger CH30 |
| 1804019 | Currents -subsurface Eulerian | 1989-01-23 16:30:06 | 56.62667 N, 6.39167 W | RRS Discovery D180 |
| 1804020 | Currents -subsurface Eulerian | 1989-01-23 16:30:06 | 56.62667 N, 6.39167 W | RRS Discovery D180 |
| 1804032 | Currents -subsurface Eulerian | 1989-05-05 11:30:06 | 56.61667 N, 6.40333 W | RV Lough Foyle LF1/89 |
| 1804044 | Currents -subsurface Eulerian | 1989-08-04 14:00:00 | 56.61833 N, 6.405 W | RV Lough Foyle LF2/89 |
| 1804056 | Currents -subsurface Eulerian | 1989-08-04 14:00:00 | 56.61833 N, 6.405 W | RV Lough Foyle LF2/89 |
| 508056 | Currents -subsurface Eulerian | 1993-05-21 08:45:00 | 56.6283 N, 6.3967 W | RRS Challenger CH103 |
| 508308 | Currents -subsurface Eulerian | 1993-05-21 08:45:06 | 56.6283 N, 6.3967 W | RRS Challenger CH103 |
| 508068 | Currents -subsurface Eulerian | 1993-09-10 14:30:06 | 56.6255 N, 6.4018 W | RRS Challenger CH105 |
| 508136 | Currents -subsurface Eulerian | 1993-09-10 14:30:06 | 56.6255 N, 6.4018 W | RRS Challenger CH105 |
| 508044 | Currents -subsurface Eulerian | 1994-03-14 19:30:06 | 56.6267 N, 6.4033 W | RRS Challenger CH110 |
| 508081 | Currents -subsurface Eulerian | 1994-05-09 14:45:06 | 56.6283 N, 6.3983 W | RRS Challenger CH112 |
| 508148 | Currents -subsurface Eulerian | 1994-05-09 14:45:06 | 56.6283 N, 6.3983 W | RRS Challenger CH112 |
| 508032 | Currents -subsurface Eulerian | 1994-08-15 21:15:00 | 56.62 N, 6.4017 W | RRS Challenger CH114 |
| 508204 | Currents -subsurface Eulerian | 1994-08-15 21:15:06 | 56.62 N, 6.4017 W | RRS Challenger CH114 |
| 508093 | Currents -subsurface Eulerian | 1994-11-28 13:45:17 | 56.62 N, 6.4 W | RRS Challenger CH116 |
| 508161 | Currents -subsurface Eulerian | 1994-11-28 14:15:05 | 56.62 N, 6.4 W | RRS Challenger CH116 |
| 508228 | Currents -subsurface Eulerian | 1995-04-14 14:45:06 | 56.6183 N, 6.3933 W | RRS Charles Darwin CD92B |
| 508277 | Currents -subsurface Eulerian | 1995-04-14 14:45:06 | 56.6183 N, 6.3933 W | RRS Charles Darwin CD92B |
| 508100 | Currents -subsurface Eulerian | 1995-07-29 14:45:00 | 56.6177 N, 6.4062 W | RRS Challenger CH120 |
| 508173 | Currents -subsurface Eulerian | 1995-07-29 14:45:00 | 56.6177 N, 6.4062 W | RRS Challenger CH120 |
| 508241 | Currents -subsurface Eulerian | 1996-01-19 18:15:06 | 56.6217 N, 6.3883 W | RRS Challenger CH124 |
| 508289 | Currents -subsurface Eulerian | 1996-01-19 18:15:06 | 56.6217 N, 6.3883 W | RRS Challenger CH124 |
| 508112 | Currents -subsurface Eulerian | 1996-05-16 19:15:06 | 56.622 N, 6.4042 W | Not applicable |
| 508185 | Currents -subsurface Eulerian | 1996-05-16 19:15:06 | 56.622 N, 6.4042 W | Not applicable |
| 508290 | Currents -subsurface Eulerian | 1996-09-16 15:15:00 | 56.6217 N, 6.4083 W | Not applicable |
| 508253 | Currents -subsurface Eulerian | 1996-10-07 07:15:00 | 56.6217 N, 6.4083 W | Not applicable |
| 508197 | Currents -subsurface Eulerian | 1997-04-30 13:15:06 | 56.625 N, 6.4 W | Not applicable |
| 508265 | Currents -subsurface Eulerian | 1997-04-30 13:15:06 | 56.625 N, 6.4 W | Not applicable |
| 508124 | Currents -subsurface Eulerian | 1997-07-16 12:15:06 | 56.625 N, 6.3967 W | Not applicable |
| 508216 | Currents -subsurface Eulerian | 1997-07-16 12:15:06 | 56.625 N, 6.3967 W | Not applicable |
| 1805084 | Currents -subsurface Eulerian | 2002-05-09 22:00:00 | 56.6283 N, 6.396 W | Not applicable |
| 1805096 | Currents -subsurface Eulerian | 2002-08-20 22:00:00 | 56.6283 N, 6.396 W | Not applicable |
| 1805047 | Currents -subsurface Eulerian | 2002-12-10 16:00:00 | 56.6283 N, 6.396 W | Not applicable |
| 1805072 | Currents -subsurface Eulerian | 2003-03-12 21:00:00 | 56.6283 N, 6.396 W | Not applicable |
| 1805059 | Currents -subsurface Eulerian | 2003-05-01 16:00:00 | 56.6283 N, 6.396 W | Not applicable |
| 1805035 | Currents -subsurface Eulerian | 2003-06-27 12:00:00 | 56.6283 N, 6.396 W | Not applicable |
| 1805060 | Currents -subsurface Eulerian | 2003-08-22 13:00:00 | 56.6283 N, 6.396 W | Not applicable |
| 1804855 | Currents -subsurface Eulerian | 2004-01-15 19:00:00 | 56.6283 N, 6.396 W | Not applicable |
| 1804867 | Currents -subsurface Eulerian | 2004-05-26 15:00:00 | 56.6283 N, 6.396 W | Not applicable |
| 1804879 | Currents -subsurface Eulerian | 2004-12-07 18:00:00 | 56.6283 N, 6.396 W | Not applicable |
| 1804880 | Currents -subsurface Eulerian | 2005-02-25 15:00:00 | 56.6283 N, 6.396 W | Not applicable |
| 1804892 | Currents -subsurface Eulerian | 2005-05-03 17:00:00 | 56.6283 N, 6.396 W | Not applicable |
| 1805023 | Currents -subsurface Eulerian | 2005-06-23 23:00:00 | 56.6283 N, 6.396 W | Not applicable |
| 1805103 | Currents -subsurface Eulerian | 2005-11-22 16:00:00 | 56.6283 N, 6.396 W | Not applicable |
| 1805115 | Currents -subsurface Eulerian | 2006-04-27 22:00:00 | 56.6283 N, 6.396 W | Not applicable |
| 1804911 | Currents -subsurface Eulerian | 2007-05-09 16:00:00 | 56.6283 N, 6.396 W | Not applicable |
| 1804923 | Currents -subsurface Eulerian | 2007-09-28 13:00:00 | 56.6283 N, 6.396 W | Not applicable |
| 1804984 | Currents -subsurface Eulerian | 2008-02-13 15:00:00 | 56.6283 N, 6.396 W | Not applicable |
| 1804935 | Currents -subsurface Eulerian | 2008-09-24 19:00:00 | 56.6283 N, 6.396 W | Not applicable |
| 1804996 | Currents -subsurface Eulerian | 2009-02-24 20:00:00 | 56.6283 N, 6.396 W | Not applicable |
| 1804947 | Currents -subsurface Eulerian | 2009-06-03 15:00:00 | 56.6283 N, 6.396 W | Not applicable |
| 1804959 | Currents -subsurface Eulerian | 2010-01-07 17:00:00 | 56.6283 N, 6.396 W | Not applicable |
| 1804960 | Currents -subsurface Eulerian | 2010-09-20 17:00:00 | 56.6283 N, 6.396 W | Not applicable |
| 1804972 | Currents -subsurface Eulerian | 2011-02-16 20:00:00 | 56.6283 N, 6.396 W | Not applicable |
| 1805011 | Currents -subsurface Eulerian | 2011-07-21 20:00:00 | 56.6283 N, 6.396 W | Not applicable |
