Metadata Report for BODC Series Reference Number 2202968
Metadata Summary
Problem Reports
Data Access Policy
Narrative Documents
Project Information
Data Activity or Cruise Information
Fixed Station Information
BODC Quality Flags
SeaDataNet Quality Flags
Metadata Summary
Data Description |
|||||||||||||||||||||||||||||||||||||||||||||||||||||||||||||||||
|
|||||||||||||||||||||||||||||||||||||||||||||||||||||||||||||||||
Data Identifiers |
|||||||||||||||||||||||||||||||||||||||||||||||||||||||||||||||||
|
|||||||||||||||||||||||||||||||||||||||||||||||||||||||||||||||||
Time Co-ordinates(UT) |
|||||||||||||||||||||||||||||||||||||||||||||||||||||||||||||||||
|
|||||||||||||||||||||||||||||||||||||||||||||||||||||||||||||||||
Spatial Co-ordinates | |||||||||||||||||||||||||||||||||||||||||||||||||||||||||||||||||
|
|||||||||||||||||||||||||||||||||||||||||||||||||||||||||||||||||
Parameters |
|||||||||||||||||||||||||||||||||||||||||||||||||||||||||||||||||
|
|||||||||||||||||||||||||||||||||||||||||||||||||||||||||||||||||
|
|||||||||||||||||||||||||||||||||||||||||||||||||||||||||||||||||
Problem Reports
No Problem Report Found in the Database
RRS James Cook JC125 CTD Data Quality Report
Spikes in salinity (PSALST01) at the surface 8 m of cast 007, and 10 m of casts 011, 015, 018 and 019 have been flagged by BODC (BODC flag M) due to sensors equilibrating. As potential density (SIGTPR01) is derived using salinity, potential density values corresponding to the depths and casts specified have also been flagged by BODC.
Spikes in oxygen concentration (DOXYUCKG and DOXYSU01) and oxygen saturation (OXYSSU01) at the surface 8 m of cast 007, and 10 m of casts 011, 013, 014, 015, 016, 017, 018 and 019 have been flagged by BODC due to sensors equilibrating.
Any chlorophyll (CPHLPM01) values below 0 mg/m3, attenuance (ATTNDR01) values below 0/m and transmittance (POPTDR01) values over 100% from all casts have been flagged by BODC.
All chlorophyll and turbidity (BB117R02) values for casts 001, 002 and 003 only have been flagged as null (BODC flag N) by the originator due to incorrect calibration coefficients being applied upon processing.
An attenuance value during cast 017 at 106 m depth has been flagged as null as specified by the dataset originator.
Spikes in attenuance and transmittance during cast 010 at 804 m, and cast 016 at 700 m have been flagged by BODC. Additionally, spikes in turbidity during cast 014 at both 8 m and 206 m have been flagged by BODC.
Data Access Policy
Open Data
These data have no specific confidentiality restrictions for users. However, users must acknowledge data sources as it is not ethical to publish data without proper attribution. Any publication or other output resulting from usage of the data should include an acknowledgment.
If the Information Provider does not provide a specific attribution statement, or if you are using Information from several Information Providers and multiple attributions are not practical in your product or application, you may consider using the following:
"Contains public sector information licensed under the Open Government Licence v1.0."
Narrative Documents
Sea-Bird Dissolved Oxygen Sensor SBE 43 and SBE 43F
The SBE 43 is a dissolved oxygen sensor designed for marine applications. It incorporates a high-performance Clark polarographic membrane with a pump that continuously plumbs water through it, preventing algal growth and the development of anoxic conditions when the sensor is taking measurements.
Two configurations are available: SBE 43 produces a voltage output and can be incorporated with any Sea-Bird CTD that accepts input from a 0-5 volt auxiliary sensor, while the SBE 43F produces a frequency output and can be integrated with an SBE 52-MP (Moored Profiler CTD) or used for OEM applications. The specifications below are common to both.
Specifications
| Housing | Plastic or titanium |
| Membrane | 0.5 mil- fast response, typical for profile applications 1 mil- slower response, typical for moored applications |
| Depth rating | 600 m (plastic) or 7000 m (titanium) 10500 m titanium housing available on request |
| Measurement range | 120% of surface saturation |
| Initial accuracy | 2% of saturation |
| Typical stability | 0.5% per 1000 h |
Further details can be found in the manufacturer's specification sheet.
JC125 CTD Instrumentation
The Sea-Bird Scientific SBE911plus CTD was mounted on a rosette with a SBE32 carousel water sampler and 24 10 L OTE bottles. The CTD was fitted with the following scientific sensors:
| Sensor | Serial Number | Calibration Date | Comments |
|---|---|---|---|
| Sea-Bird SBE 911plus CTD | 09P-46253-0869 / 11P-22559-0532 | - | The 9plus unit was used during casts 001-003 only. Upon later inspection, the 9plus unit was found to be flooded. |
| Sea-Bird SBE 911plus CTD | 09P-71442-1142 / 11P-22559-0532 | - | The 9plus unit was used during casts 004-020 only. The same 11plus deck unit and all sensors, unless specified, were used for all casts. |
| Sea-Bird SBE 32 Carousel Water Sampler | 32-19817-0243 | - | - |
| Paroscientific Digiquartz Pressure Sensor | 100898 | 18-Mar-2015 | Used during casts 001-003 only. |
| Paroscientific Digiquartz Pressure Sensor | 124216 | 03-Mar-2013 | Used during casts 004-020 only. |
| Sea-Bird SBE 3plus (SBE 3P) temperature sensor | 03P-4380 | 21-Feb-2015 | Primary sensor |
| Sea-Bird SBE 3plus (SBE 3P) temperature sensor | 03P-4383 | 21-Jan-2015 | Secondary sensor |
| Sea-Bird SBE 4C conductivity sensor | 04C-2165 | 23-Feb-2015 | Primary sensor |
| Sea-Bird SBE 4C conductivity sensor | 04C-2580 | 07-Oct-2014 | Secondary sensor |
| Sea-Bird SBE 43 Dissolved Oxygen Sensor | 43-1624 | 19-Dec-2014 | - |
| Chelsea Technologies Group Alphatracka II transmissometer | 07-6075-001 | 22-Jun-2015 | - |
| Chelsea Technologies Group Aquatracka III fluorometer | 08-2615-126 | 06-Aug-2014 | - |
| Benthos PSA 916T Altimeter | 41302 | - | Not working during casts 001 and 002 as a problem was found in the y-cable. The cable was swapped for a spare and the altimeter worked well for the remaining duration of the cruise.
No calibration date available. |
| WETLabs ECO BB(RT)D backscattering sensor | BBRTD-169 | 09-Aug-2013 | - |
Additional Information
After CTD cast 002 it was noticed that the CTD wire had been incorrectly run through one of the last sheave blocks. Approximately 100 metres of wire had been run over a flat of metal instead of round the sheave block. The wire was re-run correctly and after inspection of the wire and consultation with the CPOS it was decided that the wire was good for use. During CTD cast 003, on the upcast from 3950 m at a depth of approximately 3667 m, all coms with the CTD package were lost. During recovery the section of wire that had been run over the metal flat was inspected and found to have the outer armor opening up and without any tension on it. It was decided that as a matter of course that section of wire would be cut off (130 metres was removed). Immediately after the re-termination was completed it was load tested by following the normal procedure of being pulled at 0.5 T, 1.0 T, 1.5 T and 2.0 T. It was held for 5 minutes at each and re-torqued between each. The mechanical termination was re-torqued, as per standard operating procedure, initially after every cast until no further movement was observed and then periodically between casts. It was also meggered and recorded a value of >550 MOhms.
During CTD casts 008, 009 and 010, there were issues with leaking water sampling bottles. The lanyards were lengthened by removing the knot in them and they mostly sealed fine after that.
During CTD casts 016 and 017 there were large differences in the data from the transmissometer between the upcast and the down cast, particularly at depth. Upon later inspection it was found that water had gotten into the connector and caused the pins to corrode. As the Y-cable was shared between the transmissometer and the flouomreter the Y-cable and both instrument cables were swapped. The instruments worked well after this.
Throughout the cruise there was regularly grease found on the CTD frame. This was coming from the core wire in several ways. Directly from the core wire when it was stowed in the CTD hanger, from the hands and overalls of the personnel working around the CTD frame after contact with the core wire and also by dripping down from the sheave blocks onto the CTD package. Small lumps of grease were found inside the CTD frame and on the bottles on regular occasions. There is a definite risk of causing contamination of samples when the core wire is being used alongside the CTD package with the current levels of grease on the wire.
Sea-Bird Electronics SBE 911 and SBE 917 series CTD profilers
The SBE 911 and SBE 917 series of conductivity-temperature-depth (CTD) units are used to collect hydrographic profiles, including temperature, conductivity and pressure as standard. Each profiler consists of an underwater unit and deck unit or SEARAM. Auxiliary sensors, such as fluorometers, dissolved oxygen sensors and transmissometers, and carousel water samplers are commonly added to the underwater unit.
Underwater unit
The CTD underwater unit (SBE 9 or SBE 9 plus) comprises a protective cage (usually with a carousel water sampler), including a main pressure housing containing power supplies, acquisition electronics, telemetry circuitry, and a suite of modular sensors. The original SBE 9 incorporated Sea-Bird's standard modular SBE 3 temperature sensor and SBE 4 conductivity sensor, and a Paroscientific Digiquartz pressure sensor. The conductivity cell was connected to a pump-fed plastic tubing circuit that could include auxiliary sensors. Each SBE 9 unit was custom built to individual specification. The SBE 9 was replaced in 1997 by an off-the-shelf version, termed the SBE 9 plus, that incorporated the SBE 3 plus (or SBE 3P) temperature sensor, SBE 4C conductivity sensor and a Paroscientific Digiquartz pressure sensor. Sensors could be connected to a pump-fed plastic tubing circuit or stand-alone.
Temperature, conductivity and pressure sensors
The conductivity, temperature, and pressure sensors supplied with Sea-Bird CTD systems have outputs in the form of variable frequencies, which are measured using high-speed parallel counters. The resulting count totals are converted to numeric representations of the original frequencies, which bear a direct relationship to temperature, conductivity or pressure. Sampling frequencies for these sensors are typically set at 24 Hz.
The temperature sensing element is a glass-coated thermistor bead, pressure-protected inside a stainless steel tube, while the conductivity sensing element is a cylindrical, flow-through, borosilicate glass cell with three internal platinum electrodes. Thermistor resistance or conductivity cell resistance, respectively, is the controlling element in an optimized Wien Bridge oscillator circuit, which produces a frequency output that can be converted to a temperature or conductivity reading. These sensors are available with depth ratings of 6800 m (aluminium housing) or 10500 m (titanium housing). The Paroscientific Digiquartz pressure sensor comprises a quartz crystal resonator that responds to pressure-induced stress, and temperature is measured for thermal compensation of the calculated pressure.
Additional sensors
Optional sensors for dissolved oxygen, pH, light transmission, fluorescence and others do not require the very high levels of resolution needed in the primary CTD channels, nor do these sensors generally offer variable frequency outputs. Accordingly, signals from the auxiliary sensors are acquired using a conventional voltage-input multiplexed A/D converter (optional). Some Sea-Bird CTDs use a strain gauge pressure sensor (Senso-Metrics) in which case their pressure output data is in the same form as that from the auxiliary sensors as described above.
Deck unit or SEARAM
Each underwater unit is connected to a power supply and data logging system: the SBE 11 (or SBE 11 plus) deck unit allows real-time interfacing between the deck and the underwater unit via a conductive wire, while the submersible SBE 17 (or SBE 17 plus) SEARAM plugs directly into the underwater unit and data are downloaded on recovery of the CTD. The combination of SBE 9 and SBE 17 or SBE 11 are termed SBE 917 or SBE 911, respectively, while the combinations of SBE 9 plus and SBE 17 plus or SBE 11 plus are termed SBE 917 plus or SBE 911 plus.
Specifications
Specifications for the SBE 9 plus underwater unit are listed below:
| Parameter | Range | Initial accuracy | Resolution at 24 Hz | Response time |
|---|---|---|---|---|
| Temperature | -5 to 35°C | 0.001°C | 0.0002°C | 0.065 sec |
| Conductivity | 0 to 7 S m-1 | 0.0003 S m-1 | 0.00004 S m-1 | 0.065 sec (pumped) |
| Pressure | 0 to full scale (1400, 2000, 4200, 6800 or 10500 m) | 0.015% of full scale | 0.001% of full scale | 0.015 sec |
Further details can be found in the manufacturer's specification sheet.
Chelsea Technologies Group Aquatracka MKIII fluorometer
The Chelsea Technologies Group Aquatracka MKIII is a logarithmic response fluorometer. Filters are available to enable the instrument to measure chlorophyll, rhodamine, fluorescein and turbidity.
It uses a pulsed (5.5 Hz) xenon light source discharging along two signal paths to eliminate variations in the flashlamp intensity. The reference path measures the intensity of the light source whilst the signal path measures the intensity of the light emitted from the specimen under test. The reference signal and the emitted light signals are then applied to a ratiometric circuit. In this circuit, the ratio of returned signal to reference signal is computed and scaled logarithmically to achieve a wide dynamic range. The logarithmic conversion accuracy is maintained at better than one percent of the reading over the full output range of the instrument.
Two variants of the instrument are available, both manufactured in titanium, capable of operating in depths from shallow water down to 2000 m and 6000 m respectively. The optical characteristics of the instrument in its different detection modes are visible below:
| Excitation | Chlorophyll a | Rhodamine | Fluorescein | Turbidity |
|---|---|---|---|---|
| Wavelength (nm) | 430 | 500 | 485 | 440* |
| Bandwidth (nm) | 105 | 70 | 22 | 80* |
| Emission | Chlorophyll a | Rhodamine | Fluorescein | Turbidity |
| Wavelength (nm) | 685 | 590 | 530 | 440* |
| Bandwidth (nm) | 30 | 45 | 30 | 80* |
* The wavelengths for the turbidity filters are customer selectable but must be in the range 400 to 700 nm. The same wavelength is used in the excitation path and the emission path.
The instrument measures chlorophyll a, rhodamine and fluorescein with a concentration range of 0.01 µg l-1 to 100 µg l-1. The concentration range for turbidity is 0.01 to 100 FTU (other wavelengths are available on request).
The instrument accuracy is ± 0.02 µg l-1 (or ± 3% of the reading, whichever is greater) for chlorophyll a, rhodamine and fluorescein. The accuracy for turbidity, over a 0 - 10 FTU range, is ± 0.02 FTU (or ± 3% of the reading, whichever is greater).
Further details are available from the Aquatracka MKIII specification sheet.
Chelsea Technologies Group ALPHAtracka and ALPHAtracka II transmissometers
The Chelsea Technologies Group ALPHAtracka (the Mark I) and its successor, the ALPHAtracka II (the Mark II), are both accurate (< 0.3 % fullscale) transmissometers that measure the beam attenuation coefficient at 660 nm. Green (565 nm), yellow (590 nm) and blue (470 nm) wavelength variants are available on special order.
The instrument consists of a Transmitter/Reference Assembly and a Detector Assembly aligned and spaced apart by an open support frame. The housing and frame are both manufactured in titanium and are pressure rated to 6000 m depth.
The Transmitter/Reference housing is sealed by an end cap. Inside the housing an LED light source emits a collimated beam through a sealed window. The Detector housing is also sealed by an end cap. A signal photodiode is placed behind a sealed window to receive the collimated beam from the Transmitter.
The primary difference between the ALPHAtracka and ALPHAtracka II is that the Alphatracka II is implemented with surface-mount technology; this has enabled a much smaller diameter pressure housing to be used while retaining exactly the same optical train as in the Mark I. Data from the Mark II version are thus fully compatible with that already obtained with the Mark I. The performance of the Mark II is further enhanced by two electronic developments from Chelsea Technologies Group - firstly, all items are locked in a signal nulling loop of near infinite gain and, secondly, the signal output linearity is inherently defined by digital circuitry only.
Among other advantages noted above, these features ensure that the optical intensity of the Mark II, indicated by the output voltage, is accurately represented by a straight line interpolation between a reading near full-scale under known conditions and a zero reading when blanked off.
For optimum measurements in a wide range of environmental conditions, the Mark I and Mark II are available in 5 cm, 10 cm and 25 cm path length versions. Output is default factory set to 2.5 volts but can be adjusted to 5 volts on request.
Further details about the Mark II instrument are available from the Chelsea Technologies Group ALPHAtrackaII specification sheet.
WETLabs Single-angle Backscattering Meter ECO BB
An optical scattering sensor that measures scattering at 117°. This angle was determined as a minimum convergence point for variations in the volume scattering function induced by suspended materials and water. The measured signal is less determined by the type and size of the materials in the water and is more directly correlated to their concentration.
Several versions are available, with minor differences in their specifications:
- ECO BB(RT)provides analog or RS-232 serial output with 4000 count range
- ECO BB(RT)D adds the possibility of being deployed in depths up to 6000 m while keeping the capabilities of ECO BB(RT)
- ECO BB provides the capabilities of ECO BB(RT) with periodic sampling
- ECO BBB is similar to ECO BB but with internal batteries for autonomous operation
- ECO BBS is similar to ECO BB but with an integrated anti-fouling bio-wiper
- ECO BBSB has the capabilities of ECO BBS but with internal batteries for autonomous operation
Specifications
| Wavelength | 471, 532, 660 nm |
| Sensitivity (m-1 sr-1) | 1.2 x 10⁻⁵ at 470 nm 7.7 x 10⁻⁶ at 532 nm 3.8 x 10⁻⁶ at 660 nm |
| Typical range | ~0.0024 to 5 m-1 |
| Linearity | 99% R2 |
| Sample rate | up to 8Hz |
| Temperature range | 0 to 30°C |
| Depth rating | 600 m (standard) 6000 m (deep) |
Further details can be found in the manufacturer's specification sheet.
JC125 CTD BODC Processing
The CTD data were supplied to BODC as 20 MATLAB files and converted to the BODC internal format.
During transfer the originator's variables were mapped to unique BODC parameter codes. The following table shows the parameter mapping.
| Originators variable | Originators Units | BODC Code | BODC Units | Comments |
|---|---|---|---|---|
| z | m | DEPHPR01 | m | Depth (binned at 2 m) |
| temp | degC | TEMPST01 | degC | ITS-90Secondary sensor data used |
| sal | PSU | PSALST01 | PSU | Secondary sensor data used |
| oxy | umol/kg | DOXYSU01 | umol/L | Units converted using conversion factor based on SIGTPR01 |
| chl | ug/L | CPHLPM01 | mg/m3 | ug/l = mg/m3 |
| tran | % | POPTDR01 | % | - |
| att | 1/m | ATTNMR01 | /m | - |
| turb | m-1/Sr | BB117R02 | m/nm/sr | m-1/Sr = m/nm/sr | pres | db | PRESPR01 | dbar | - |
| - | - | POTMCV01 | degC | Derived by BODC using TEMPST01, PSALST01 and PRESPR01 |
| - | - | SIGTPR01 | kg/m3 | Derived by BODC using POTMCV01, PSALST01 and PRESPR01 |
| - | - | TOKGPR01 | L/kg | Derived by BODC using SIGTPR01 |
| - | - | OXYSSU01 | % | Derived by BODC using DOXYSU01, TEMPST01 and PSALST01 |
Following transfer the data were screened using BODC in-house visualisation software.
Originators Data Processing of CTD casts from cruise JC125
Sampling Strategy
In total 20 CTD cast deployments were used to obtain profiles of the water column from a range of sensors comprising of temperature, conductivity, pressure, oxygen, fluorescence, turbidity, transmittance, and attenuance. Deployments were conventional profiling casts using 24 x 10 L OTE stainless steel Niskin bottles for sampling water, with bottles only fired during 10 of the 20 casts. CTD’s were deployed between 10 August 2015 to 06 September 2015 on an opportunistic basis. The deepest cast was CTD003 at station 13 which descended to 3956 m. Whereas the shallowest cast was CTD002 at station 2 which descended to 109 m.
Initial Data Processing
For the processing of the data, the Sea-Bird data collection software Seasave-Win32 were used to record the raw data output from the CTD casts. Processing the raw data followed the BODC recommended guidelines using SBE Data processing-Win32 v7.23.2 software. Outlined below are the processing routines used for all casts:
- Data Conversion
- Bottle Summary
- Filter 0.15 s on pressure only
- AlignCTD 5 s on oxygen channel only
- CellTM
- Derive - depth, salinity, oxygen concentration
- BinAverage from 24 Hz into 2 Hz
- Strip - depth, salinity, oxygen concentration
- ASCII Out for 2 Hz (stripped)
Calibrations and Further Data Processing
Please see the JC125 cruise report for details of the calibration coefficients applied to the data for casts CTD001 - CTD003 and CTD004 - CTD020.
During a later cruise to the Whittard Canyon (JC237), the CTD data from JC125 were reassessed and compared with the new JC237 CTD data. It was noticed that the calibration coefficients originally applied to the chlorophyll fluorometer and turbidity sensors were incorrect. The correct calibration coefficients from the NMF instrument database, listed below, were applied and reprocesed for casts CTD004 - CTD020 only. The original calibrations were kept for casts CTD001 - CTD003, however the chlorophyll fluorometer and turbidity data were omitted. Please see the JC237 cruise report for more information.
Chelsea Technologies Group Aquatracka III fluorometer (s/n: 08-2615-126) Calibration date: 06-Aug-2014 V1: 2.2537 WETLabs ECO BB(RT)D backscattering sensor (s/n: BBRTD-169) Calibration date: 09-Aug-2013 Scale factor: 4.011 × 10⁻³ m/sr/V Dark voltage: 0.0924 V
Additionally during the reprocessing, the CTD data in the full resolution 24 Hz files from all casts were averaged (median value) into 2 m bins for the downcast, upcast and the downcast and upcat combined. The data were output into MATLAB files.
Project Information
COmplex Deep-sea Environments: Mapping habitat heterogeneity As Proxy for biodiversity (CODEMAP)
Background
The deep ocean is considered the last frontier on Earth, holding resources such as food, minerals and hydrocarbons that increasingly attract human attention as potential alternatives for dwindling stocks on land. However, the deep sea is poorly understood: many areas are yet to be explored, and new species are still found on a regular basis. This lack of understanding hampers our ability to assess the potential impact of human activities in these waters, and limits our capability to design effective management strategies for future activities.
Biodiversity, the main indicator of ecosystem status and functioning, is the key parameter underpinning most ecosystem-based approaches to marine spatial planning and conservation, but measuring it is a major challenge in deep water; traditional sampling schemes are expensive and time-consuming, and their limited coverage makes it difficult to relate the results to regional patterns. Complex deep-sea environments are especially problematic due to their steep and irregular terrain. Ecosystem hotspots such as canyons or coral reefs contain true 3D morphology that cannot be surveyed with conventional techniques. CODEMAP aims to quantify habitat heterogeneity in complex deep-sea terrains, and evaluate its potential as a proxy for benthic biodiversity at a variety of scales. Habitat heterogeneity has been suggested as a major driver for deep-sea biodiversity, but is rarely quantified in a spatial context in the marine realm.
To achieve its goal, CODEMAP will combine the fields of marine geology, ecology, remote sensing and underwater vehicle technology to establish an integrated, statistically robust, and fully 3D methodology to map complex deep-sea habitats. Statistical techniques will be developed to extrapolate quantitative habitat information from fine-scale surveys to broad-scale maps. The optimal parameters to measure habitat heterogeneity will be defined, and their potential as biodiversity indicators tested through correlation with traditional approaches. The project focuses on submarine canyons, but the techniques will also be transferred to other environments. CODEMAP is expected to have a strong impact on the fundamental understanding of the deep sea and on ecosystem-based deep-sea management.
The research is organised around four themes:
- Top-down analysis: robust mapping of habitats and marine landscapes on the regional to medium scale.
- Quantification of habitat heterogeneity and evaluation of its potential as proxy for biodiversity.
- Bottom-up analysis: finding quantitative relationships that can bring information from a more detailed to a broader scale.
- Habitat heterogeneity in 3D through mapping and visualisation.
Fieldwork
Fieldwork was carried out on two research cruises. JC060 (RRS James Cook) between May and June 2011. The cruise covered the areas of Rockall Trough, Rockall Bank and Hatton Basin, northwest of Scotland and Ireland, and used an Autosub6000 Autonomous Underwater Vehicle (AUV), newly equipped with an EdgeTech dual frequency high-resolution sidescan sonar plus chirp profiler and a monochrome stills camera, a commercial inspection class ROV, and more traditional equipment including piston-, mega- and boxcores, CTD and shipborne multibeam (EM120 and EM710). The second cruise was from August to September 2015 on board JC125 (RRS James Cook) which covered the Whittard Canyon, south-west of Ireland and the UK. This cruise involved the ROV Isis and AUV Autosub6000, CTDs, ADCPs, piston-, mega- and boxcores, and shipborne multibeam (EM120 and EM710).
Participants
- Dr Veerle Huvenne (Principal investigator) National Oceanography Centre, Southampton.
- Dr Daniel Jones (Co-Investigator) National Oceanography Centre, Southampton.
- Dr Tim Le Bas (Co-Investigator) National Oceanography Centre, Southampton.
- Steve McPhail (Co-Investigator) National Oceanography Centre, Southampton.
- Katleen Robert (Co-Investigator) National Oceanography Centre, Southampton.
- Khaira Ismail (Co-Investigator) National Oceanography Centre, Southampton.
- Dr Claudio Lo Iacono (Co-Investigator) National Oceanography Centre, Southampton.
Funding
The project was funded under the EU Commission Seventh Framework Programme, FP7 (2007-2013), grant agreement ID 258482. It ran from 1st April 2011 to 31st January 2017. More information can be found here and on the website.
Data Activity or Cruise Information
Cruise
| Cruise Name | JC125 (JC124, JC126) |
| Departure Date | 2015-08-09 |
| Arrival Date | 2015-09-12 |
| Principal Scientist(s) | Jennifer A Gales (University of Plymouth, School of Biological and Marine Sciences), Russell B Wynn (National Oceanography Centre, Southampton), Veerle A Huvenne (National Oceanography Centre, Southampton) |
| Ship | RRS James Cook |
Complete Cruise Metadata Report is available here
Fixed Station Information
Fixed Station Information
| Station Name | Whittard Canyon - The Canyons Marine Conservation Zone |
| Category | Offshore area |
| Latitude | 48° 6.00' N |
| Longitude | 10° 18.00' W |
| Water depth below MSL | 3600.0 m |
Fixed Station - Whittard Canyon - The Canyons Marine Conservation Zone
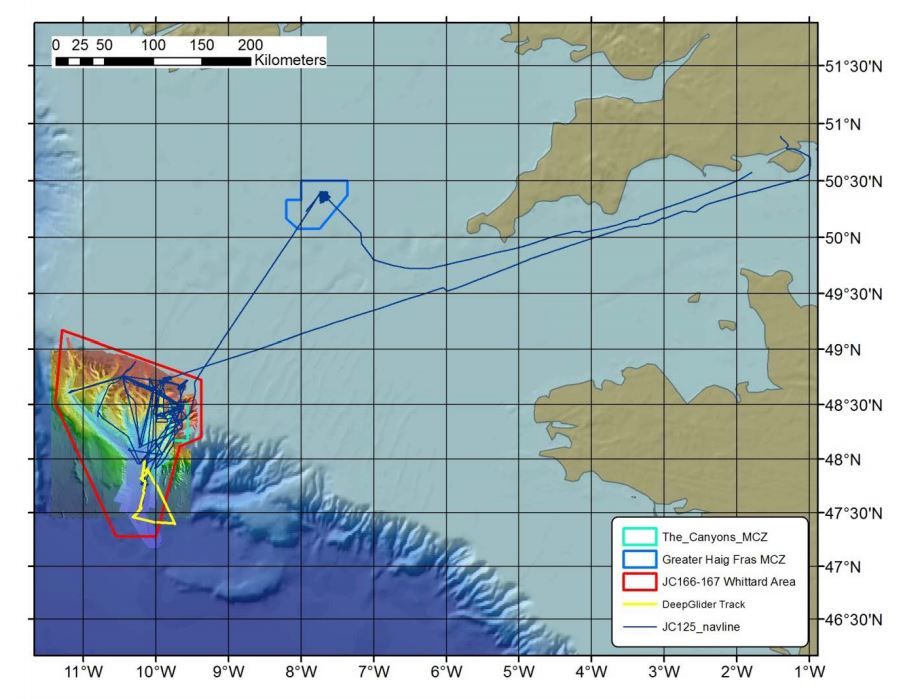
The Canyons MCZ is located in the far south-west corner of the UK continental shelf, more than 330 km from Land's End, Cornwall. It encompasses the steep part of the shelf break where the seabed drops from a depth of 100 m to the oceanic abyssal plain at 2000 m. It is unique within the context of England's largely shallow seas due to its depth, sea-bed topography and the coral features it contains.
There are two large canyons within the site, which add to its topographic complexity: the Explorer Canyon to the north and the Dangaard Canyon below it. The wider Whittard Canyon area encapsulates the Canyons MCZ and also includes a network of submarine canyons to the West. The MCZ, also known as a Marine Protected Area (MPA), was designated in November 2013 under the Marine and Coastal Access Act (2009). The Canyons MCZ covers an area of 661 km2, which extends to approximately 5200 km2 when Whittard Canyon is included.
On the northernmost wall of the Explorer Canyon is a patch of live Cold-water coral reef (Lophelia pertusa) and Coral gardens, both of which are a OSPAR threatened and/or declining habitat. This is the only known example of living Cold-water coral reef recorded within England's seas, making it unique in these waters.
Cold-water corals and Coral gardens typically support a range of other organisms. The coral provides a three-dimensional structure and a variety of microhabitats that provide shelter and an attachment surface for other species. Both Cold-water corals and Coral gardens can be long-lived but are extremely slow growing (at about 6 mm a year), making protection important for their conservation. Another reef-forming cold-water coral, Madrepora oculata, is also present in the site.
The variety of deep-sea bed communities present are indicative of the range of substrates found in and around the canyons, including bedrock, biogenic reef, coral rubble, coarse sediment, mud and sand. These biological communities include cold-water coral communities (Lophelia pertusa and Madrepora oculata), Coral gardens, feather star (Leptometra celtica) assemblages and Sea-pen and burrowing megafauna communities (including, burrowing anemone fields, squat lobster (Munida sp.) assemblages, barnacle assemblages and deep-sea sea-pen (Kophobelemnon sp.) fields).
Sampling History
| JC035 (2009) | JC125 (2015) | JC166/7 (2018) | |
|---|---|---|---|
| ROV video/photography | Y | Y | Y |
| AUV video/photography | N | Y | Y |
| Shipboard Multibeam Bathymetry | Y | Y | Y |
| AUV Multibeam Bathymetry | N | Y | Y |
| AUV Sidescan Sonar | N | Y | Y |
| TOBI Sidescan Sonar | Y | Y | Y |
| ROV vibrocorer | N | Y | N |
| CTD casts | N | Y | N |
| SAPS | N | Y | N |
Related Fixed Station activities are detailed in Appendix 1
BODC Quality Control Flags
The following single character qualifying flags may be associated with one or more individual parameters with a data cycle:
| Flag | Description |
|---|---|
| Blank | Unqualified |
| < | Below detection limit |
| > | In excess of quoted value |
| A | Taxonomic flag for affinis (aff.) |
| B | Beginning of CTD Down/Up Cast |
| C | Taxonomic flag for confer (cf.) |
| D | Thermometric depth |
| E | End of CTD Down/Up Cast |
| G | Non-taxonomic biological characteristic uncertainty |
| H | Extrapolated value |
| I | Taxonomic flag for single species (sp.) |
| K | Improbable value - unknown quality control source |
| L | Improbable value - originator's quality control |
| M | Improbable value - BODC quality control |
| N | Null value |
| O | Improbable value - user quality control |
| P | Trace/calm |
| Q | Indeterminate |
| R | Replacement value |
| S | Estimated value |
| T | Interpolated value |
| U | Uncalibrated |
| W | Control value |
| X | Excessive difference |
SeaDataNet Quality Control Flags
The following single character qualifying flags may be associated with one or more individual parameters with a data cycle:
| Flag | Description |
|---|---|
| 0 | no quality control |
| 1 | good value |
| 2 | probably good value |
| 3 | probably bad value |
| 4 | bad value |
| 5 | changed value |
| 6 | value below detection |
| 7 | value in excess |
| 8 | interpolated value |
| 9 | missing value |
| A | value phenomenon uncertain |
| B | nominal value |
| Q | value below limit of quantification |
Appendix 1: Whittard Canyon - The Canyons Marine Conservation Zone
Related series for this Fixed Station are presented in the table below. Further information can be found by following the appropriate links.
If you are interested in these series, please be aware we offer a multiple file download service. Should your credentials be insufficient for automatic download, the service also offers a referral to our Enquiries Officer who may be able to negotiate access.
| Series Identifier | Data Category | Start date/time | Start position | Cruise |
|---|---|---|---|---|
| 2026920 | Bathymetry | 2009-06-09 00:00:00 | 47.1792 N, 11.2483 W | RRS James Cook JC035 |
| 2026932 | Bathymetry | 2009-06-09 00:00:00 | 48.4273 N, 11.2343 W | RRS James Cook JC035 |
| 2202723 | CTD or STD cast | 2009-06-22 14:25:05 | 48.15317 N, 10.53967 W | RRS James Cook JC036 |
| 2202735 | CTD or STD cast | 2009-07-09 18:58:19 | 48.81283 N, 11.15917 W | RRS James Cook JC036 |
| 2202747 | CTD or STD cast | 2009-07-10 23:22:15 | 48.2835 N, 10.314 W | RRS James Cook JC036 |
| 2202759 | CTD or STD cast | 2009-07-12 00:52:48 | 48.26533 N, 10.182 W | RRS James Cook JC036 |
| 2202760 | CTD or STD cast | 2009-07-18 05:48:17 | 48.60333 N, 9.9665 W | RRS James Cook JC036 |
| 2202772 | CTD or STD cast | 2009-07-26 03:59:18 | 48.653 N, 10.033 W | RRS James Cook JC036 |
| 2202803 | CTD or STD cast | 2015-08-13 21:32:12 | 47.9595 N, 10.217 W | RRS James Cook JC125 (JC124, JC126) |
| 2027020 | Bathymetry | 2015-08-14 01:23:00 | 47.5404 N, 11.2236 W | RRS James Cook JC125 (JC124, JC126) |
| 2027032 | Bathymetry | 2015-08-15 02:05:00 | 48.4621 N, 9.9608 W | RRS James Cook JC125 (JC124, JC126) |
| 2202815 | CTD or STD cast | 2015-08-15 15:56:36 | 48.38949 N, 9.99615 W | RRS James Cook JC125 (JC124, JC126) |
| 2202827 | CTD or STD cast | 2015-08-16 17:12:56 | 48.65512 N, 10.03444 W | RRS James Cook JC125 (JC124, JC126) |
| 2202839 | CTD or STD cast | 2015-08-20 03:56:28 | 48.65348 N, 10.03337 W | RRS James Cook JC125 (JC124, JC126) |
| 2202840 | CTD or STD cast | 2015-08-20 10:30:09 | 48.76099 N, 10.4609 W | RRS James Cook JC125 (JC124, JC126) |
| 2202852 | CTD or STD cast | 2015-08-25 10:31:46 | 48.46176 N, 9.63347 W | RRS James Cook JC125 (JC124, JC126) |
| 2202864 | CTD or STD cast | 2015-08-25 12:17:30 | 48.46583 N, 9.63871 W | RRS James Cook JC125 (JC124, JC126) |
| 2202876 | CTD or STD cast | 2015-08-25 13:59:18 | 48.4682 N, 9.64339 W | RRS James Cook JC125 (JC124, JC126) |
| 2202888 | CTD or STD cast | 2015-08-26 10:01:43 | 48.47488 N, 9.6532 W | RRS James Cook JC125 (JC124, JC126) |
| 2202907 | CTD or STD cast | 2015-08-26 13:34:15 | 48.46164 N, 9.63353 W | RRS James Cook JC125 (JC124, JC126) |
| 2202919 | CTD or STD cast | 2015-08-26 15:00:47 | 48.46574 N, 9.63858 W | RRS James Cook JC125 (JC124, JC126) |
| 2202920 | CTD or STD cast | 2015-08-26 18:36:18 | 48.46819 N, 9.64337 W | RRS James Cook JC125 (JC124, JC126) |
| 2202932 | CTD or STD cast | 2015-08-26 20:04:18 | 48.47199 N, 9.64881 W | RRS James Cook JC125 (JC124, JC126) |
| 2202944 | CTD or STD cast | 2015-08-26 21:54:21 | 48.48103 N, 9.6606 W | RRS James Cook JC125 (JC124, JC126) |
| 2202956 | CTD or STD cast | 2015-08-26 23:32:10 | 48.49106 N, 9.67511 W | RRS James Cook JC125 (JC124, JC126) |
| 2202981 | CTD or STD cast | 2015-09-06 02:27:13 | 48.65368 N, 10.03353 W | RRS James Cook JC125 (JC124, JC126) |
| 2202993 | CTD or STD cast | 2015-09-06 12:37:15 | 48.48615 N, 10.04908 W | RRS James Cook JC125 (JC124, JC126) |
| 2026993 | Bathymetry | 2018-06-23 23:02:00 | 47.4704 N, 10.586 W | RRS James Cook JC166 (JC167) |
| 2027007 | Bathymetry | 2018-06-24 19:43:00 | 48.2761 N, 9.8577 W | RRS James Cook JC166 (JC167) |
| 2205929 | Hydrography time series at depth | 2019-07-08 06:25:09 | 48.62615 N, 10.00373 W | RRS Discovery DY103 |
| 2222318 | Currents -subsurface Eulerian | 2019-07-08 06:55:00 | 48.62615 N, 10.00373 W | RRS Discovery DY103 |
| 2222306 | Currents -subsurface Eulerian | 2019-07-08 07:00:00 | 48.62615 N, 10.00373 W | RRS Discovery DY103 |
| 2205917 | Hydrography time series at depth | 2019-07-08 07:12:21 | 48.62615 N, 10.00373 W | RRS Discovery DY103 |
| 2222343 | Currents -subsurface Eulerian | 2020-11-13 12:18:00 | 48.626 N, 10.004 W | RRS Discovery DY116 |
| 2222331 | Currents -subsurface Eulerian | 2020-11-13 12:30:00 | 48.626 N, 10.004 W | RRS Discovery DY116 |
| 2205930 | Hydrography time series at depth | 2020-11-13 13:00:01 | 48.3756 N, 10.024 W | RRS Discovery DY116 |
| 2205942 | Hydrography time series at depth | 2020-11-13 13:00:01 | 48.3756 N, 10.024 W | RRS Discovery DY116 |
| 2222367 | Currents -subsurface Eulerian | 2021-03-29 12:09:02 | 48.626 N, 9.996 W | RRS Discovery DY130 |
| 2206761 | Hydrography time series at depth | 2021-03-29 12:10:33 | 48.626 N, 9.996 W | RRS Discovery DY130 |
| 2206773 | Hydrography time series at depth | 2021-03-29 12:13:06 | 48.626 N, 9.996 W | RRS Discovery DY130 |
| 2222355 | Currents -subsurface Eulerian | 2021-03-29 12:24:51 | 48.626 N, 9.996 W | RRS Discovery DY130 |
| 2222379 | Currents -subsurface Eulerian | 2022-01-01 00:25:32 | 48.626 N, 9.996 W | RRS Discovery DY130 |
| 2225469 | Bathymetry | 2022-07-10 00:00:00 | 47.8623 N, 10.8343 W | RRS Discovery DY152 |
| 2225494 | Bathymetry | 2022-08-06 00:00:00 | 48.1325 N, 10.6492 W | RRS James Cook JC237 |
| 2202483 | CTD or STD cast | 2022-08-08 01:20:25 | 47.89354 N, 10.17301 W | RRS James Cook JC237 |
| 2202495 | CTD or STD cast | 2022-08-09 16:07:10 | 48.25988 N, 9.67387 W | RRS James Cook JC237 |
| 2202502 | CTD or STD cast | 2022-08-11 14:57:43 | 48.68134 N, 10.05642 W | RRS James Cook JC237 |
| 2202514 | CTD or STD cast | 2022-08-12 10:37:52 | 48.6533 N, 10.03587 W | RRS James Cook JC237 |
| 2202526 | CTD or STD cast | 2022-08-15 09:51:34 | 48.75935 N, 10.4597 W | RRS James Cook JC237 |
| 2202538 | CTD or STD cast | 2022-08-19 06:12:55 | 48.39767 N, 9.83574 W | RRS James Cook JC237 |
| 2202551 | CTD or STD cast | 2022-08-19 07:32:08 | 48.3976 N, 9.83558 W | RRS James Cook JC237 |
| 2202563 | CTD or STD cast | 2022-08-19 08:45:47 | 48.3977 N, 9.83563 W | RRS James Cook JC237 |
| 2202575 | CTD or STD cast | 2022-08-19 10:03:47 | 48.39771 N, 9.83557 W | RRS James Cook JC237 |
| 2202587 | CTD or STD cast | 2022-08-19 11:32:18 | 48.39793 N, 9.83535 W | RRS James Cook JC237 |
| 2202599 | CTD or STD cast | 2022-08-19 13:46:18 | 48.398 N, 9.83528 W | RRS James Cook JC237 |
| 2202606 | CTD or STD cast | 2022-08-19 15:41:20 | 48.39802 N, 9.83522 W | RRS James Cook JC237 |
| 2202618 | CTD or STD cast | 2022-08-19 17:15:07 | 48.39802 N, 9.83522 W | RRS James Cook JC237 |
| 2202631 | CTD or STD cast | 2022-08-21 13:43:33 | 48.52944 N, 9.93624 W | RRS James Cook JC237 |
| 2202643 | CTD or STD cast | 2022-08-21 18:33:08 | 48.6527 N, 10.03528 W | RRS James Cook JC237 |
| 2202655 | CTD or STD cast | 2022-08-21 20:59:11 | 48.73153 N, 10.09842 W | RRS James Cook JC237 |
| 2202667 | CTD or STD cast | 2022-08-22 18:40:04 | 48.41286 N, 9.83279 W | RRS James Cook JC237 |
| 2202679 | CTD or STD cast | 2022-08-23 13:46:46 | 48.57121 N, 9.93517 W | RRS James Cook JC237 |
| 2202692 | CTD or STD cast | 2022-08-31 10:55:23 | 48.65286 N, 10.03526 W | RRS James Cook JC237 |
| 2202711 | CTD or STD cast | 2022-09-01 15:18:27 | 48.31993 N, 9.79096 W | RRS James Cook JC237 |
| 2243704 | Water sample data | 2023-05-07 11:43:02 | 48.6033 N, 9.9683 W | RRS James Cook JC247 |
| 2242910 | Bathymetry | 2023-06-18 00:00:00 | 48.02085 N, 11.15677 W | RRS Discovery DY166 |
| 2308640 | Water sample data | 2025-05-31 19:57:00 | 48.404 N, 9.695 W | RRS James Cook JC278 |
| 2308836 | Water sample data | 2025-05-31 19:57:00 | 48.404 N, 9.695 W | RRS James Cook JC278 |
| 2309089 | Water sample data | 2025-05-31 19:57:00 | 48.404 N, 9.695 W | RRS James Cook JC278 |
| 2308652 | Water sample data | 2025-06-01 05:56:36 | 48.4385 N, 9.74433 W | RRS James Cook JC278 |
| 2308848 | Water sample data | 2025-06-01 05:56:36 | 48.4385 N, 9.74433 W | RRS James Cook JC278 |
| 2309090 | Water sample data | 2025-06-01 05:56:36 | 48.4385 N, 9.74433 W | RRS James Cook JC278 |
| 2308664 | Water sample data | 2025-06-02 05:53:35 | 48.511 N, 9.93133 W | RRS James Cook JC278 |
| 2308861 | Water sample data | 2025-06-02 05:53:35 | 48.511 N, 9.93133 W | RRS James Cook JC278 |
| 2309108 | Water sample data | 2025-06-02 05:53:35 | 48.511 N, 9.93133 W | RRS James Cook JC278 |
