Metadata Report for BODC Series Reference Number 1174821
Metadata Summary
Problem Reports
Data Access Policy
Narrative Documents
Project Information
Data Activity or Cruise Information
Fixed Station Information
BODC Quality Flags
SeaDataNet Quality Flags
Metadata Summary
Data Description |
|||||||||||||||||||||||||||||||||||||||||||||||||||||||||||||||||||||||||||||||||||||||||||||||||||||||||||||||||
|
|||||||||||||||||||||||||||||||||||||||||||||||||||||||||||||||||||||||||||||||||||||||||||||||||||||||||||||||||
Data Identifiers |
|||||||||||||||||||||||||||||||||||||||||||||||||||||||||||||||||||||||||||||||||||||||||||||||||||||||||||||||||
|
|||||||||||||||||||||||||||||||||||||||||||||||||||||||||||||||||||||||||||||||||||||||||||||||||||||||||||||||||
Time Co-ordinates(UT) |
|||||||||||||||||||||||||||||||||||||||||||||||||||||||||||||||||||||||||||||||||||||||||||||||||||||||||||||||||
|
|||||||||||||||||||||||||||||||||||||||||||||||||||||||||||||||||||||||||||||||||||||||||||||||||||||||||||||||||
Spatial Co-ordinates | |||||||||||||||||||||||||||||||||||||||||||||||||||||||||||||||||||||||||||||||||||||||||||||||||||||||||||||||||
|
|||||||||||||||||||||||||||||||||||||||||||||||||||||||||||||||||||||||||||||||||||||||||||||||||||||||||||||||||
Parameters |
|||||||||||||||||||||||||||||||||||||||||||||||||||||||||||||||||||||||||||||||||||||||||||||||||||||||||||||||||
|
|||||||||||||||||||||||||||||||||||||||||||||||||||||||||||||||||||||||||||||||||||||||||||||||||||||||||||||||||
|
|||||||||||||||||||||||||||||||||||||||||||||||||||||||||||||||||||||||||||||||||||||||||||||||||||||||||||||||||
Problem Reports
No Problem Report Found in the Database
Data Access Policy
Open Data
These data have no specific confidentiality restrictions for users. However, users must acknowledge data sources as it is not ethical to publish data without proper attribution. Any publication or other output resulting from usage of the data should include an acknowledgment.
If the Information Provider does not provide a specific attribution statement, or if you are using Information from several Information Providers and multiple attributions are not practical in your product or application, you may consider using the following:
"Contains public sector information licensed under the Open Government Licence v1.0."
Narrative Documents
Satlantic OCR 500 series Multispectral Radiometer
The OCR-507 Multispectral Radiometer is a member of Satlantic's line of micro-sensor instruments. The OCR-507 is a complete stand-alone, fully digital optical sensor package capable of generating spectral records of light collected in an ocean environment. The instrument comprises data logging and processing software and is available in two configurations, radiance and irradiance for in-water and in-air applications. The instrument can also be configured as a coupled irradiance and radiance radiometer. Up to seven customer defined discrete optical wavelengths can be utilized with the OCR-507, including standard wavelengths of 400 to 865 nm, or UV wavelengths of 305, 325, 340 and 380 nm.
Two standard, non-isolated, telemetry (data) interfaces are provided with the instrument, each using a different transmission medium. The RS-232 interface provides transmit and receive capabilities whilst the RS-422 interface is for transmittance only. A non-isolated RS-485 interface is also provided for operating the instrument if used in a SatNet networked environment as part of a larger system.
The OCR-507 combines a fully characterized cosine response with custom low fluorescence filters and a sampling rate of 7 to 24 Hz. The instrument is also compatible with Bioshutter anti-biofouling solution.
Specifications for Downwelling Irradiance Configuration
| OCR-504 | OCR-507 | |
|---|---|---|
| Field of view | in-air or in-water cosine response (spectrally corrected) | in-air or in-water cosine response (spectrally corrected) |
| Collector area | 86 mm2 | 86 mm2 |
| Detectors | custom 17 mm2 silicon photodiodes | custom 17 mm2 silicon photodiodes |
| Bandwidth range | 400-865 nm (standard - custom also available) | 400-865 nm (standard - custom also available) |
| Number of channels | 4 | 7 |
| Spectral bandwidth | 10 nm | 20 nm |
| Filter type | Ion Assisted Deposition (IAD); custom low-fluorescence interference | Ion Assisted Deposition (IAD); custom low-fluorescence interference |
| Cosine response | 3% from 0 - 60°; 10% from 60 - 85° | 3% from 0 - 60°; 10% from 60 - 85° |
| Out of band rejection | 10-6 | 10-6 |
| Typical NEI | 2.5 X10⁻³ µWcm-2nm-1 | 2.5 X10⁻³ µWcm-2nm-1 |
| Typical saturation | 300 µWcm-2nm-1 | 300 µWcm-2nm-1 |
| Depth rating | 350 m | 350 m |
| System time constant | 0.011 seconds | 0.011 seconds |
| Sample rate | 7 Hz (24 Hz optional) | 7 Hz (24 Hz optional) |
Specifications for Upwelling Radiance Configuration
| Field of view | 10° in water (Half angle, half maximum); 14° in air (Half angle, half-maximum) | 10° in water (Half angle, half maximum); 14° in air (Half angle, half-maximum) |
| Entrance aperture | 9.5 mm diameter | 9.5 mm diameter |
| Detectors | Custom 13 mm2 Silicon photodiodes | Custom 13 mm2 Silicon photodiodes |
| Bandwidth range | 400-865 nm (standard - custom also available) | 400-865 nm (standard - custom also available) |
| Number of channels | 4 | 7 |
| Spectral bandwidth | 10 nm | 20 nm |
| Filter type | Ion Assisted Deposition (IAD); custom low-fluorescence interference | Ion Assisted Deposition (IAD); custom low-fluorescence interference |
| Out of band rejection | 10-6 | 10-6 |
| Out of field rejection | 5x10⁻⁴ >1.5 FOV | 5x10⁻⁴ >1.5 FOV |
| Typical saturation | 5 µWcm-2nm-1sr-1 | 5 µWcm-2nm-1sr-1 |
| Depth rating | 350 m | 350 m |
| System time constant | 0.011 seconds | 0.011 seconds |
| Sample rate | 7 Hz (24 Hz optional) | 7 Hz (24 Hz optional) |
Further details can be found in the manufacturer's specification sheet.
CD173 Satlantic Optical data processing undertaken by BODC
Data were received by BODC as raw data files as well as ASCII and Matlab files for all 4 levels of ProSoft processing. These have all been archived and are available in the originators format on request. BODC have processed the level 3 ASCII files by reformatting to the internal format using established procedures. These data were chosen as they are the most processed data which do not include derived parameters. The data for each deployment were supplied in one file but grouped by parameter. The time channel assigned for each cycle to each group of parameters differed slightly (sub second differences). In order to be consistent it was decided that all data were be assigned the time channel from the Ed parameters. A check was built in to the reformatting software to ensure that the difference between the times used and the times supplied for the other parameter groups was always less than a second. The following table details mapping of variables to BODC parameter codes.
| Originator's Variable | Units | BODC Parameter Code | Description | Units | Comments |
|---|---|---|---|---|---|
| Depth | Metres | ADEPZZ01 | Depth below surface of the water body | Metres | |
| Ed 412.1 nm | µW cm-2 nm-1 | RXUD412E | Downwelling vector irradiance as energy (412 nm wavelength) in the water body by cosine-collector radiometer | W m-2 nm-1 | Conversion of /100 applied |
| Ed 442.5 nm | µW cm-2 nm-1 | RXUD443E | Downwelling vector irradiance as energy (443 nm wavelength) in the water body by cosine-collector radiometer | W m-2 nm-1 | Conversion of /100 applied |
| Ed 490.8 nm | µW cm-2 nm-1 | RXUD490E | Downwelling vector irradiance as energy (490 nm wavelength) in the water body by cosine-collector radiometer | W m-2 nm-1 | Conversion of /100 applied |
| Ed 510.7 nm | µW cm-2 nm-1 | RXUD510E | Downwelling vector irradiance as energy (510 nm wavelength) in the water body by cosine-collector radiometer | W m-2 nm-1 | Conversion of /100 applied |
| Ed 560.1 nm | µW cm-2 nm-1 | RXUD560E | Downwelling vector irradiance as energy (560 nm wavelength) in the water body by cosine-collector radiometer | W m-2 nm-1 | Conversion of /100 applied |
| Ed 664.2 nm | µW cm-2 nm-1 | RXUD665E | Downwelling vector irradiance as energy (665 nm wavelength) in the water body by cosine-collector radiometer | W m-2 nm-1 | Conversion of /100 applied |
| Ed 705.7 nm | µW cm-2 nm-1 | RXUD705E | Downwelling vector irradiance as energy (705 nm wavelength) in the water body by cosine-collector radiometer | W m-2 nm-1 | Conversion of /100 applied |
| Lu 411.5 nm | µW cm-2 nm-1 sr -1 | RXUU412L | Upwelling radiance as energy (412 nm wavelength) in the water body by radiance sensor | W m-2 nm-1 sr-1 | Conversion of /100 applied |
| Lu 442.4 nm | µW cm-2 nm-1 sr -1 | RXUU443L | Upwelling radiance as energy (443 nm wavelength) in the water body by radiance sensor | W m-2 nm-1 sr-1 | Conversion of /100 applied |
| Lu 490.6 nm | µW cm-2 nm-1 sr -1 | RXUU490L | Upwelling radiance as energy (490 nm wavelength) in the water body by radiance sensor | W m-2 nm-1 sr-1 | Conversion of /100 applied |
| Lu 510.5 nm | µW cm-2 nm-1 sr -1 | RXUU510L | Upwelling radiance as energy (510 nm wavelength) in the water body by radiance sensor | W m-2 nm-1 sr-1 | Conversion of /100 applied |
| Lu 560.3 nm | µW cm-2 nm-1 sr -1 | RXUU560L | Upwelling radiance as energy (560 nm wavelength) in the water body by radiance sensor | W m-2 nm-1 sr-1 | Conversion of /100 applied |
| Lu 664.8 nm | µW cm-2 nm-1 sr -1 | RXUU665L | Upwelling radiance as energy (665 nm wavelength) in the water body by radiance sensor | W m-2 nm-1 sr-1 | Conversion of /100 applied |
| Lu 706.0 nm | µW cm-2 nm-1 sr -1 | RXUU705L | Upwelling radiance as energy (705 nm wavelength) in the water body by radiance sensor | W m-2 nm-1 sr-1 | Conversion of /100 applied |
| Es 412.2 nm | µW cm-2 nm-1 | RXSD412E | Downwelling vector irradiance as energy (412 nm wavelength) in the atmosphere by cosine-collector radiometer | W m-2 nm-1 | Conversion of /100 applied |
| Es 442.4 nm | µW cm-2 nm-1 | RXSD443E | Downwelling vector irradiance as energy (443 nm wavelength) in the atmosphere by cosine-collector radiometer | W m-2 nm-1 | Conversion of /100 applied |
| Es 489.3 nm | µW cm-2 nm-1 | RXSD490E | Downwelling vector irradiance as energy (490 nm wavelength) in the atmosphere by cosine-collector radiometer | W m-2 nm-1 | Conversion of /100 applied |
| Es 510.7 nm | µW cm-2 nm-1 | RXSD510E | Downwelling vector irradiance as energy (510 nm wavelength) in the atmosphere by cosine-collector radiometer | W m-2 nm-1 | Conversion of /100 applied |
| Es 560.0 nm | µW cm-2 nm-1 | RXSD560E | Downwelling vector irradiance as energy (560 nm wavelength) in the atmosphere by cosine-collector radiometer | W m-2 nm-1 | Conversion of /100 applied |
| Es 664.8 nm | µW cm-2 nm-1 | RXSD665E | Downwelling vector irradiance as energy (665 nm wavelength) in the atmosphere by cosine-collector radiometer | W m-2 nm-1 | Conversion of /100 applied |
| Es 704.5 nm | µW cm-2 nm-1 | RXSD705E | Downwelling vector irradiance as energy (705 nm wavelength) in the atmosphere by cosine-collector radiometer | W m-2 nm-1 | Conversion of /100 applied |
| X | Degrees | PTCHEI01 | Orientation (pitch) of measurement platform by inclinometer | Degrees | |
| Y | Degrees | ROLLEI01 | Orientation (roll angle) of measurement platform by inclinometer | Degrees |
The originator noted that the temperature sensor wasn't working so temperature parameters have not been processed by BODC.
The reformatted data were visualised using BODC in-house software. Suspect data were marked by adding an appropriate quality control flag, and missing data marked by both setting the data to an appropriate absent data value and setting the quality control flag.
CD173 Satlantic Optics data originators processing
Sampling strategy
The free-fall Satlantic Microspectral Muiltprofiler was deployed 59 times during RRS Charles Darwin cruise CD173. The cruise took place between 15 July and 06 August 2005 in the Celtic Sea.
Setup of the instruments
The Satlantic optical profiler was made up of several sensors:
| Sensor | Serial number |
|---|---|
| MicroProfiler body | 047 |
| Deck Reference sensor (OCR-507) | 100 |
| Upwelling radiance sensor (OCR-507) | 054 |
| Downwelling irradiance sensor (OCR-507) | 099 |
| Deck Unit | 058 |
Processing stages
Data were processed by the originator with Satlantic ProSoft software using standard procedures. ProSoft processing is segmented into 4 main levels (extract from the ProSoft user manual):
| Processing stage | Description |
|---|---|
| Level 1 | Raw binary data file from an instrument. File nametag is raw. Level 1a - Binary data is extracted from raw data under the control of the instrument (calibration and/or telemetry definition) files. Extracted information is grouped along with its calibration information and is placed into Level 1a hdf files. File nametag is _L1a. |
| Level 1b | Level1b data is calibrated. No data editing is applied. Shutter darks, if present, are not applied. File nametag is _L1b. |
| Level 2 | Includes Level 1b data, which is further modified per request (i.e. depending on settings of processing parameters and on instrument context). File nametag is _L2. 1. Shutter dark correction is applied; reference and dark data deglitching is applied. 2.Profiler's data is tilt edited. |
| Level 2s | Level 2 data is interpolated onto a common co-ordinates vector, which is either depth (Profiler) or time (Reference only or Sas). File nametag is _L2s. |
| Level 3a | Includes averaging of Level 2s data as defined by the processing parameters. File nametag is _L3a. |
| Level 4 | Includes higher level data products (users choice) calculated from level 3a data. This includes products such as normalized water leaving radiances, reflectance profiles, photosynthetically available radiation etc. File nametag is _L4. |
Originators quality notes
The originator has reported that the temperature sensor wasn't working, hence the water properties have been excluded from the latest reprocessing protocol.
Originators series for cast OB9 did not contain upwelling radiance (Lu) parameters whilst the data from U2Aug3 did not include downwelling irradiance (Ed) parameters.
General Data Screening carried out by BODC
BODC screen both the series header qualifying information and the parameter values in the data cycles themselves.
Header information is inspected for:
- Irregularities such as unfeasible values
- Inconsistencies between related information, for example:
- Times for instrument deployment and for start/end of data series
- Length of record and the number of data cycles/cycle interval
- Parameters expected and the parameters actually present in the data cycles
- Originator's comments on meter/mooring performance and data quality
Documents are written by BODC highlighting irregularities which cannot be resolved.
Data cycles are inspected using time or depth series plots of all parameters. Currents are additionally inspected using vector scatter plots and time series plots of North and East velocity components. These presentations undergo intrinsic and extrinsic screening to detect infeasible values within the data cycles themselves and inconsistencies as seen when comparing characteristics of adjacent data sets displaced with respect to depth, position or time. Values suspected of being of non-oceanographic origin may be tagged with the BODC flag denoting suspect value; the data values will not be altered.
The following types of irregularity, each relying on visual detection in the plot, are amongst those which may be flagged as suspect:
- Spurious data at the start or end of the record.
- Obvious spikes occurring in periods free from meteorological disturbance.
- A sequence of constant values in consecutive data cycles.
If a large percentage of the data is affected by irregularities then a Problem Report will be written rather than flagging the individual suspect values. Problem Reports are also used to highlight irregularities seen in the graphical data presentations.
Inconsistencies between the characteristics of the data set and those of its neighbours are sought and, where necessary, documented. This covers inconsistencies such as the following:
- Maximum and minimum values of parameters (spikes excluded).
- The occurrence of meteorological events.
This intrinsic and extrinsic screening of the parameter values seeks to confirm the qualifying information and the source laboratory's comments on the series. In screening and collating information, every care is taken to ensure that errors of BODC making are not introduced.
Project Information
Physical-Biological Control of New Production within the Seasonal Thermocline
This project was a NERC responsive-mode project which was co-funded by the Defence Science and Technology Laboratory and ran from 2003 to 2006. The key institutes and scientists involved were:
| Institute | Scientific personnel |
|---|---|
| Proudman Oceanographic Laboratory (POL) | Jonathan Sharples |
| National Oceanography Centre, Southampton (NOCS) | Patrick Holligan Mark Moore |
| University of Wales, Bangor (UWB) | John Simpson Tom Rippeth |
Research Aim
The main aim of this research was to investigate the generation and dissipation of turbulence in the thermocline, and to quantify how the resulting mixing (supplying nutrients and controlling the light experienced by the algae) affected the growth of phytoplankton within the sub-surface chlorophyll maximum (SCM).
Research Objectives
The objective of the research was to test the general hypothesis that, in seasonally-stratified shelf waters, temporal and spatial variability of the rate of 'new' production is determined by the degree of coupling between physical and biological processes within the seasonal thermocline. In particular it has been suggested that physiological adaptation by phytoplankton making up the subsurface chlorophyll maximum drives a biological pump for extracting nitrate from the bottom mixed layer that is sensitive to internal mixing and to external climatological factors.
Research Approach
The sampling and experimental strategy was based on established methods for obtaining compatible, high-resolution vertical profiles (alternate CTD and FLY) and sections (SeaSoar) of physical, chemical, and biological parameters, allowing quantification of vertical fluxes and primary production on tidal and internal wave time scales. The cruise schedule (with associated mooring deployments) for the project is below.
Cruise Schedule
| Cruise ID | Ship | Sampling Region | Cruise Dates | Main measurements |
|---|---|---|---|---|
| JR98 | RRS James Clark Ross | St Georges Channel, Celtic Sea and shelf edge | 25/07/03 - 14/08/03 | CTD casts, SeaSoar transects (CTD, chlorophyll, fluorescence), FRRF, ship ADCP, primary productivity, nutrients, trace metals, phytoplankton uptake rates, algal photophysiology, oxygen concentration, particle size, optics, mooring deployments |
| PD32_03 | RV Prince Madog | Celtic Sea and shelf edge | 27/07/03 - 13/08/03 | 5 x FLY 25 hour tidal cycle stations, particle size analysis, particle settling velocity, CTD casts, mooring deployments |
| CD173 | RRS Charles Darwin | Celtic Sea and shelf edge | 15/07/05 - 06/08/05 | CTD casts, chlorophyll, oxygen concentration, FLY profiles, SeaSoar tows (CTD, chlorophyll, FRRF), phytoplankton pigments, nutrients, primary productivity, phytoplankton uptake rates, FRRF profiles, optics, particle size analysis, mooring deployments |
| PD27_05 | RV Prince Madog | Celtic Sea and shelf edge | 22/07/05 - 06/08/05 | FLY profiles, mooring deployments |
Moorings
| Station ID | Latitude | Longitude | Depth (m) | Mooring | Deployment date | Recovery date | Deployment vessel |
|---|---|---|---|---|---|---|---|
| CS3 | 51.471 | -6.428 | 95 | Seabed frame 300 kHz ADCP | 01/08/03 | 11/08/03 | RV Prince Madog |
| CS3 | 51.471 | -6.428 | 95 | Seabed frame 1200 kHz ADCP | 01/08/03 | 11/08/03 | RV Prince Madog |
| CS3 | 51.474 | -6.437 | 95 | Mid-water subsurface 300 kHz ADCP | 01/08/03 | 11/08/03 | RV Prince Madog |
| CS3 | 51.469 | -6.437 | 95 | Thermistor chain from 5 - 45 m depth | 01/08/03 | 11/08/03 | RV Prince Madog |
| ACW | 51.266 | -5.741 | 85 | Seabed frame 300 kHz ADCP | 06/08/03 | 08/08/03 | RV Prince Madog |
| CS2 | 48.532 | -9.463 | 200 | Surface temperature toroid | 28/07/03 | 12/08/03 | RRS James Clark Ross |
| CS2 | 48.532 | -9.463 | 200 | Thermistor chain throughout water column | 28/07/03 | 12/08/03 | RRS James Clark Ross |
| CS2 | 48.532 | -9.463 | 200 | Sub-suface 600 kHz ADCP (90 m) | 28/07/03 | 12/08/03 | RRS James Clark Ross |
| CS2 | 48.532 | -9.463 | 200 | Aanderaa RCM7 current meter/CTD (12 mab)* | 28/07/03 | 12/08/03 | RRS James Clark Ross |
| CS2 | 48.532 | -9.463 | 200 | Seabed frame 150 kHz ADCP | 28/07/03 | 12/08/03 | RRS James Clark Ross |
| CS2 | 48.532 | -9.463 | 200 | Seabed frame 300 kHz ADCP | 28/07/03 | 12/08/03 | RRS James Clark Ross |
| U2 | 49.236 | -6.166 | 121 | Sub-suface 300 kHz ADCP (5 mab)* | 15/07/05 | 03/08/05 | RRS Charles Darwin |
| U2 | 49.233 | -6.167 | 120 | Thermistor chain throughout water column | 19/07/05 | Mooring lost | RRS Charles Darwin |
| CS2 | 48.571 | -9.509 | 200 | Thermistor chain throughout water column | 17/07/05 | 24/07/05 | RRS Charles Darwin |
| CS2 | 48.573 | -9.51 | 194 | Sub-suface 300 kHz ADCP (100 m) | 17/07/05 | 24/07/05 | RRS Charles Darwin |
| CS2 | 48.572 | -9.508 | 196 | Seabed frame 300 kHz ADCP | 17/07/05 | 24/07/05 | RRS Charles Darwin |
| CS2 | 48.571 | -9.507 | 202 | Seabed frame 150 kHz ADCP | 17/07/05 | 24/07/05 | RRS Charles Darwin |
| Bank 1 | 49.938 | -7.792 | 118 | Thermistor chain throughout water column | 26/07/05 | Mooring lost | RRS Charles Darwin |
| Bank 1 | 49.936 | -7.792 | 118 | Seabed frame 300 kHz ADCP | 27/07/05 | Recovered by trawler 29/07/05 | RRS Charles Darwin |
| Bank 2 | 49.895 | -7.872 | 114 | Thermistor chain throughout water column | 20/07/05 | 04/08/05 | RRS Charles Darwin |
| Bank 2 | 49.876 | -7.897 | 112 | Sub-surface 600 kHz ADCP (56 m) | 26/07/05 | 04/08/05 | RRS Charles Darwin |
| Bank 2 | 49.894 | -7.873 | 110 | Seabed frame 300 kHz ADCP | 26/07/05 | 04/08/05 | RRS Charles Darwin |
| Bank 3 | 49.851 | -7.952 | 78 | Thermistor chain throughout water column | 26/07/05 | 03/08/05 | RV Prince Madog |
| Bank 3 | 49.854 | -7.948 | 78 | Seabed frame 300 kHz ADCP | 26/07/05 | Mooring lost | RV Prince Madog |
* = metres above seabed
Project Outcomes
The main products of the research were:
- The first large scale interdisciplinary study of the dynamic processes that determine the properties of the SCM in NW European shelf waters.
- Substantive advances in quantifying internal mixing in NW European shelf seas, and in understanding how primary production is controlled by this small-scale turbulence.
- New parameterisations for internal vertical mixing, and the response of primary production, for use in coupled numerical models.
- Improved capability for estimating primary productivity in stratified waters by satellite remote sensing (ocean colour, sea surface temperature, wind mixing etc.)
- An overall development of our understanding of the dynamics of ecosystems that support important fisheries, and of our abilities in predicting ecological and biogeochemical responses to variations and changes in the climate of the marine environment.
Data Activity or Cruise Information
Cruise
| Cruise Name | CD173 |
| Departure Date | 2005-07-15 |
| Arrival Date | 2005-08-06 |
| Principal Scientist(s) | Jonathan Sharples (Proudman Oceanographic Laboratory) |
| Ship | RRS Charles Darwin |
Complete Cruise Metadata Report is available here
Fixed Station Information
Fixed Station Information
| Station Name | CS2 |
| Category | Offshore area |
| Latitude | 48° 33.23' N |
| Longitude | 9° 29.17' W |
| Water depth below MSL | 200.0 m |
Physical-Biological Control of New Production within the Seasonal Thermocline: Fixed Station CS2
This station is positioned close to the edge of the north-west European shelf edge (see figure below). It was first visited by the RRS James Clark Ross (JR98) in 2003 and then by the RRS Charles Darwin (CD173) in 2005. This station was then re-visited in 2014 during the RRS Discovery cruise DY018, as part of work package I of the Shelf Seas Biogeochemistry project. The station has a mean water depth 201 m at the following co-ordinates:
| Box Corner | Latitude | Longitude |
|---|---|---|
| North-west corner | 48.5838° | -9.5497° |
| South-east corner | 48.4998° | -9.4364° |
The position of this station relative to the other sites visited during JR98, CD173 and DY018 can be seen from the figure below.
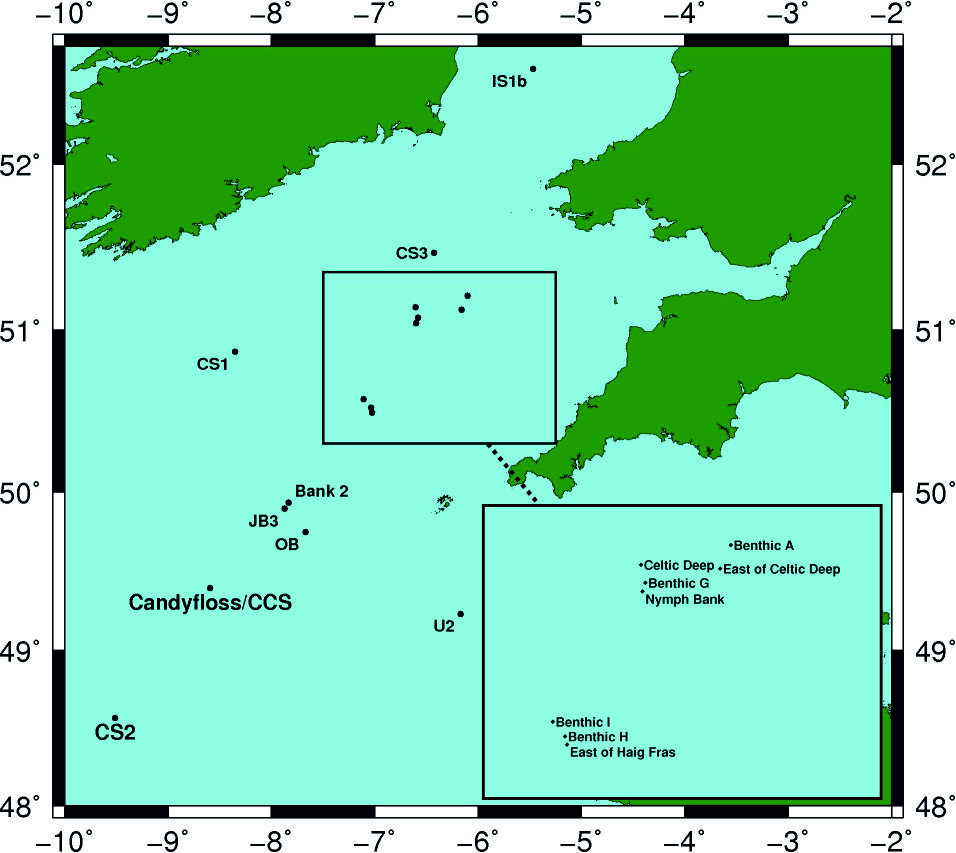
The following table describes which sites were visited during which cruises
| JB3 | Bank 2 | OB | IS1b | CS1 | CS2 | CS3 | U2 | Candyfloss/CCS | Benthic A | Benthic H | Benthic I | Benthic G | East of Haig Fras | Nymph Bank | Celtic Deep | East of Celtic Deep | |
|---|---|---|---|---|---|---|---|---|---|---|---|---|---|---|---|---|---|
| JR98 | - | - | - | X | X | X | X | X | - | - | - | - | - | - | - | - | - |
| CD173 | X | X | X | - | - | - | - | X | - | - | - | - | - | - | - | - | - |
| DY018 | - | - | - | - | - | X | - | - | X | X | X | X | X | X | X | X | X |
The deployment and sampling history, to date, for this station is summarised below:
Sampling History
| JR98 | CD173 | DY018 | |
|---|---|---|---|
| CTD casts | 30 | 15 | 15 |
| Free-fall light yo-yo profiles | - | 153 | - |
| Profiling radiometer | - | 16 | - |
| Zooplankton net hauls | - | - | 32 |
| Box cores | - | - | 5 |
| Marine snow catcher deployments | - | - | 17 |
| Stand Alone Pump Systems (SAPS) | - | - | 2 |
Mooring deployments
| Latitude | Longitude | Water depth (m) | Moored instrument | Deployment date | Recovery date | Deployment cruise | Recovery cruise | Comments |
|---|---|---|---|---|---|---|---|---|
| 48.532° | -9.463° | 200 | Surface temperature toroid | 2003-07-28 | 2003-08-12 | JR98 | JR98 | - |
| 48.532° | -9.463° | 200 | Thermistor chain throughout water column | 2003-07-28 | 2003-08-12 | JR98 | JR98 | - |
| 48.532° | -9.463° | 200 | Sub-surface 600 kHz ADCP | 2003-07-28 | 2003-08-12 | JR98 | JR98 | - |
| 48.532° | -9.463° | 200 | Aanderaa RCM7 current meter/CTD | 2003-07-28 | 2003-08-12 | JR98 | JR98 | - |
| 48.532° | -9.463° | 200 | Seabed frame 150 kHz ADCP | 2003-07-28 | 2003-08-12 | JR98 | JR98 | - |
| 48.532° | -9.463° | 200 | Seabed frame 300 kHz ADCP | 2003-07-28 | 2003-08-12 | JR98 | JR98 | - |
| 48.571° | -9.509° | 200 | Thermistor chain throughout water column | 2005-07-17 | 2005-07-24 | CD173 | CD173 | - |
| 48.573° | -9.51° | 194 | Sub-surface 300 kHz ADCP | 2005-07-17 | 2005-07-24 | CD173 | CD173 | - |
| 48.572° | -9.508° | 196 | Seabed frame 300 kHz ADCP | 2005-07-17 | 2005-07-24 | CD173 | CD173 | - |
| 48.571° | -9.507° | 202 | Seabed frame 150 kHz ADCP | 2005-07-17 | 2005-07-24 | CD173 | CD173 | - |
| - | - | 205 | T-F chain | 2014-11-17 09:03 UTC | 2014-11-19 17:07 UTC | DY018 | DY018 | - |
Related Fixed Station activities are detailed in Appendix 1
BODC Quality Control Flags
The following single character qualifying flags may be associated with one or more individual parameters with a data cycle:
| Flag | Description |
|---|---|
| Blank | Unqualified |
| < | Below detection limit |
| > | In excess of quoted value |
| A | Taxonomic flag for affinis (aff.) |
| B | Beginning of CTD Down/Up Cast |
| C | Taxonomic flag for confer (cf.) |
| D | Thermometric depth |
| E | End of CTD Down/Up Cast |
| G | Non-taxonomic biological characteristic uncertainty |
| H | Extrapolated value |
| I | Taxonomic flag for single species (sp.) |
| K | Improbable value - unknown quality control source |
| L | Improbable value - originator's quality control |
| M | Improbable value - BODC quality control |
| N | Null value |
| O | Improbable value - user quality control |
| P | Trace/calm |
| Q | Indeterminate |
| R | Replacement value |
| S | Estimated value |
| T | Interpolated value |
| U | Uncalibrated |
| W | Control value |
| X | Excessive difference |
SeaDataNet Quality Control Flags
The following single character qualifying flags may be associated with one or more individual parameters with a data cycle:
| Flag | Description |
|---|---|
| 0 | no quality control |
| 1 | good value |
| 2 | probably good value |
| 3 | probably bad value |
| 4 | bad value |
| 5 | changed value |
| 6 | value below detection |
| 7 | value in excess |
| 8 | interpolated value |
| 9 | missing value |
| A | value phenomenon uncertain |
| B | nominal value |
| Q | value below limit of quantification |
Appendix 1: CS2
Related series for this Fixed Station are presented in the table below. Further information can be found by following the appropriate links.
If you are interested in these series, please be aware we offer a multiple file download service. Should your credentials be insufficient for automatic download, the service also offers a referral to our Enquiries Officer who may be able to negotiate access.
| Series Identifier | Data Category | Start date/time | Start position | Cruise |
|---|---|---|---|---|
| 1106504 | CTD or STD cast | 2003-07-27 21:58:02 | 48.49983 N, 9.54967 W | RRS James Clark Ross JR20030725 (JR98) |
| 1106528 | CTD or STD cast | 2003-07-29 02:56:59 | 48.538 N, 9.46383 W | RRS James Clark Ross JR20030725 (JR98) |
| 1106541 | CTD or STD cast | 2003-07-29 03:58:02 | 48.538 N, 9.46417 W | RRS James Clark Ross JR20030725 (JR98) |
| 1106553 | CTD or STD cast | 2003-07-29 05:20:59 | 48.538 N, 9.46417 W | RRS James Clark Ross JR20030725 (JR98) |
| 1106565 | CTD or STD cast | 2003-07-29 06:01:00 | 48.538 N, 9.464 W | RRS James Clark Ross JR20030725 (JR98) |
| 1106577 | CTD or STD cast | 2003-07-29 06:58:02 | 48.538 N, 9.46417 W | RRS James Clark Ross JR20030725 (JR98) |
| 1106589 | CTD or STD cast | 2003-07-29 08:01:58 | 48.538 N, 9.464 W | RRS James Clark Ross JR20030725 (JR98) |
| 1106590 | CTD or STD cast | 2003-07-29 09:17:00 | 48.538 N, 9.46417 W | RRS James Clark Ross JR20030725 (JR98) |
| 1106608 | CTD or STD cast | 2003-07-29 10:22:57 | 48.538 N, 9.464 W | RRS James Clark Ross JR20030725 (JR98) |
| 1106621 | CTD or STD cast | 2003-07-29 11:15:04 | 48.53783 N, 9.464 W | RRS James Clark Ross JR20030725 (JR98) |
| 1106633 | CTD or STD cast | 2003-07-29 12:28:57 | 48.53783 N, 9.464 W | RRS James Clark Ross JR20030725 (JR98) |
| 1106645 | CTD or STD cast | 2003-07-29 13:37:03 | 48.53783 N, 9.464 W | RRS James Clark Ross JR20030725 (JR98) |
| 1106657 | CTD or STD cast | 2003-07-29 14:06:00 | 48.53783 N, 9.464 W | RRS James Clark Ross JR20030725 (JR98) |
| 1106669 | CTD or STD cast | 2003-07-29 15:00:00 | 48.538 N, 9.464 W | RRS James Clark Ross JR20030725 (JR98) |
| 1106670 | CTD or STD cast | 2003-07-29 16:12:00 | 48.538 N, 9.464 W | RRS James Clark Ross JR20030725 (JR98) |
| 1106682 | CTD or STD cast | 2003-07-29 17:00:58 | 48.538 N, 9.46417 W | RRS James Clark Ross JR20030725 (JR98) |
| 1106694 | CTD or STD cast | 2003-07-29 18:00:00 | 48.53783 N, 9.464 W | RRS James Clark Ross JR20030725 (JR98) |
| 1106701 | CTD or STD cast | 2003-07-29 18:58:02 | 48.53783 N, 9.46417 W | RRS James Clark Ross JR20030725 (JR98) |
| 1106713 | CTD or STD cast | 2003-07-29 19:59:57 | 48.53783 N, 9.46417 W | RRS James Clark Ross JR20030725 (JR98) |
| 1106725 | CTD or STD cast | 2003-07-29 20:57:59 | 48.53783 N, 9.464 W | RRS James Clark Ross JR20030725 (JR98) |
| 1106737 | CTD or STD cast | 2003-07-29 21:57:01 | 48.538 N, 9.464 W | RRS James Clark Ross JR20030725 (JR98) |
| 1106749 | CTD or STD cast | 2003-07-29 23:07:00 | 48.538 N, 9.46383 W | RRS James Clark Ross JR20030725 (JR98) |
| 1106750 | CTD or STD cast | 2003-07-29 23:56:59 | 48.53783 N, 9.464 W | RRS James Clark Ross JR20030725 (JR98) |
| 1106762 | CTD or STD cast | 2003-07-30 00:58:02 | 48.53783 N, 9.464 W | RRS James Clark Ross JR20030725 (JR98) |
| 1106774 | CTD or STD cast | 2003-07-30 01:57:04 | 48.53783 N, 9.464 W | RRS James Clark Ross JR20030725 (JR98) |
| 1106786 | CTD or STD cast | 2003-07-30 02:56:59 | 48.53833 N, 9.46317 W | RRS James Clark Ross JR20030725 (JR98) |
| 1106798 | CTD or STD cast | 2003-07-30 03:59:02 | 48.538 N, 9.464 W | RRS James Clark Ross JR20030725 (JR98) |
| 1106805 | CTD or STD cast | 2003-07-30 05:09:01 | 48.538 N, 9.464 W | RRS James Clark Ross JR20030725 (JR98) |
| 1108326 | CTD or STD cast | 2003-08-12 06:46:57 | 48.52383 N, 9.45533 W | RRS James Clark Ross JR20030725 (JR98) |
| 1108338 | CTD or STD cast | 2003-08-12 11:25:00 | 48.52883 N, 9.47533 W | RRS James Clark Ross JR20030725 (JR98) |
| 737376 | CTD or STD cast | 2005-07-17 18:57:00 | 48.575 N, 9.51433 W | RRS Charles Darwin CD173 |
| 737388 | CTD or STD cast | 2005-07-17 21:14:00 | 48.57517 N, 9.515 W | RRS Charles Darwin CD173 |
| 737407 | CTD or STD cast | 2005-07-17 23:07:00 | 48.57617 N, 9.51083 W | RRS Charles Darwin CD173 |
| 737419 | CTD or STD cast | 2005-07-18 00:58:00 | 48.57533 N, 9.50133 W | RRS Charles Darwin CD173 |
| 737420 | CTD or STD cast | 2005-07-18 07:19:00 | 48.568 N, 9.50233 W | RRS Charles Darwin CD173 |
| 1174790 | PAR radiance and irradiance | 2005-07-18 09:32:47 | 48.532 N, 9.463 W | RRS Charles Darwin CD173 |
| 1174808 | PAR radiance and irradiance | 2005-07-18 09:39:45 | 48.532 N, 9.463 W | RRS Charles Darwin CD173 |
| 737432 | CTD or STD cast | 2005-07-18 12:02:00 | 48.56817 N, 9.5115 W | RRS Charles Darwin CD173 |
| 1174833 | PAR radiance and irradiance | 2005-07-18 14:07:22 | 48.532 N, 9.463 W | RRS Charles Darwin CD173 |
| 737444 | CTD or STD cast | 2005-07-18 16:22:00 | 48.5705 N, 9.49217 W | RRS Charles Darwin CD173 |
| 737456 | CTD or STD cast | 2005-07-18 18:39:00 | 48.56867 N, 9.48233 W | RRS Charles Darwin CD173 |
| 737616 | CTD or STD cast | 2005-07-23 03:00:00 | 48.57167 N, 9.48967 W | RRS Charles Darwin CD173 |
| 737628 | CTD or STD cast | 2005-07-23 07:18:00 | 48.57083 N, 9.48733 W | RRS Charles Darwin CD173 |
| 1174845 | PAR radiance and irradiance | 2005-07-23 09:10:37 | 48.532 N, 9.463 W | RRS Charles Darwin CD173 |
| 1174857 | PAR radiance and irradiance | 2005-07-23 09:15:51 | 48.532 N, 9.463 W | RRS Charles Darwin CD173 |
| 1174869 | PAR radiance and irradiance | 2005-07-23 09:22:37 | 48.532 N, 9.463 W | RRS Charles Darwin CD173 |
| 737641 | CTD or STD cast | 2005-07-23 10:32:00 | 48.5785 N, 9.50317 W | RRS Charles Darwin CD173 |
| 737653 | CTD or STD cast | 2005-07-23 15:25:00 | 48.57733 N, 9.48133 W | RRS Charles Darwin CD173 |
| 1174870 | PAR radiance and irradiance | 2005-07-23 17:08:32 | 48.532 N, 9.463 W | RRS Charles Darwin CD173 |
| 1174882 | PAR radiance and irradiance | 2005-07-23 18:40:35 | 48.532 N, 9.463 W | RRS Charles Darwin CD173 |
| 737665 | CTD or STD cast | 2005-07-23 19:59:00 | 48.57617 N, 9.48967 W | RRS Charles Darwin CD173 |
| 737677 | CTD or STD cast | 2005-07-23 23:07:00 | 48.58083 N, 9.50617 W | RRS Charles Darwin CD173 |
| 737689 | CTD or STD cast | 2005-07-24 04:03:00 | 48.5825 N, 9.512 W | RRS Charles Darwin CD173 |
| 1371585 | CTD or STD cast | 2014-03-28 15:49:00 | 48.57113 N, 9.5127 W | RRS Discovery DY008 |
| 1336711 | Water sample data | 2014-03-28 15:55:00 | 48.57113 N, 9.5127 W | RRS Discovery DY008 |
| 2117548 | Water sample data | 2014-03-28 15:55:00 | 48.57113 N, 9.5127 W | RRS Discovery DY008 |
| 2119101 | Water sample data | 2014-03-28 15:55:00 | 48.57113 N, 9.5127 W | RRS Discovery DY008 |
| 1373057 | CTD or STD cast | 2014-08-07 06:04:00 | 48.57 N, 9.51 W | RRS Discovery DY026A |
| 2127506 | Water sample data | 2014-08-07 06:20:00 | 48.5699 N, 9.51027 W | RRS Discovery DY026A |
| 1373069 | CTD or STD cast | 2014-08-07 11:10:00 | 48.57633 N, 9.51617 W | RRS Discovery DY026A |
| 2118146 | Water sample data | 2014-08-07 11:29:30 | 48.57648 N, 9.5154 W | RRS Discovery DY026A |
| 2127518 | Water sample data | 2014-08-07 11:29:30 | 48.57648 N, 9.5154 W | RRS Discovery DY026A |
| 1373070 | CTD or STD cast | 2014-08-07 15:00:00 | 48.57167 N, 9.505 W | RRS Discovery DY026A |
| 2127531 | Water sample data | 2014-08-07 15:17:00 | 48.5711 N, 9.5046 W | RRS Discovery DY026A |
| 1371849 | CTD or STD cast | 2014-11-14 13:15:00 | 48.571 N, 9.50947 W | RRS Discovery DY018 (GApr04) |
| 2117689 | Water sample data | 2014-11-14 13:23:30 | 48.57106 N, 9.50945 W | RRS Discovery DY018 (GApr04) |
| 1749283 | Fluorescence or pigments | 2014-11-17 10:00:00 | 48.57086 N, 9.5097 W | RRS Discovery DY018 (GApr04) |
| 1749295 | Fluorescence or pigments | 2014-11-17 10:00:00 | 48.57086 N, 9.5097 W | RRS Discovery DY018 (GApr04) |
| 1749302 | Fluorescence or pigments | 2014-11-17 10:00:00 | 48.57086 N, 9.5097 W | RRS Discovery DY018 (GApr04) |
| 1749314 | Fluorescence or pigments | 2014-11-17 10:00:00 | 48.57086 N, 9.5097 W | RRS Discovery DY018 (GApr04) |
| 1749326 | Fluorescence or pigments | 2014-11-17 10:00:00 | 48.57086 N, 9.5097 W | RRS Discovery DY018 (GApr04) |
| 1749338 | Hydrography time series at depth | 2014-11-17 10:00:00 | 48.57086 N, 9.5097 W | RRS Discovery DY018 (GApr04) |
| 1749351 | Hydrography time series at depth | 2014-11-17 10:00:00 | 48.57086 N, 9.5097 W | RRS Discovery DY018 (GApr04) |
| 1749363 | Hydrography time series at depth | 2014-11-17 10:00:00 | 48.57086 N, 9.5097 W | RRS Discovery DY018 (GApr04) |
| 1749375 | Hydrography time series at depth | 2014-11-17 10:00:00 | 48.57086 N, 9.5097 W | RRS Discovery DY018 (GApr04) |
| 1749399 | Hydrography time series at depth | 2014-11-17 10:00:00 | 48.57086 N, 9.5097 W | RRS Discovery DY018 (GApr04) |
| 1749406 | Hydrography time series at depth | 2014-11-17 10:00:00 | 48.57086 N, 9.5097 W | RRS Discovery DY018 (GApr04) |
| 1749418 | Hydrography time series at depth | 2014-11-17 10:00:00 | 48.57086 N, 9.5097 W | RRS Discovery DY018 (GApr04) |
| 1749431 | Hydrography time series at depth | 2014-11-17 10:00:00 | 48.57086 N, 9.5097 W | RRS Discovery DY018 (GApr04) |
| 1749443 | Hydrography time series at depth | 2014-11-17 10:00:00 | 48.57086 N, 9.5097 W | RRS Discovery DY018 (GApr04) |
| 1749455 | Hydrography time series at depth | 2014-11-17 10:00:00 | 48.57086 N, 9.5097 W | RRS Discovery DY018 (GApr04) |
| 1749467 | Hydrography time series at depth | 2014-11-17 10:00:00 | 48.57086 N, 9.5097 W | RRS Discovery DY018 (GApr04) |
| 1749479 | Hydrography time series at depth | 2014-11-17 10:00:00 | 48.57086 N, 9.5097 W | RRS Discovery DY018 (GApr04) |
| 1749480 | Hydrography time series at depth | 2014-11-17 10:00:00 | 48.57086 N, 9.5097 W | RRS Discovery DY018 (GApr04) |
| 1749492 | Hydrography time series at depth | 2014-11-17 10:00:00 | 48.57086 N, 9.5097 W | RRS Discovery DY018 (GApr04) |
| 1749511 | Hydrography time series at depth | 2014-11-17 10:00:00 | 48.57086 N, 9.5097 W | RRS Discovery DY018 (GApr04) |
| 1749523 | Hydrography time series at depth | 2014-11-17 10:00:00 | 48.57086 N, 9.5097 W | RRS Discovery DY018 (GApr04) |
| 1749535 | Hydrography time series at depth | 2014-11-17 10:00:00 | 48.57086 N, 9.5097 W | RRS Discovery DY018 (GApr04) |
| 1749547 | Hydrography time series at depth | 2014-11-17 10:00:00 | 48.57086 N, 9.5097 W | RRS Discovery DY018 (GApr04) |
| 1749559 | Hydrography time series at depth | 2014-11-17 10:00:00 | 48.57086 N, 9.5097 W | RRS Discovery DY018 (GApr04) |
| 1749560 | Hydrography time series at depth | 2014-11-17 10:00:00 | 48.57086 N, 9.5097 W | RRS Discovery DY018 (GApr04) |
| 1749572 | Hydrography time series at depth | 2014-11-17 10:00:00 | 48.57086 N, 9.5097 W | RRS Discovery DY018 (GApr04) |
| 1749584 | Hydrography time series at depth | 2014-11-17 10:00:00 | 48.57086 N, 9.5097 W | RRS Discovery DY018 (GApr04) |
| 1749596 | Hydrography time series at depth | 2014-11-17 10:00:00 | 48.57086 N, 9.5097 W | RRS Discovery DY018 (GApr04) |
| 1749387 | Hydrography time series at depth | 2014-11-17 10:00:30 | 48.57086 N, 9.5097 W | RRS Discovery DY018 (GApr04) |
| 1371978 | CTD or STD cast | 2014-11-17 12:25:00 | 48.57087 N, 9.50968 W | RRS Discovery DY018 (GApr04) |
| 2117690 | Water sample data | 2014-11-17 12:35:30 | 48.57086 N, 9.50969 W | RRS Discovery DY018 (GApr04) |
| 2119832 | Water sample data | 2014-11-17 12:35:30 | 48.57086 N, 9.50969 W | RRS Discovery DY018 (GApr04) |
| 2126804 | Water sample data | 2014-11-17 12:35:30 | 48.57086 N, 9.50969 W | RRS Discovery DY018 (GApr04) |
| 2136614 | Water sample data | 2014-11-17 12:35:30 | 48.57086 N, 9.50969 W | RRS Discovery DY018 (GApr04) |
| 1371991 | CTD or STD cast | 2014-11-17 15:42:00 | 48.57087 N, 9.50968 W | RRS Discovery DY018 (GApr04) |
| 1372005 | CTD or STD cast | 2014-11-18 05:16:00 | 48.57107 N, 9.51052 W | RRS Discovery DY018 (GApr04) |
| 2117708 | Water sample data | 2014-11-18 05:28:00 | 48.57107 N, 9.51051 W | RRS Discovery DY018 (GApr04) |
| 2126816 | Water sample data | 2014-11-18 05:28:00 | 48.57107 N, 9.51051 W | RRS Discovery DY018 (GApr04) |
| 2136626 | Water sample data | 2014-11-18 05:28:00 | 48.57107 N, 9.51051 W | RRS Discovery DY018 (GApr04) |
| 1372017 | CTD or STD cast | 2014-11-18 08:10:00 | 48.57127 N, 9.51102 W | RRS Discovery DY018 (GApr04) |
| 1372460 | CTD or STD cast | 2014-11-18 09:15:00 | 48.57127 N, 9.51102 W | RRS Discovery DY018 (GApr04) |
| 2120058 | Water sample data | 2014-11-18 09:19:00 | 48.57127 N, 9.51102 W | RRS Discovery DY018 (GApr04) |
| 2121479 | Water sample data | 2014-11-18 09:19:00 | 48.57127 N, 9.51102 W | RRS Discovery DY018 (GApr04) |
| 2127033 | Water sample data | 2014-11-18 09:19:00 | 48.57127 N, 9.51102 W | RRS Discovery DY018 (GApr04) |
| 1372029 | CTD or STD cast | 2014-11-18 10:02:00 | 48.57127 N, 9.51102 W | RRS Discovery DY018 (GApr04) |
| 1372030 | CTD or STD cast | 2014-11-18 12:11:00 | 48.57123 N, 9.51103 W | RRS Discovery DY018 (GApr04) |
| 2117721 | Water sample data | 2014-11-18 12:21:30 | 48.57125 N, 9.51104 W | RRS Discovery DY018 (GApr04) |
| 2119844 | Water sample data | 2014-11-18 12:21:30 | 48.57125 N, 9.51104 W | RRS Discovery DY018 (GApr04) |
| 2126828 | Water sample data | 2014-11-18 12:21:30 | 48.57125 N, 9.51104 W | RRS Discovery DY018 (GApr04) |
| 2136638 | Water sample data | 2014-11-18 12:21:30 | 48.57125 N, 9.51104 W | RRS Discovery DY018 (GApr04) |
| 1372472 | CTD or STD cast | 2014-11-19 10:02:00 | 48.57112 N, 9.5095 W | RRS Discovery DY018 (GApr04) |
| 2120071 | Water sample data | 2014-11-19 10:06:00 | 48.57113 N, 9.50949 W | RRS Discovery DY018 (GApr04) |
| 2121480 | Water sample data | 2014-11-19 10:06:00 | 48.57113 N, 9.50949 W | RRS Discovery DY018 (GApr04) |
| 2127045 | Water sample data | 2014-11-19 10:06:00 | 48.57113 N, 9.50949 W | RRS Discovery DY018 (GApr04) |
| 1372042 | CTD or STD cast | 2014-11-19 12:17:00 | 48.57113 N, 9.50952 W | RRS Discovery DY018 (GApr04) |
| 2117733 | Water sample data | 2014-11-19 12:27:00 | 48.57112 N, 9.50949 W | RRS Discovery DY018 (GApr04) |
| 2119856 | Water sample data | 2014-11-19 12:27:00 | 48.57112 N, 9.50949 W | RRS Discovery DY018 (GApr04) |
| 2126841 | Water sample data | 2014-11-19 12:27:00 | 48.57112 N, 9.50949 W | RRS Discovery DY018 (GApr04) |
| 2136651 | Water sample data | 2014-11-19 12:27:00 | 48.57112 N, 9.50949 W | RRS Discovery DY018 (GApr04) |
| 1372054 | CTD or STD cast | 2014-11-19 13:58:00 | 48.57112 N, 9.50953 W | RRS Discovery DY018 (GApr04) |
| 1372066 | CTD or STD cast | 2014-11-20 02:11:00 | 48.57352 N, 9.50627 W | RRS Discovery DY018 (GApr04) |
| 2117745 | Water sample data | 2014-11-20 02:21:30 | 48.57351 N, 9.50628 W | RRS Discovery DY018 (GApr04) |
| 2126853 | Water sample data | 2014-11-20 02:21:30 | 48.57351 N, 9.50628 W | RRS Discovery DY018 (GApr04) |
| 2136663 | Water sample data | 2014-11-20 02:21:30 | 48.57351 N, 9.50628 W | RRS Discovery DY018 (GApr04) |
| 1372238 | CTD or STD cast | 2014-11-24 13:17:00 | 48.571 N, 9.50945 W | RRS Discovery DY018 (GApr04) |
| 1372251 | CTD or STD cast | 2014-11-24 14:09:00 | 48.571 N, 9.50947 W | RRS Discovery DY018 (GApr04) |
| 2119893 | Water sample data | 2014-11-24 14:12:30 | 48.571 N, 9.50946 W | RRS Discovery DY018 (GApr04) |
| 1624461 | CTD or STD cast | 2015-03-24 05:51:00 | 48.57065 N, 9.5093 W | RRS Discovery DY021 |
| 2118091 | Water sample data | 2015-03-24 05:59:00 | 48.57066 N, 9.5093 W | RRS Discovery DY021 |
| 2127358 | Water sample data | 2015-03-24 05:59:00 | 48.57066 N, 9.5093 W | RRS Discovery DY021 |
| 1626271 | CTD or STD cast | 2015-04-09 02:07:00 | 48.57113 N, 9.51593 W | RRS Discovery DY029 (GApr04) |
| 1626283 | CTD or STD cast | 2015-04-09 07:07:00 | 48.57117 N, 9.50992 W | RRS Discovery DY029 (GApr04) |
| 1626258 | CTD or STD cast | 2015-04-09 18:06:00 | 48.5742 N, 9.50827 W | RRS Discovery DY029 (GApr04) |
| 2136780 | Water sample data | 2015-04-10 02:23:00 | 48.57114 N, 9.50994 W | RRS Discovery DY029 (GApr04) |
| 2118299 | Water sample data | 2015-04-10 07:25:00 | 48.57116 N, 9.5099 W | RRS Discovery DY029 (GApr04) |
| 1626523 | CTD or STD cast | 2015-04-17 07:09:00 | 48.57188 N, 9.51053 W | RRS Discovery DY029 (GApr04) |
| 2118411 | Water sample data | 2015-04-17 07:14:30 | 48.57057 N, 9.51103 W | RRS Discovery DY029 (GApr04) |
| 2136903 | Water sample data | 2015-04-17 07:14:30 | 48.57057 N, 9.51103 W | RRS Discovery DY029 (GApr04) |
| 2118472 | Water sample data | 2015-04-24 02:23:30 | 48.57129 N, 9.50945 W | RRS Discovery DY029 (GApr04) |
| 2136940 | Water sample data | 2015-04-24 02:23:30 | 48.57129 N, 9.50945 W | RRS Discovery DY029 (GApr04) |
| 1626812 | CTD or STD cast | 2015-04-24 02:41:00 | 48.57132 N, 9.50962 W | RRS Discovery DY029 (GApr04) |
| 1627378 | CTD or STD cast | 2015-04-24 05:43:00 | 48.52172 N, 9.45178 W | RRS Discovery DY029 (GApr04) |
| 1626824 | CTD or STD cast | 2015-04-24 09:04:00 | 48.60553 N, 9.44478 W | RRS Discovery DY029 (GApr04) |
| 2118484 | Water sample data | 2015-04-24 13:35:30 | 48.5697 N, 9.50944 W | RRS Discovery DY029 (GApr04) |
| 2136952 | Water sample data | 2015-04-24 13:35:30 | 48.5697 N, 9.50944 W | RRS Discovery DY029 (GApr04) |
| 1626836 | CTD or STD cast | 2015-04-24 13:49:00 | 48.56968 N, 9.50942 W | RRS Discovery DY029 (GApr04) |
| 1626848 | CTD or STD cast | 2015-04-24 15:45:00 | 48.5666 N, 9.50927 W | RRS Discovery DY029 (GApr04) |
| 1627391 | CTD or STD cast | 2015-04-24 16:27:00 | 48.56667 N, 9.50933 W | RRS Discovery DY029 (GApr04) |
| 1626861 | CTD or STD cast | 2015-04-24 17:25:00 | 48.56647 N, 9.50928 W | RRS Discovery DY029 (GApr04) |
| 1624983 | CTD or STD cast | 2015-05-22 14:55:00 | 48.57023 N, 9.5104 W | RRS Discovery DY030 |
| 2132545 | Water sample data | 2015-05-22 15:11:00 | 48.57023 N, 9.51038 W | RRS Discovery DY030 |
| 2137838 | Water sample data | 2015-05-22 15:11:00 | 48.57023 N, 9.51038 W | RRS Discovery DY030 |
| 1624645 | CTD or STD cast | 2015-05-22 16:13:00 | 48.57023 N, 9.5104 W | RRS Discovery DY030 |
| 2123413 | Water sample data | 2015-05-22 16:26:30 | 48.57023 N, 9.51039 W | RRS Discovery DY030 |
| 1625199 | CTD or STD cast | 2015-07-19 01:15:00 | 48.57085 N, 9.5098 W | RRS Discovery DY033 (GApr04) |
| 2118693 | Water sample data | 2015-07-19 01:21:30 | 48.57086 N, 9.5099 W | RRS Discovery DY033 (GApr04) |
| 2120279 | Water sample data | 2015-07-19 01:21:30 | 48.57086 N, 9.5099 W | RRS Discovery DY033 (GApr04) |
| 2123566 | Water sample data | 2015-07-19 01:21:30 | 48.57086 N, 9.5099 W | RRS Discovery DY033 (GApr04) |
| 2137931 | Water sample data | 2015-07-19 01:21:30 | 48.57086 N, 9.5099 W | RRS Discovery DY033 (GApr04) |
| 1625206 | CTD or STD cast | 2015-07-19 11:05:00 | 48.57113 N, 9.50987 W | RRS Discovery DY033 (GApr04) |
| 2123578 | Water sample data | 2015-07-19 11:17:00 | 48.57115 N, 9.50986 W | RRS Discovery DY033 (GApr04) |
| 2137943 | Water sample data | 2015-07-19 11:17:00 | 48.57115 N, 9.50986 W | RRS Discovery DY033 (GApr04) |
| 1625218 | CTD or STD cast | 2015-07-19 15:50:00 | 48.57122 N, 9.50985 W | RRS Discovery DY033 (GApr04) |
| 1625231 | CTD or STD cast | 2015-07-20 02:12:00 | 48.57083 N, 9.50967 W | RRS Discovery DY033 (GApr04) |
| 2118700 | Water sample data | 2015-07-20 02:24:00 | 48.57092 N, 9.50971 W | RRS Discovery DY033 (GApr04) |
| 2123591 | Water sample data | 2015-07-20 02:24:00 | 48.57092 N, 9.50971 W | RRS Discovery DY033 (GApr04) |
| 2137955 | Water sample data | 2015-07-20 02:24:00 | 48.57092 N, 9.50971 W | RRS Discovery DY033 (GApr04) |
| 1625685 | CTD or STD cast | 2015-07-20 03:29:00 | 48.57083 N, 9.50967 W | RRS Discovery DY033 (GApr04) |
| 2120440 | Water sample data | 2015-07-20 03:39:00 | 48.57093 N, 9.50975 W | RRS Discovery DY033 (GApr04) |
| 2123947 | Water sample data | 2015-07-20 03:39:00 | 48.57093 N, 9.50975 W | RRS Discovery DY033 (GApr04) |
| 1625243 | CTD or STD cast | 2015-07-20 05:18:00 | 48.57083 N, 9.50967 W | RRS Discovery DY033 (GApr04) |
| 1625255 | CTD or STD cast | 2015-07-20 10:04:00 | 48.5711 N, 9.5093 W | RRS Discovery DY033 (GApr04) |
| 2120280 | Water sample data | 2015-07-20 11:15:00 | 48.5711 N, 9.50929 W | RRS Discovery DY033 (GApr04) |
| 2123609 | Water sample data | 2015-07-20 11:15:00 | 48.5711 N, 9.50929 W | RRS Discovery DY033 (GApr04) |
| 2137967 | Water sample data | 2015-07-20 11:15:00 | 48.5711 N, 9.50929 W | RRS Discovery DY033 (GApr04) |
| 1625267 | CTD or STD cast | 2015-07-20 15:26:00 | 48.57107 N, 9.50897 W | RRS Discovery DY033 (GApr04) |
| 2119752 | Water sample data | 2015-08-31 08:42:30 | 48.57077 N, 9.50961 W | RRS Discovery DY034 |
| 2122317 | Water sample data | 2015-08-31 10:10:00 | 48.57082 N, 9.51127 W | RRS Discovery DY034 |
