Metadata Report for BODC Series Reference Number 1342476
Metadata Summary
Problem Reports
Data Access Policy
Narrative Documents
Project Information
Data Activity or Cruise Information
Fixed Station Information
BODC Quality Flags
SeaDataNet Quality Flags
Metadata Summary
Data Description |
|||||||||||||||||||||||||||||
|
|||||||||||||||||||||||||||||
Data Identifiers |
|||||||||||||||||||||||||||||
|
|||||||||||||||||||||||||||||
Time Co-ordinates(UT) |
|||||||||||||||||||||||||||||
|
|||||||||||||||||||||||||||||
Spatial Co-ordinates | |||||||||||||||||||||||||||||
|
|||||||||||||||||||||||||||||
Parameters |
|||||||||||||||||||||||||||||
|
|||||||||||||||||||||||||||||
Definition of BOTTFLAG | |||||||||||||||||||||||||||||
| BOTTFLAG | Definition |
|---|---|
| 0 | The sampling event occurred without any incident being reported to BODC. |
| 1 | The filter in an in-situ sampling pump physically ruptured during sample resulting in an unquantifiable loss of sampled material. |
| 2 | Analytical evidence (e.g. surface water salinity measured on a sample collected at depth) indicates that the water sample has been contaminated by water from depths other than the depths of sampling. |
| 3 | The feedback indicator on the deck unit reported that the bottle closure command had failed. General Oceanics deck units used on NERC vessels in the 80s and 90s were renowned for reporting misfires when the bottle had been closed. This flag is also suitable for when a trigger command is mistakenly sent to a bottle that has previously been fired. |
| 4 | During the sampling deployment the bottle was fired in an order other than incrementing rosette position. Indicative of the potential for errors in the assignment of bottle firing depth, especially with General Oceanics rosettes. |
| 5 | Water was reported to be escaping from the bottle as the rosette was being recovered. |
| 6 | The bottle seals were observed to be incorrectly seated and the bottle was only part full of water on recovery. |
| 7 | Either the bottle was found to contain no sample on recovery or there was no bottle fitted to the rosette position fired (but SBE35 record may exist). |
| 8 | There is reason to doubt the accuracy of the sampling depth associated with the sample. |
| 9 | The bottle air vent had not been closed prior to deployment giving rise to a risk of sample contamination through leakage. |
Definition of Rank |
|
|
Problem Reports
No Problem Report Found in the Database
Data Access Policy
Open Data
These data have no specific confidentiality restrictions for users. However, users must acknowledge data sources as it is not ethical to publish data without proper attribution. Any publication or other output resulting from usage of the data should include an acknowledgment.
If the Information Provider does not provide a specific attribution statement, or if you are using Information from several Information Providers and multiple attributions are not practical in your product or application, you may consider using the following:
"Contains public sector information licensed under the Open Government Licence v1.0."
Narrative Documents
Niskin Bottle
The Niskin bottle is a device used by oceanographers to collect subsurface seawater samples. It is a plastic bottle with caps and rubber seals at each end and is deployed with the caps held open, allowing free-flushing of the bottle as it moves through the water column.
Standard Niskin
The standard version of the bottle includes a plastic-coated metal spring or elastic cord running through the interior of the bottle that joins the two caps, and the caps are held open against the spring by plastic lanyards. When the bottle reaches the desired depth the lanyards are released by a pressure-actuated switch, command signal or messenger weight and the caps are forced shut and sealed, trapping the seawater sample.
Lever Action Niskin
The Lever Action Niskin Bottle differs from the standard version, in that the caps are held open during deployment by externally mounted stainless steel springs rather than an internal spring or cord. Lever Action Niskins are recommended for applications where a completely clear sample chamber is critical or for use in deep cold water.
Clean Sampling
A modified version of the standard Niskin bottle has been developed for clean sampling. This is teflon-coated and uses a latex cord to close the caps rather than a metal spring. The clean version of the Levered Action Niskin bottle is also teflon-coated and uses epoxy covered springs in place of the stainless steel springs. These bottles are specifically designed to minimise metal contamination when sampling trace metals.
Deployment
Bottles may be deployed singly clamped to a wire or in groups of up to 48 on a rosette. Standard bottles and Lever Action bottles have a capacity between 1.7 and 30 L. Reversing thermometers may be attached to a spring-loaded disk that rotates through 180° on bottle closure.
RAPID Cruise D346 discrete nutrient sampling
Originator's data acquisition and analysis
Inorganic and total nutrients
Seawater was collected for analysis of micro-molar concentrations of dissolved nutrients; nitrate and nitrite, phosphate and silicate. Samples for inorganic nutrient analysis were collected directly into either 30 mL plastic pots or 60 mL Sterilin pots. 60 mL pots were used for collection of seawater for total nutrient analysis. The pots were rinsed with sample water at least three times before drawing the sample. When required, samples were stored in a fridge at approximately 4°C until analysis.
In general, analyses were started within 1-4 hours of sample collection using a segmented continuous-flow Skalar Sanplus autoanalyser according to standard colormetric techniques described by Kirkwood (1996). The only exception to this was the increase of the pump rate by a factor of 1.5 through the phosphate, improving the reproducibility and peak shape of the results.
5 µmol L-1 stock standard solutions prepared in Milli-Q water were used to produce working standards. Working standards were prepared in a saline solution (40 g NaCl in 1 L of Milli-Q water), which was also used as diluent for the analyses.
Total nutrients (total nitrogen (TN) and total phosphorus (TP)) were measured as nitrate and phosphate after photo-oxidation for 2 hours using a Metrohm 705 digester (Sanders and Jickells, 2002). The oxidation efficiency of the method was monitored using a Guanosine standard at two different N and P concentrations; i) 2 and 5 µmol L-1 for nitrogen, ii) 0.4 and 1 µmol L-1 for phosphorus, which produced i) 2±0.3 and 4.1±0.8 (efficiency higher than 80%) and ii) 0.2±0.3 and 0.8±0.2 (efficiency higher than 50%) respectively. The UV systems were installed inside the fume hood of the chemistry lab and a flow meter was attached in order to monitor the water flow for cooling.
At the start of the cruise all samples from all stations were UV oxidised in duplicates. However, when the two UV units started to fail, this caused a delay in the analysis process resulting in a large backlog of samples.
Ideally, the total nutrients should have be analysed together with their respective inorganic fraction in the same autoanalyser run, but the large backlog prompted a run of all inorganic nutrient samples immediately. The total nutrients were run as soon they became available upon UV oxidation (from Station 1 to Station 39). This meant analysing total nutrients in separate runs.
The number of samples being analysed for total nutrient concentrations was reduced to every third station. From station 39 and starting with station 42, one out of three casts were thus sampled for total nutrients. Whenever a Niskin bottle misfired, the available space on the UV unit rack was used for either a replicate or for the analysis of a Guanosine standard.
Once the backlog was cleared and the time between stations increased, it was decided that samples for total nutrient analysis should be taken from all casts again. However, this was not possible, due to the continuous failure of the UV systems. Repeats of whole profiles were also run for a number of stations to check the reliability of the UV digester units and accuracy of the total nutrient concentrations.
Inorganic nitrate and phosphate at nanomolar concentrations
A gas-segmented continuous-flow colorimetric method was used for both phosphate and nitrate. The chemical methods are described by Grasshoff et al., (1983). The autoanalyser is coupled with liquid waveguide capillary cells (LWCC) to achieve nanomolar levels of detection (Patey et al. 2008).
Blanks were measured with Milli-Q and low nutrients seawater (LNSW). Prior to this, the LNSW was aged for several months in the lab at room temperature and with the presence of light. Standards were measured in Milli-Q and LNSW to correct for the salt effect from the seawater matrix.
Samples were drawn from Niskin bottles on the CTD into 10% HCl clean 60 ml bottles and kept refrigerated at approximately 4oC until analysis. Analysis was undertaken on a modified Burkard Autoanalyser with one main peristaltic pump and reaction channels, one for phosphate and one for nitrate.
The detection cells were Liquid Core Waveguide Capillary Cells (LWCC) of 2 m in length. Spectrophotometric detection was achieved using tungsten lamps as light sources and two spectrometers. These devices were linked with fiber-optic connections.
Data acquisition was conducted in two steps using Spectrasuite software. First, the spectrum of the coloured complex provided a value of the signal intensity for each wavelength. Secondly, the absorbance of the signal was measured for the wavelength of interest for each compound. The selected wavelengths for nitrate and phosphate are respectively 540 nm and 710 nm.
Some problems were encountered with the analyser. These were:
1. The software's capability to read both channels simultaneously. The software did not support the function of being given two references, one for each channel. Therefore, a reference monitor was required for the second acquisition.
2. Contamination of samples in the lab. This problem had been anticipated, so a bag, flushed with oxygen-free nitrogen, was successfully set around the sampler to prevent any contamination from the air. The first sample read was repeated at the end of the run to ensure there was no contamination.
Further details can be found in the D346 cruise report (King et al., 2012).
References cited
Grasshoff, K., Ehrhardt, M., Kremling, K. (1983). Methods of Seawater Analysis, Verlag Chemie, Weinheim.
King, B.A., Hamersley, D. R. C (ed.) (2012) RRS Discovery Cruise 346, 05 Jan - 19 Feb 2010. The 2010 transatlantic hydrography section at 24.5°N. Southampton, UK, National Oceanography Centre, Southampton, 177pp. (National Oceanography Centre Southampton Cruise Report).
Kirkwood, D. (1996). Nutrients: Practical notes on their determination in seawater. ICES Techniques in Marine Environmental, 17, 1-25.
Patey, M. D., Rijkenberg, M.J.A., Statham, P.J., Mowlem, M., Stinchcombe, M.C., Achterberg, E.P. (2008). Determination of nitrate and phosphate in seawater at nanomolar concentrations, TrAC Trends in Analytical Chemistry, 27 (2), 169-182.
BODC data processing procedures
The data were supplied in MSTAR format for the nitrate, phosphate, silicate, total nitrogen, total phosphorus, dissolved organic nitrate and dissolved organic phosphorus variables and converted to ASCII. Data for nanomolar concentrations of nitrate and phosphate were supplied to BODC in a csv spreadsheet. Units were converted, if necessary, to the BODC standard parameter units. The data were then loaded into a database under the ORACLE Relational Database Management System without modification.
Data that lay outside the permitted range for the parameter code were flagged suspect with an 'M' flag by BODC.
Content of data series
| Originator's parameter | Description | Units | BODC parameter code | Units | Comments |
|---|---|---|---|---|---|
| totnit | Nitrate+Nitrite | µmol kg-1 | NTKGAATX | µmol kg-1 | - |
| phos | Phosphate | µmol kg-1 | PHKGAATX | µmol kg-1 | - |
| silc | Silicate | µmol kg-1 | SLKGAATX | µmol kg-1 | - |
| tn | Total nitrogen | µmol kg-1 | NTAAKGD1 | µmol kg-1 | - |
| tp | Total phosphorus | µmol kg-1 | TPHSKG01 | µmol kg-1 | - |
| nitrate (nM) | Nanomolar concentrations of nitrate | nM | NTRZLWTX | µmol l-1 | Unit conversion: *0.001 |
| phosphate (nM) | Nanomolar concentrations of phosphate | nM | PHOSLWTX | µmol l-1 | Unit conversion: *0.001 |
| DON | Dissolved organic nitrogen | µmol kg-1 | MDMAP008 | µmol kg-1 | - |
| DOP | Dissolved organic phosphorus | µmol kg-1 | ORGPDSZZ | µmol kg-1 | - |
Data quality
Quality control flags that were used by the originator have been mapped to BODC flags as shown below:
| Originator flag | Description | BODC flag | Comments |
|---|---|---|---|
| 2 | Good | ' ' | - |
| 3 | Questionable | L | - |
| 4 | Bad | L | - |
| 6 | Duplicate | - | - |
| 9 | Not sampled | - | Not loaded into database |
Project Information
Oceans 2025 - The NERC Marine Centres' Strategic Research Programme 2007-2012
Who funds the programme?
The Natural Environment Research Council (NERC) funds the Oceans 2025 programme, which was originally planned in the context of NERC's 2002-2007 strategy and later realigned to NERC's subsequent strategy (Next Generation Science for Planet Earth; NERC 2007).
Who is involved in the programme?
The Oceans 2025 programme was designed by and is to be implemented through seven leading UK marine centres. The marine centres work together in coordination and are also supported by cooperation and input from government bodies, universities and other partners. The seven marine centres are:
- National Oceanography Centre, Southampton (NOCS)
- Plymouth Marine Laboratory (PML)
- Marine Biological Association (MBA)
- Sir Alister Hardy Foundation for Marine Science (SAHFOS)
- Proudman Oceanographic Laboratory (POL)
- Scottish Association for Marine Science (SAMS)
- Sea Mammal Research Unit (SMRU)
Oceans2025 provides funding to three national marine facilities, which provide services to the wider UK marine community, in addition to the Oceans 2025 community. These facilities are:
- British Oceanographic Data Centre (BODC), hosted at POL
- Permanent Service for Mean Sea Level (PSMSL), hosted at POL
- Culture Collection of Algae and Protozoa (CCAP), hosted at SAMS
The NERC-run Strategic Ocean Funding Initiative (SOFI) provides additional support to the programme by funding additional research projects and studentships that closely complement the Oceans 2025 programme, primarily through universities.
What is the programme about?
Oceans 2025 sets out to address some key challenges that face the UK as a result of a changing marine environment. The research funded through the programme sets out to increase understanding of the size, nature and impacts of these changes, with the aim to:
- improve knowledge of how the seas behave, not just now but in the future;
- help assess what that might mean for the Earth system and for society;
- assist in developing sustainable solutions for the management of marine resources for future generations;
- enhance the research capabilities and facilities available for UK marine science.
In order to address these aims there are nine science themes supported by the Oceans 2025 programme:
- Climate, circulation and sea level (Theme 1)
- Marine biogeochemical cycles (Theme 2)
- Shelf and coastal processes (Theme 3)
- Biodiversity and ecosystem functioning (Theme 4)
- Continental margins and deep ocean (Theme 5)
- Sustainable marine resources (Theme 6)
- Technology development (Theme 8)
- Next generation ocean prediction (Theme 9)
- Integration of sustained observations in the marine environment (Theme 10)
In the original programme proposal there was a theme on health and human impacts (Theme 7). The elements of this Theme have subsequently been included in Themes 3 and 9.
When is the programme active?
The programme started in April 2007 with funding for 5 years.
Brief summary of the programme fieldwork/data
Programme fieldwork and data collection are to be achieved through:
- physical, biological and chemical parameters sampling throughout the North and South Atlantic during collaborative research cruises aboard NERC's research vessels RRS Discovery, RRS James Cook and RRS James Clark Ross;
- the Continuous Plankton Recorder being deployed by SAHFOS in the North Atlantic and North Pacific on 'ships of opportunity';
- physical parameters measured and relayed in near real-time by fixed moorings and ARGO floats;
- coastal and shelf sea observatory data (Liverpool Bay Coastal Observatory (LBCO) and Western Channel Observatory (WCO)) using the RV Prince Madog and RV Quest.
The data is to be fed into models for validation and future projections. Greater detail can be found in the Theme documents.
Data Activity or Cruise Information
Data Activity
| Start Date (yyyy-mm-dd) | 2010-01-11 |
| End Date (yyyy-mm-dd) | 2010-01-11 |
| Organization Undertaking Activity | National Oceanography Centre, Southampton |
| Country of Organization | United Kingdom |
| Originator's Data Activity Identifier | D346_CTD_C026 |
| Platform Category | lowered unmanned submersible |
BODC Sample Metadata Report for D346_CTD_C026
| Sample reference number | Nominal collection volume(l) | Bottle rosette position | Bottle firing sequence number | Minimum pressure sampled (dbar) | Maximum pressure sampled (dbar) | Depth of sampling point (m) | Bottle type | Sample quality flag | Bottle reference | Comments |
|---|---|---|---|---|---|---|---|---|---|---|
| 711263 | 20.00 | 1 | 4878.50 | 4879.50 | 4792.40 | Niskin bottle | No problem reported | 2601 | ||
| 711266 | 20.00 | 2 | 4879.30 | 4880.30 | 4793.10 | Niskin bottle | No problem reported | 2602 | ||
| 711269 | 20.00 | 3 | 4579.70 | 4580.70 | 4501.90 | Niskin bottle | No problem reported | 2603 | ||
| 711272 | 20.00 | 4 | 4068.90 | 4069.90 | 4004.40 | Niskin bottle | No problem reported | 2604 | ||
| 711275 | 20.00 | 5 | 3560.80 | 3561.80 | 3508.50 | Niskin bottle | No problem reported | 2605 | ||
| 711278 | 20.00 | 6 | 3048.70 | 3049.70 | 3007.50 | Niskin bottle | No problem reported | 2606 | ||
| 711281 | 20.00 | 7 | 2538.20 | 2539.20 | 2506.90 | Niskin bottle | No problem reported | 2607 | ||
| 711284 | 20.00 | 8 | 2282.00 | 2283.00 | 2255.30 | Niskin bottle | No problem reported | 2608 | ||
| 711287 | 20.00 | 9 | 2030.30 | 2031.30 | 2007.80 | Niskin bottle | No problem reported | 2609 | ||
| 711290 | 20.00 | 10 | 1778.20 | 1779.20 | 1759.60 | Niskin bottle | No problem reported | 2610 | ||
| 711293 | 20.00 | 11 | 1523.10 | 1524.10 | 1508.10 | Niskin bottle | Bottle leak | 2611 | Slight drip/ water leak when top valve opened | |
| 711296 | 20.00 | 12 | 1268.60 | 1269.60 | 1257.00 | Niskin bottle | Bottle leak | 2612 | Bottle leaking profusely when retrieved from water | |
| 711299 | 20.00 | 13 | 1020.30 | 1021.30 | 1011.60 | Niskin bottle | No problem reported | 2613 | ||
| 711302 | 20.00 | 14 | 892.20 | 893.20 | 885.00 | Niskin bottle | No problem reported | 2614 | ||
| 711305 | 20.00 | 15 | 765.60 | 766.60 | 759.70 | Niskin bottle | Bottle leak | 2615 | Slight drip/ water leak when top valve opened | |
| 711308 | 20.00 | 16 | 766.80 | 767.80 | 760.90 | Niskin bottle | Bottle leak | 2616 | Slight drip/ water leak when top valve opened | |
| 711311 | 20.00 | 17 | 640.00 | 641.00 | 635.30 | Niskin bottle | Bottle leak | 2617 | Slight drip/ water leak when top valve opened | |
| 711314 | 20.00 | 18 | 509.00 | 510.00 | 505.50 | Niskin bottle | No problem reported | 2618 | ||
| 711317 | 20.00 | 19 | 377.70 | 378.70 | 375.40 | Niskin bottle | Bottle leak | 2619 | Slight drip/ water leak when top valve opened | |
| 711320 | 20.00 | 20 | 251.90 | 252.90 | 250.60 | Niskin bottle | No problem reported | 2620 | ||
| 711323 | 20.00 | 21 | 176.70 | 177.70 | 176.00 | Niskin bottle | No problem reported | 2621 | ||
| 711326 | 20.00 | 22 | 106.60 | 107.60 | 106.40 | Niskin bottle | No problem reported | 2622 | ||
| 711329 | 20.00 | 23 | 50.70 | 51.70 | 50.90 | Niskin bottle | No problem reported | 2623 | ||
| 711332 | 20.00 | 24 | 10.40 | 11.40 | 10.80 | Niskin bottle | No problem reported | 2624 |
Please note:the supplied parameters may not have been sampled from all the bottle firings described in the table above. Cross-match the Sample Reference Number above against the SAMPRFNM value in the data file to identify the relevant metadata.
Related Data Activity activities are detailed in Appendix 1
Cruise
| Cruise Name | D346 |
| Departure Date | 2010-01-05 |
| Arrival Date | 2010-02-19 |
| Principal Scientist(s) | Brian A King (National Oceanography Centre, Southampton) |
| Ship | RRS Discovery |
Complete Cruise Metadata Report is available here
Fixed Station Information
Fixed Station Information
| Station Name | 24.5 degrees N Hydrographic Transatlantic section - A05 |
| Category | Offshore route/traverse |
24.5 degrees N Hydrographic Transatlantic section - A05
The hydrographic transatlantic section at 24.5 degrees North has been occupied 8 times, namely in 1957, 1981, 1992, 1998, 2004, 2010, 2015 and 2020. The section is an attempt to calculate the transports of water and its constituents (heat, salinity, nutrients, biological productivity) along this latitude, and to compare the data so that the degree of change in the North Atlantic transports can be revealed. The Hydrographic Programme of the international World Ocean Circulation Experiment (WOCE) designated this section as A05. Since WOCE, the section occupations contribute to the Global Ocean Ship-Based Hydrographic Investigations Program (GO-SHIP).
Map of stations
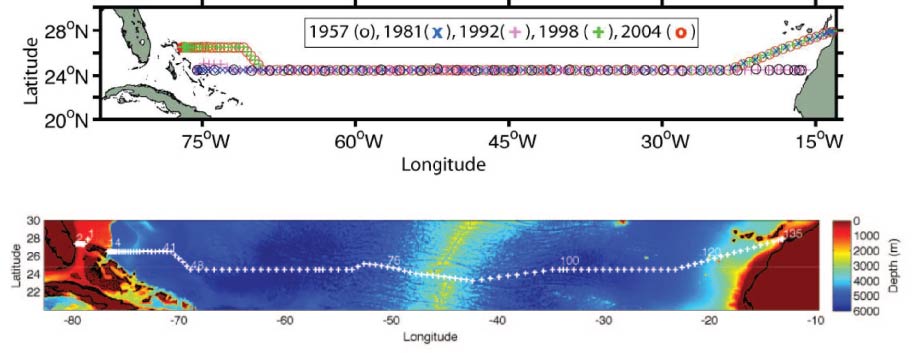
The station positions for most of the occupied sections are shown in the above figures. Sections occupied in 1957, 1981, 1992, 1998 and 2004 are shown in the upper figure. The section occupied in 2010 is shown in the lower figure.
The 1957 and 1992 sections each went zonally along 24.5 degrees N from the African coast to the Bahama Islands. Because of diplomatic clearance issues, the 1981, 1998, 2004, 2010 and 2015 sections angled southwestward from the African coast at about 28 degrees N to join the 24.5 degrees N section at about 23 degrees W. The 1998, 2004 and 2010 sections angled northwestward at about 73 degrees W to finish the section along 26.5 degrees N. The 2010 and 2020 sections deviated from the previous sections across the Mid-Atlantic Ridge (MAR) in order to sample the deepest channel and capture the passage of the deep water across the MAR.
Table 1: Occupations of the section
| Year | Cruise | Reference |
|---|---|---|
| 1957 | - | Fuglister (1960) |
| 1981 | - | Roemmich and Wunsch (1985) |
| 1992 | RV Hesperides HE06 | Parilla et al. (1994) |
| 1998 | RV Ronald H. Brown | Baringer and Molinari (1999) |
| 2004 | RRS Discovery D279 | Bryden et al. (2005b) |
| 2010 | RRS Discovery D346 | King et al. (2012) |
| 2015 | RRS Discovery DY040 | King et al. (2016) |
| 2020 | RRS James Cook JC191 | Sanchez-Franks, A. (2020) |
References
Baringer, M. O. N. and R. L. Molinari, 1999. Atlantic Ocean baroclinic heat flux at 24 to 26°N. Geophysical Research Letters, 26, 353-356.
Bryden, H. L., H. R. Longworth, and S. Cunningham, 2005b. Slowing of the Atlantic meridional overturning circulation at 25°N. Nature, 438, 655-657.
Fuglister, F. C., 1960. Atlantic Ocean Atlas of Temperature and Salinity Profiles and Data from the International Geophysical Year of 1957-1958. Vol. 1, Woods Hole Oceanographic Institution Atlas Series, WHOI, Woods Hole, Massachusetts.
King, B. A. et al., 2012. RRS Discovery Cruise 346, 05 Jan-19 Feb 2010. The 2010 transatlantic hydrography section at 24.5N. Southampton, UK, National Oceanography Centre Southampton, 177pp. (National Oceanography Centre Cruise Report, No. 16).
King, B. A. et al., 2016. RRS Discovery Cruise DY040 (RAGNARoCC), 06 Dec 2015 - 22 Jan 2016. The 2015 transatlantic hydrography section at 24.5N. Southampton, UK, National Oceanography Centre Southampton, 159pp. (National Oceanography Centre Cruise Report).
Parilla, G., A.Lavin, H. Bryden, M. Garcia, and R. Millard, 1994. Rising temperatures in the subtropical North Atlantic Ocean over the past 35 years. Nature, 369, 48-51.
Roemmich, D. and C. Wunsch, 1985. Two transatlantic sections: meridional circulation and heat flux in the subtropical North Atlantic Ocean. Deep Sea Research, 32, 619-664.
Sanchez-Franks, A., 2020. RRS James Cook Cruise JC191, 19 January - 1 March 2020. Hydrographic sections from the Florida Straits to the Canaries Current across 24N in the Atlantic Ocean. Southampton, UK, National Oceanography Centre Southampton, 262pp. (National Oceanography Centre Cruise Report, No. 70).
Related Fixed Station activities are detailed in Appendix 2
BODC Quality Control Flags
The following single character qualifying flags may be associated with one or more individual parameters with a data cycle:
| Flag | Description |
|---|---|
| Blank | Unqualified |
| < | Below detection limit |
| > | In excess of quoted value |
| A | Taxonomic flag for affinis (aff.) |
| B | Beginning of CTD Down/Up Cast |
| C | Taxonomic flag for confer (cf.) |
| D | Thermometric depth |
| E | End of CTD Down/Up Cast |
| G | Non-taxonomic biological characteristic uncertainty |
| H | Extrapolated value |
| I | Taxonomic flag for single species (sp.) |
| K | Improbable value - unknown quality control source |
| L | Improbable value - originator's quality control |
| M | Improbable value - BODC quality control |
| N | Null value |
| O | Improbable value - user quality control |
| P | Trace/calm |
| Q | Indeterminate |
| R | Replacement value |
| S | Estimated value |
| T | Interpolated value |
| U | Uncalibrated |
| W | Control value |
| X | Excessive difference |
SeaDataNet Quality Control Flags
The following single character qualifying flags may be associated with one or more individual parameters with a data cycle:
| Flag | Description |
|---|---|
| 0 | no quality control |
| 1 | good value |
| 2 | probably good value |
| 3 | probably bad value |
| 4 | bad value |
| 5 | changed value |
| 6 | value below detection |
| 7 | value in excess |
| 8 | interpolated value |
| 9 | missing value |
| A | value phenomenon uncertain |
| B | nominal value |
| Q | value below limit of quantification |
Appendix 1: D346_CTD_C026
Related series for this Data Activity are presented in the table below. Further information can be found by following the appropriate links.
If you are interested in these series, please be aware we offer a multiple file download service. Should your credentials be insufficient for automatic download, the service also offers a referral to our Enquiries Officer who may be able to negotiate access.
| Series Identifier | Data Category | Start date/time | Start position | Cruise |
|---|---|---|---|---|
| 1344551 | Water sample data | 2010-01-11 15:47:30 | 26.49558 N, 76.10989 W | RRS Discovery D346 |
Appendix 2: 24.5 degrees N Hydrographic Transatlantic section - A05
Related series for this Fixed Station are presented in the table below. Further information can be found by following the appropriate links.
If you are interested in these series, please be aware we offer a multiple file download service. Should your credentials be insufficient for automatic download, the service also offers a referral to our Enquiries Officer who may be able to negotiate access.
| Series Identifier | Data Category | Start date/time | Start position | Cruise |
|---|---|---|---|---|
| 670065 | Currents -subsurface Eulerian | 2004-04-04 15:03:48 | 26.52083 N, 78.76967 W | RRS Discovery D279 |
| 669236 | Currents -subsurface Eulerian | 2004-04-04 16:25:05 | 26.49567 N, 78.86267 W | RRS Discovery D279 |
| 808729 | Bathymetry | 2004-04-04 16:43:00 | 26.4933 N, 78.9181 W | RRS Discovery D279 |
| 808717 | Meteorology -unspecified | 2004-04-04 16:43:00 | 26.4933 N, 78.9181 W | RRS Discovery D279 |
| 808705 | Surface temp/sal | 2004-04-04 16:43:00 | 26.4933 N, 78.9181 W | RRS Discovery D279 |
| 1058174 | CTD or STD cast | 2004-04-04 17:51:00 | 26.48517 N, 79.005 W | RRS Discovery D279 |
| 669248 | Currents -subsurface Eulerian | 2004-04-05 00:00:08 | 27.0 N, 79.385 W | RRS Discovery D279 |
| 670077 | Currents -subsurface Eulerian | 2004-04-05 00:01:51 | 27.0 N, 79.38733 W | RRS Discovery D279 |
| 1058186 | CTD or STD cast | 2004-04-05 06:21:00 | 27.01383 N, 79.93633 W | RRS Discovery D279 |
| 1261135 | Water sample data | 2004-04-05 06:30:30 | 27.01383 N, 79.93636 W | RRS Discovery D279 |
| 1058198 | CTD or STD cast | 2004-04-05 08:25:00 | 27.02917 N, 79.8625 W | RRS Discovery D279 |
| 1261147 | Water sample data | 2004-04-05 08:39:30 | 27.02919 N, 79.86256 W | RRS Discovery D279 |
| 1058205 | CTD or STD cast | 2004-04-05 10:11:00 | 27.0175 N, 79.77617 W | RRS Discovery D279 |
| 1261159 | Water sample data | 2004-04-05 10:29:00 | 27.01755 N, 79.7761 W | RRS Discovery D279 |
| 1058217 | CTD or STD cast | 2004-04-05 12:50:00 | 27.01467 N, 79.6825 W | RRS Discovery D279 |
| 1261160 | Water sample data | 2004-04-05 13:13:00 | 27.01469 N, 79.68244 W | RRS Discovery D279 |
| 1058229 | CTD or STD cast | 2004-04-05 15:45:00 | 27.01533 N, 79.6175 W | RRS Discovery D279 |
| 1261172 | Water sample data | 2004-04-05 16:03:30 | 27.01531 N, 79.61749 W | RRS Discovery D279 |
| 1058230 | CTD or STD cast | 2004-04-05 18:39:00 | 27.0155 N, 79.5035 W | RRS Discovery D279 |
| 1261184 | Water sample data | 2004-04-05 19:04:00 | 27.01549 N, 79.50347 W | RRS Discovery D279 |
| 1058242 | CTD or STD cast | 2004-04-05 21:15:00 | 27.01483 N, 79.388 W | RRS Discovery D279 |
| 1261196 | Water sample data | 2004-04-05 21:34:00 | 27.01489 N, 79.38806 W | RRS Discovery D279 |
| 1058254 | CTD or STD cast | 2004-04-05 23:26:00 | 27.00067 N, 79.28067 W | RRS Discovery D279 |
| 1261203 | Water sample data | 2004-04-05 23:45:00 | 27.00061 N, 79.28068 W | RRS Discovery D279 |
| 669261 | Currents -subsurface Eulerian | 2004-04-06 00:00:08 | 27.00333 N, 79.28133 W | RRS Discovery D279 |
| 670089 | Currents -subsurface Eulerian | 2004-04-06 00:01:57 | 27.00367 N, 79.2815 W | RRS Discovery D279 |
| 1058266 | CTD or STD cast | 2004-04-06 01:40:00 | 26.99867 N, 79.19433 W | RRS Discovery D279 |
| 1261215 | Water sample data | 2004-04-06 01:54:00 | 26.9986 N, 79.19434 W | RRS Discovery D279 |
| 1058278 | CTD or STD cast | 2004-04-06 17:39:00 | 26.507 N, 76.92733 W | RRS Discovery D279 |
| 669273 | Currents -subsurface Eulerian | 2004-04-07 00:00:11 | 25.887 N, 77.46883 W | RRS Discovery D279 |
| 670090 | Currents -subsurface Eulerian | 2004-04-07 08:50:31 | 26.38083 N, 78.58417 W | RRS Discovery D279 |
| 1058291 | CTD or STD cast | 2004-04-07 20:51:00 | 26.508 N, 76.92733 W | RRS Discovery D279 |
| 1261227 | Water sample data | 2004-04-07 20:55:30 | 26.50796 N, 76.92735 W | RRS Discovery D279 |
| 1058309 | CTD or STD cast | 2004-04-07 22:45:00 | 26.52717 N, 76.80633 W | RRS Discovery D279 |
| 1261239 | Water sample data | 2004-04-07 23:38:00 | 26.52716 N, 76.80634 W | RRS Discovery D279 |
| 669285 | Currents -subsurface Eulerian | 2004-04-08 00:00:14 | 26.53633 N, 76.804 W | RRS Discovery D279 |
| 670108 | Currents -subsurface Eulerian | 2004-04-08 00:02:35 | 26.537 N, 76.804 W | RRS Discovery D279 |
| 1058310 | CTD or STD cast | 2004-04-08 02:38:00 | 26.51267 N, 76.78183 W | RRS Discovery D279 |
| 1261240 | Water sample data | 2004-04-08 03:46:30 | 26.51263 N, 76.78186 W | RRS Discovery D279 |
| 1058322 | CTD or STD cast | 2004-04-08 07:02:00 | 26.51533 N, 76.7455 W | RRS Discovery D279 |
| 1261252 | Water sample data | 2004-04-08 08:42:00 | 26.5154 N, 76.74548 W | RRS Discovery D279 |
| 1058334 | CTD or STD cast | 2004-04-08 12:49:00 | 26.5085 N, 76.68817 W | RRS Discovery D279 |
| 1261264 | Water sample data | 2004-04-08 14:52:30 | 26.50856 N, 76.68817 W | RRS Discovery D279 |
| 1058346 | CTD or STD cast | 2004-04-08 19:07:00 | 26.5075 N, 76.6375 W | RRS Discovery D279 |
| 1263640 | Water sample data | 2004-04-08 22:57:30 | 26.50756 N, 76.6375 W | RRS Discovery D279 |
| 669297 | Currents -subsurface Eulerian | 2004-04-09 00:00:18 | 26.49267 N, 76.61167 W | RRS Discovery D279 |
| 670121 | Currents -subsurface Eulerian | 2004-04-09 00:02:39 | 26.4925 N, 76.61133 W | RRS Discovery D279 |
| 1058358 | CTD or STD cast | 2004-04-09 06:33:00 | 26.49917 N, 76.528 W | RRS Discovery D279 |
| 1261276 | Water sample data | 2004-04-09 08:42:00 | 26.49914 N, 76.52803 W | RRS Discovery D279 |
| 1058371 | CTD or STD cast | 2004-04-09 13:30:00 | 26.5005 N, 76.429 W | RRS Discovery D279 |
| 1261288 | Water sample data | 2004-04-09 15:36:30 | 26.50056 N, 76.42902 W | RRS Discovery D279 |
| 1058383 | CTD or STD cast | 2004-04-09 19:44:00 | 26.49233 N, 76.302 W | RRS Discovery D279 |
| 1261307 | Water sample data | 2004-04-09 21:32:30 | 26.49241 N, 76.30192 W | RRS Discovery D279 |
| 669304 | Currents -subsurface Eulerian | 2004-04-10 00:00:17 | 26.48233 N, 76.299 W | RRS Discovery D279 |
| 670133 | Currents -subsurface Eulerian | 2004-04-10 00:01:23 | 26.4825 N, 76.298 W | RRS Discovery D279 |
| 1058395 | CTD or STD cast | 2004-04-10 01:18:00 | 26.487 N, 76.20983 W | RRS Discovery D279 |
| 1261319 | Water sample data | 2004-04-10 03:06:00 | 26.48706 N, 76.20988 W | RRS Discovery D279 |
| 1058402 | CTD or STD cast | 2004-04-10 07:32:00 | 26.49883 N, 76.09567 W | RRS Discovery D279 |
| 1261320 | Water sample data | 2004-04-10 09:05:00 | 26.49878 N, 76.0957 W | RRS Discovery D279 |
| 1058414 | CTD or STD cast | 2004-04-10 12:50:00 | 26.5025 N, 75.91033 W | RRS Discovery D279 |
| 1261332 | Water sample data | 2004-04-10 14:25:00 | 26.50244 N, 75.91032 W | RRS Discovery D279 |
| 1263652 | Water sample data | 2004-04-10 14:25:00 | 26.50244 N, 75.91032 W | RRS Discovery D279 |
| 1058426 | CTD or STD cast | 2004-04-10 17:56:00 | 26.49167 N, 75.70367 W | RRS Discovery D279 |
| 1261344 | Water sample data | 2004-04-10 19:28:00 | 26.49172 N, 75.70361 W | RRS Discovery D279 |
| 1263664 | Water sample data | 2004-04-10 19:28:00 | 26.49172 N, 75.70361 W | RRS Discovery D279 |
| 1058438 | CTD or STD cast | 2004-04-10 23:18:00 | 26.482 N, 75.5145 W | RRS Discovery D279 |
| 669316 | Currents -subsurface Eulerian | 2004-04-11 00:00:20 | 26.48567 N, 75.51267 W | RRS Discovery D279 |
| 670145 | Currents -subsurface Eulerian | 2004-04-11 00:01:30 | 26.4855 N, 75.51267 W | RRS Discovery D279 |
| 1261356 | Water sample data | 2004-04-11 00:53:00 | 26.48208 N, 75.51453 W | RRS Discovery D279 |
| 1058451 | CTD or STD cast | 2004-04-11 04:40:00 | 26.4915 N, 75.3075 W | RRS Discovery D279 |
| 1261368 | Water sample data | 2004-04-11 06:09:00 | 26.49153 N, 75.30758 W | RRS Discovery D279 |
| 1058463 | CTD or STD cast | 2004-04-11 10:01:00 | 26.51533 N, 75.0745 W | RRS Discovery D279 |
| 1261381 | Water sample data | 2004-04-11 11:42:30 | 26.51535 N, 75.07456 W | RRS Discovery D279 |
| 1263676 | Water sample data | 2004-04-11 11:42:30 | 26.51535 N, 75.07456 W | RRS Discovery D279 |
| 1058475 | CTD or STD cast | 2004-04-11 15:36:00 | 26.5105 N, 74.7975 W | RRS Discovery D279 |
| 1058487 | CTD or STD cast | 2004-04-11 17:37:00 | 26.50933 N, 74.789 W | RRS Discovery D279 |
| 1261393 | Water sample data | 2004-04-11 19:07:00 | 26.50938 N, 74.789 W | RRS Discovery D279 |
| 1058499 | CTD or STD cast | 2004-04-11 23:35:00 | 26.52 N, 74.49667 W | RRS Discovery D279 |
| 669328 | Currents -subsurface Eulerian | 2004-04-12 00:00:23 | 26.51167 N, 74.50683 W | RRS Discovery D279 |
| 670157 | Currents -subsurface Eulerian | 2004-04-12 00:01:35 | 26.51183 N, 74.5065 W | RRS Discovery D279 |
| 1261400 | Water sample data | 2004-04-12 01:13:00 | 26.52004 N, 74.49662 W | RRS Discovery D279 |
| 1058506 | CTD or STD cast | 2004-04-12 04:44:00 | 26.5095 N, 74.2365 W | RRS Discovery D279 |
| 1261412 | Water sample data | 2004-04-12 06:25:30 | 26.50953 N, 74.23645 W | RRS Discovery D279 |
| 1058518 | CTD or STD cast | 2004-04-12 09:53:00 | 26.50117 N, 73.93 W | RRS Discovery D279 |
| 1261424 | Water sample data | 2004-04-12 11:42:00 | 26.50118 N, 73.93001 W | RRS Discovery D279 |
| 1263688 | Water sample data | 2004-04-12 11:42:00 | 26.50118 N, 73.93001 W | RRS Discovery D279 |
| 1058531 | CTD or STD cast | 2004-04-12 15:34:00 | 26.51033 N, 73.56367 W | RRS Discovery D279 |
| 1261436 | Water sample data | 2004-04-12 17:24:30 | 26.5104 N, 73.56369 W | RRS Discovery D279 |
| 1058543 | CTD or STD cast | 2004-04-12 21:16:00 | 26.4995 N, 73.19567 W | RRS Discovery D279 |
| 1261448 | Water sample data | 2004-04-12 23:04:00 | 26.49947 N, 73.19566 W | RRS Discovery D279 |
| 669341 | Currents -subsurface Eulerian | 2004-04-13 00:00:23 | 26.49967 N, 73.1775 W | RRS Discovery D279 |
| 670169 | Currents -subsurface Eulerian | 2004-04-13 00:01:38 | 26.49967 N, 73.177 W | RRS Discovery D279 |
| 1058555 | CTD or STD cast | 2004-04-13 03:17:00 | 26.50217 N, 72.847 W | RRS Discovery D279 |
| 1261461 | Water sample data | 2004-04-13 05:08:00 | 26.50223 N, 72.84708 W | RRS Discovery D279 |
| 1058567 | CTD or STD cast | 2004-04-13 10:09:00 | 26.49967 N, 72.486 W | RRS Discovery D279 |
| 1261473 | Water sample data | 2004-04-13 12:03:00 | 26.49968 N, 72.48593 W | RRS Discovery D279 |
| 1263707 | Water sample data | 2004-04-13 12:03:00 | 26.49968 N, 72.48593 W | RRS Discovery D279 |
| 1058579 | CTD or STD cast | 2004-04-13 16:59:00 | 26.48817 N, 72.0065 W | RRS Discovery D279 |
| 1261485 | Water sample data | 2004-04-13 18:48:30 | 26.48818 N, 72.00642 W | RRS Discovery D279 |
| 1058580 | CTD or STD cast | 2004-04-13 22:59:00 | 26.483 N, 71.75167 W | RRS Discovery D279 |
| 669353 | Currents -subsurface Eulerian | 2004-04-14 00:00:26 | 26.48417 N, 71.74883 W | RRS Discovery D279 |
| 670170 | Currents -subsurface Eulerian | 2004-04-14 00:01:42 | 26.484 N, 71.74883 W | RRS Discovery D279 |
| 1261497 | Water sample data | 2004-04-14 00:51:00 | 26.48295 N, 71.75166 W | RRS Discovery D279 |
| 1058592 | CTD or STD cast | 2004-04-14 05:43:00 | 26.50817 N, 71.34333 W | RRS Discovery D279 |
| 1058611 | CTD or STD cast | 2004-04-14 11:50:00 | 26.49 N, 70.98683 W | RRS Discovery D279 |
| 1261504 | Water sample data | 2004-04-14 13:45:00 | 26.48999 N, 70.98682 W | RRS Discovery D279 |
| 1263719 | Water sample data | 2004-04-14 13:45:00 | 26.48999 N, 70.98682 W | RRS Discovery D279 |
| 1058623 | CTD or STD cast | 2004-04-14 18:37:00 | 26.13383 N, 70.60133 W | RRS Discovery D279 |
| 1261516 | Water sample data | 2004-04-14 20:27:00 | 26.1338 N, 70.60127 W | RRS Discovery D279 |
| 669365 | Currents -subsurface Eulerian | 2004-04-15 00:00:29 | 25.89667 N, 70.37383 W | RRS Discovery D279 |
| 670182 | Currents -subsurface Eulerian | 2004-04-15 00:01:46 | 25.89333 N, 70.371 W | RRS Discovery D279 |
| 1058635 | CTD or STD cast | 2004-04-15 01:16:00 | 25.76517 N, 70.23817 W | RRS Discovery D279 |
| 1261528 | Water sample data | 2004-04-15 03:02:00 | 25.7652 N, 70.23813 W | RRS Discovery D279 |
| 1058647 | CTD or STD cast | 2004-04-15 08:00:00 | 25.38033 N, 69.87733 W | RRS Discovery D279 |
| 1261541 | Water sample data | 2004-04-15 10:01:30 | 25.38039 N, 69.87737 W | RRS Discovery D279 |
| 1058659 | CTD or STD cast | 2004-04-15 15:03:00 | 25.00083 N, 69.50617 W | RRS Discovery D279 |
| 1261553 | Water sample data | 2004-04-15 17:03:00 | 25.00084 N, 69.50616 W | RRS Discovery D279 |
| 1263720 | Water sample data | 2004-04-15 17:03:00 | 25.00084 N, 69.50616 W | RRS Discovery D279 |
| 1058660 | CTD or STD cast | 2004-04-15 22:49:00 | 24.49417 N, 69.14683 W | RRS Discovery D279 |
| 669377 | Currents -subsurface Eulerian | 2004-04-16 00:00:30 | 24.49467 N, 69.144 W | RRS Discovery D279 |
| 670194 | Currents -subsurface Eulerian | 2004-04-16 00:01:50 | 24.49467 N, 69.14417 W | RRS Discovery D279 |
| 1261565 | Water sample data | 2004-04-16 00:38:30 | 24.49411 N, 69.14676 W | RRS Discovery D279 |
| 1058672 | CTD or STD cast | 2004-04-16 06:51:00 | 24.50883 N, 68.4135 W | RRS Discovery D279 |
| 1261577 | Water sample data | 2004-04-16 08:48:00 | 24.50879 N, 68.41349 W | RRS Discovery D279 |
| 1058684 | CTD or STD cast | 2004-04-16 14:59:00 | 24.51067 N, 67.67067 W | RRS Discovery D279 |
| 1261589 | Water sample data | 2004-04-16 16:45:30 | 24.51074 N, 67.67065 W | RRS Discovery D279 |
| 1058696 | CTD or STD cast | 2004-04-16 22:38:00 | 24.48733 N, 66.92317 W | RRS Discovery D279 |
| 669389 | Currents -subsurface Eulerian | 2004-04-17 00:00:33 | 24.48767 N, 66.924 W | RRS Discovery D279 |
| 670201 | Currents -subsurface Eulerian | 2004-04-17 00:01:56 | 24.48767 N, 66.92383 W | RRS Discovery D279 |
| 1261590 | Water sample data | 2004-04-17 00:27:00 | 24.4873 N, 66.92314 W | RRS Discovery D279 |
| 1058703 | CTD or STD cast | 2004-04-17 06:16:00 | 24.50283 N, 66.19233 W | RRS Discovery D279 |
| 1261608 | Water sample data | 2004-04-17 08:01:30 | 24.5029 N, 66.19226 W | RRS Discovery D279 |
| 1058715 | CTD or STD cast | 2004-04-17 13:46:00 | 24.49567 N, 65.4635 W | RRS Discovery D279 |
| 1261621 | Water sample data | 2004-04-17 15:33:30 | 24.49573 N, 65.46346 W | RRS Discovery D279 |
| 1263732 | Water sample data | 2004-04-17 15:33:30 | 24.49573 N, 65.46346 W | RRS Discovery D279 |
| 1058727 | CTD or STD cast | 2004-04-17 21:36:00 | 24.50917 N, 64.65933 W | RRS Discovery D279 |
| 1261633 | Water sample data | 2004-04-17 23:29:00 | 24.50919 N, 64.65941 W | RRS Discovery D279 |
| 669390 | Currents -subsurface Eulerian | 2004-04-18 00:00:37 | 24.51317 N, 64.6635 W | RRS Discovery D279 |
| 670213 | Currents -subsurface Eulerian | 2004-04-18 00:02:00 | 24.51317 N, 64.66367 W | RRS Discovery D279 |
| 1058739 | CTD or STD cast | 2004-04-18 05:20:00 | 24.49783 N, 64.00117 W | RRS Discovery D279 |
| 1261645 | Water sample data | 2004-04-18 07:09:00 | 24.49787 N, 64.00118 W | RRS Discovery D279 |
| 1058740 | CTD or STD cast | 2004-04-18 13:33:00 | 24.505 N, 63.268 W | RRS Discovery D279 |
| 1261657 | Water sample data | 2004-04-18 15:19:30 | 24.50496 N, 63.26804 W | RRS Discovery D279 |
| 1058752 | CTD or STD cast | 2004-04-18 21:28:00 | 24.504 N, 62.528 W | RRS Discovery D279 |
| 1261669 | Water sample data | 2004-04-18 23:19:30 | 24.50405 N, 62.52804 W | RRS Discovery D279 |
| 669408 | Currents -subsurface Eulerian | 2004-04-19 00:00:37 | 24.502 N, 62.53 W | RRS Discovery D279 |
| 670225 | Currents -subsurface Eulerian | 2004-04-19 00:02:05 | 24.502 N, 62.53 W | RRS Discovery D279 |
| 1058764 | CTD or STD cast | 2004-04-19 05:19:00 | 24.5075 N, 61.7985 W | RRS Discovery D279 |
| 1261670 | Water sample data | 2004-04-19 07:12:00 | 24.50751 N, 61.79844 W | RRS Discovery D279 |
| 1058776 | CTD or STD cast | 2004-04-19 13:06:00 | 24.50117 N, 61.063 W | RRS Discovery D279 |
| 1261682 | Water sample data | 2004-04-19 15:02:30 | 24.5012 N, 61.06298 W | RRS Discovery D279 |
| 1263744 | Water sample data | 2004-04-19 15:02:30 | 24.5012 N, 61.06298 W | RRS Discovery D279 |
| 1058788 | CTD or STD cast | 2004-04-19 21:00:00 | 24.512 N, 60.32317 W | RRS Discovery D279 |
| 1261694 | Water sample data | 2004-04-19 22:59:30 | 24.51196 N, 60.32312 W | RRS Discovery D279 |
| 669421 | Currents -subsurface Eulerian | 2004-04-20 00:00:40 | 24.522 N, 60.31867 W | RRS Discovery D279 |
| 670237 | Currents -subsurface Eulerian | 2004-04-20 00:02:09 | 24.52217 N, 60.3185 W | RRS Discovery D279 |
| 1058807 | CTD or STD cast | 2004-04-20 05:10:00 | 24.51533 N, 59.59183 W | RRS Discovery D279 |
| 1261701 | Water sample data | 2004-04-20 07:11:00 | 24.51532 N, 59.59186 W | RRS Discovery D279 |
| 1058819 | CTD or STD cast | 2004-04-20 13:18:00 | 24.49817 N, 58.85783 W | RRS Discovery D279 |
| 1261713 | Water sample data | 2004-04-20 15:19:30 | 24.49814 N, 58.85783 W | RRS Discovery D279 |
| 1058820 | CTD or STD cast | 2004-04-20 20:51:00 | 24.4995 N, 58.1325 W | RRS Discovery D279 |
| 1261725 | Water sample data | 2004-04-20 22:44:30 | 24.49944 N, 58.13257 W | RRS Discovery D279 |
| 669433 | Currents -subsurface Eulerian | 2004-04-21 00:00:40 | 24.497 N, 58.13167 W | RRS Discovery D279 |
| 670249 | Currents -subsurface Eulerian | 2004-04-21 00:02:15 | 24.49683 N, 58.13167 W | RRS Discovery D279 |
| 1058832 | CTD or STD cast | 2004-04-21 04:40:00 | 24.50217 N, 57.38867 W | RRS Discovery D279 |
| 1261737 | Water sample data | 2004-04-21 06:33:30 | 24.50212 N, 57.38867 W | RRS Discovery D279 |
| 1058844 | CTD or STD cast | 2004-04-21 12:35:00 | 24.49517 N, 56.66717 W | RRS Discovery D279 |
| 1261749 | Water sample data | 2004-04-21 14:28:00 | 24.49509 N, 56.66721 W | RRS Discovery D279 |
| 1263756 | Water sample data | 2004-04-21 14:28:00 | 24.49509 N, 56.66721 W | RRS Discovery D279 |
| 1058856 | CTD or STD cast | 2004-04-21 20:18:00 | 24.51683 N, 55.93533 W | RRS Discovery D279 |
| 1261750 | Water sample data | 2004-04-21 22:15:00 | 24.51691 N, 55.93536 W | RRS Discovery D279 |
| 669445 | Currents -subsurface Eulerian | 2004-04-22 00:00:44 | 24.53217 N, 55.943 W | RRS Discovery D279 |
| 670250 | Currents -subsurface Eulerian | 2004-04-22 00:02:19 | 24.5325 N, 55.94317 W | RRS Discovery D279 |
| 1058868 | CTD or STD cast | 2004-04-22 04:24:00 | 24.5045 N, 55.2125 W | RRS Discovery D279 |
| 1261762 | Water sample data | 2004-04-22 06:12:00 | 24.50449 N, 55.21244 W | RRS Discovery D279 |
| 1058881 | CTD or STD cast | 2004-04-22 12:13:00 | 24.49967 N, 54.47367 W | RRS Discovery D279 |
| 1261774 | Water sample data | 2004-04-22 13:59:30 | 24.49975 N, 54.47366 W | RRS Discovery D279 |
| 1263768 | Water sample data | 2004-04-22 13:59:30 | 24.49975 N, 54.47366 W | RRS Discovery D279 |
| 1058893 | CTD or STD cast | 2004-04-22 19:54:00 | 24.49433 N, 53.73617 W | RRS Discovery D279 |
| 1261786 | Water sample data | 2004-04-22 21:44:30 | 24.49426 N, 53.73616 W | RRS Discovery D279 |
| 669457 | Currents -subsurface Eulerian | 2004-04-23 00:00:45 | 24.49033 N, 53.71083 W | RRS Discovery D279 |
| 670262 | Currents -subsurface Eulerian | 2004-04-23 00:02:21 | 24.49083 N, 53.70517 W | RRS Discovery D279 |
| 1058900 | CTD or STD cast | 2004-04-23 02:54:00 | 24.49767 N, 53.17817 W | RRS Discovery D279 |
| 1261798 | Water sample data | 2004-04-23 04:51:30 | 24.49765 N, 53.17809 W | RRS Discovery D279 |
| 1058912 | CTD or STD cast | 2004-04-23 09:52:00 | 24.5045 N, 52.63733 W | RRS Discovery D279 |
| 1261805 | Water sample data | 2004-04-23 11:34:30 | 24.50445 N, 52.63738 W | RRS Discovery D279 |
| 1058924 | CTD or STD cast | 2004-04-23 16:06:00 | 24.49933 N, 52.1615 W | RRS Discovery D279 |
| 1261817 | Water sample data | 2004-04-23 17:41:30 | 24.49938 N, 52.16146 W | RRS Discovery D279 |
| 1263781 | Water sample data | 2004-04-23 17:41:30 | 24.49938 N, 52.16146 W | RRS Discovery D279 |
| 1058936 | CTD or STD cast | 2004-04-23 23:07:00 | 24.49967 N, 51.538 W | RRS Discovery D279 |
| 669469 | Currents -subsurface Eulerian | 2004-04-24 00:00:47 | 24.49883 N, 51.53633 W | RRS Discovery D279 |
| 670274 | Currents -subsurface Eulerian | 2004-04-24 00:02:26 | 24.499 N, 51.53633 W | RRS Discovery D279 |
| 1261829 | Water sample data | 2004-04-24 00:51:30 | 24.49971 N, 51.53798 W | RRS Discovery D279 |
| 1058948 | CTD or STD cast | 2004-04-24 05:59:00 | 24.50767 N, 50.997 W | RRS Discovery D279 |
| 1058961 | CTD or STD cast | 2004-04-24 13:03:00 | 24.4995 N, 50.44167 W | RRS Discovery D279 |
| 1261830 | Water sample data | 2004-04-24 14:37:30 | 24.49953 N, 50.44174 W | RRS Discovery D279 |
| 1263793 | Water sample data | 2004-04-24 14:37:30 | 24.49953 N, 50.44174 W | RRS Discovery D279 |
| 1058973 | CTD or STD cast | 2004-04-24 19:22:00 | 24.51017 N, 49.87517 W | RRS Discovery D279 |
| 1261842 | Water sample data | 2004-04-24 20:56:00 | 24.51019 N, 49.87516 W | RRS Discovery D279 |
| 669470 | Currents -subsurface Eulerian | 2004-04-25 00:00:47 | 24.50883 N, 49.63033 W | RRS Discovery D279 |
| 670286 | Currents -subsurface Eulerian | 2004-04-25 00:02:30 | 24.5085 N, 49.6245 W | RRS Discovery D279 |
| 1058985 | CTD or STD cast | 2004-04-25 01:47:00 | 24.50733 N, 49.334 W | RRS Discovery D279 |
| 1261854 | Water sample data | 2004-04-25 03:38:30 | 24.50729 N, 49.33404 W | RRS Discovery D279 |
| 1058997 | CTD or STD cast | 2004-04-25 08:42:00 | 24.49733 N, 48.77483 W | RRS Discovery D279 |
| 1261866 | Water sample data | 2004-04-25 10:15:30 | 24.49732 N, 48.7748 W | RRS Discovery D279 |
| 1059000 | CTD or STD cast | 2004-04-25 16:05:00 | 24.5055 N, 47.96267 W | RRS Discovery D279 |
| 1261878 | Water sample data | 2004-04-25 17:24:30 | 24.50545 N, 47.96263 W | RRS Discovery D279 |
| 1263800 | Water sample data | 2004-04-25 17:24:30 | 24.50545 N, 47.96263 W | RRS Discovery D279 |
| 1059012 | CTD or STD cast | 2004-04-25 23:23:00 | 24.49883 N, 47.12483 W | RRS Discovery D279 |
| 669482 | Currents -subsurface Eulerian | 2004-04-26 00:00:49 | 24.498 N, 47.12617 W | RRS Discovery D279 |
| 670298 | Currents -subsurface Eulerian | 2004-04-26 00:02:13 | 24.498 N, 47.12617 W | RRS Discovery D279 |
| 1261891 | Water sample data | 2004-04-26 00:40:00 | 24.49882 N, 47.1249 W | RRS Discovery D279 |
| 1059024 | CTD or STD cast | 2004-04-26 05:05:00 | 24.49583 N, 46.57467 W | RRS Discovery D279 |
| 1261909 | Water sample data | 2004-04-26 06:19:30 | 24.49575 N, 46.57467 W | RRS Discovery D279 |
| 1059036 | CTD or STD cast | 2004-04-26 10:29:00 | 24.4955 N, 46.0355 W | RRS Discovery D279 |
| 1261910 | Water sample data | 2004-04-26 11:31:30 | 24.49544 N, 46.03556 W | RRS Discovery D279 |
| 1059048 | CTD or STD cast | 2004-04-26 15:41:00 | 24.50483 N, 45.49033 W | RRS Discovery D279 |
| 1261922 | Water sample data | 2004-04-26 16:55:30 | 24.50475 N, 45.49031 W | RRS Discovery D279 |
| 1263812 | Water sample data | 2004-04-26 16:55:30 | 24.50475 N, 45.49031 W | RRS Discovery D279 |
| 1059061 | CTD or STD cast | 2004-04-26 21:27:00 | 24.48583 N, 44.94583 W | RRS Discovery D279 |
| 1261934 | Water sample data | 2004-04-26 22:40:30 | 24.48584 N, 44.94587 W | RRS Discovery D279 |
| 669494 | Currents -subsurface Eulerian | 2004-04-27 00:00:51 | 24.46567 N, 44.961 W | RRS Discovery D279 |
| 670305 | Currents -subsurface Eulerian | 2004-04-27 00:02:18 | 24.4655 N, 44.96133 W | RRS Discovery D279 |
| 1059073 | CTD or STD cast | 2004-04-27 03:29:00 | 24.502 N, 44.3955 W | RRS Discovery D279 |
| 1261946 | Water sample data | 2004-04-27 04:47:00 | 24.50196 N, 44.39555 W | RRS Discovery D279 |
| 1059085 | CTD or STD cast | 2004-04-27 09:26:00 | 24.50033 N, 43.84383 W | RRS Discovery D279 |
| 1261958 | Water sample data | 2004-04-27 10:43:30 | 24.50028 N, 43.84384 W | RRS Discovery D279 |
| 1059097 | CTD or STD cast | 2004-04-27 16:18:00 | 24.5095 N, 43.00717 W | RRS Discovery D279 |
| 1261971 | Water sample data | 2004-04-27 17:48:00 | 24.50957 N, 43.00718 W | RRS Discovery D279 |
| 1263824 | Water sample data | 2004-04-27 17:48:00 | 24.50957 N, 43.00718 W | RRS Discovery D279 |
| 1059104 | CTD or STD cast | 2004-04-27 23:41:00 | 24.499 N, 42.18417 W | RRS Discovery D279 |
| 669501 | Currents -subsurface Eulerian | 2004-04-28 00:00:54 | 24.49883 N, 42.17967 W | RRS Discovery D279 |
| 670317 | Currents -subsurface Eulerian | 2004-04-28 00:02:23 | 24.499 N, 42.17967 W | RRS Discovery D279 |
| 1261983 | Water sample data | 2004-04-28 01:14:00 | 24.49908 N, 42.18412 W | RRS Discovery D279 |
| 1059116 | CTD or STD cast | 2004-04-28 06:08:00 | 24.50867 N, 41.63983 W | RRS Discovery D279 |
| 1261995 | Water sample data | 2004-04-28 07:35:30 | 24.50871 N, 41.63991 W | RRS Discovery D279 |
| 1263836 | Water sample data | 2004-04-28 07:35:30 | 24.50871 N, 41.63991 W | RRS Discovery D279 |
| 1059128 | CTD or STD cast | 2004-04-28 12:30:00 | 24.50317 N, 41.09183 W | RRS Discovery D279 |
| 1262009 | Water sample data | 2004-04-28 14:05:00 | 24.50313 N, 41.0919 W | RRS Discovery D279 |
| 1059141 | CTD or STD cast | 2004-04-28 20:10:00 | 24.51183 N, 40.2815 W | RRS Discovery D279 |
| 1262010 | Water sample data | 2004-04-28 21:41:30 | 24.51178 N, 40.28147 W | RRS Discovery D279 |
| 669513 | Currents -subsurface Eulerian | 2004-04-29 00:00:56 | 24.50817 N, 40.17767 W | RRS Discovery D279 |
| 670329 | Currents -subsurface Eulerian | 2004-04-29 00:02:26 | 24.50783 N, 40.17283 W | RRS Discovery D279 |
| 1059153 | CTD or STD cast | 2004-04-29 05:12:00 | 24.49767 N, 39.245 W | RRS Discovery D279 |
| 1262022 | Water sample data | 2004-04-29 06:52:30 | 24.49775 N, 39.24506 W | RRS Discovery D279 |
| 1059165 | CTD or STD cast | 2004-04-29 12:35:00 | 24.499 N, 38.5235 W | RRS Discovery D279 |
| 1262034 | Water sample data | 2004-04-29 13:53:30 | 24.49894 N, 38.52354 W | RRS Discovery D279 |
| 1263848 | Water sample data | 2004-04-29 13:53:30 | 24.49894 N, 38.52354 W | RRS Discovery D279 |
| 1059177 | CTD or STD cast | 2004-04-29 19:58:00 | 24.499 N, 37.69517 W | RRS Discovery D279 |
| 1262046 | Water sample data | 2004-04-29 21:40:00 | 24.49908 N, 37.69516 W | RRS Discovery D279 |
| 669525 | Currents -subsurface Eulerian | 2004-04-30 00:00:57 | 24.49667 N, 37.63267 W | RRS Discovery D279 |
| 670330 | Currents -subsurface Eulerian | 2004-04-30 00:02:31 | 24.497 N, 37.62767 W | RRS Discovery D279 |
| 1059189 | CTD or STD cast | 2004-04-30 04:00:00 | 24.4895 N, 36.88 W | RRS Discovery D279 |
| 1262058 | Water sample data | 2004-04-30 05:32:30 | 24.48948 N, 36.87996 W | RRS Discovery D279 |
| 1059190 | CTD or STD cast | 2004-04-30 11:34:00 | 24.49267 N, 36.04583 W | RRS Discovery D279 |
| 1262071 | Water sample data | 2004-04-30 13:16:30 | 24.49267 N, 36.04583 W | RRS Discovery D279 |
| 1059208 | CTD or STD cast | 2004-04-30 19:27:00 | 24.5045 N, 35.22867 W | RRS Discovery D279 |
| 1262083 | Water sample data | 2004-04-30 21:01:00 | 24.50443 N, 35.22859 W | RRS Discovery D279 |
| 1263861 | Water sample data | 2004-04-30 21:01:00 | 24.50443 N, 35.22859 W | RRS Discovery D279 |
| 669537 | Currents -subsurface Eulerian | 2004-05-01 00:01:01 | 24.50583 N, 34.99483 W | RRS Discovery D279 |
| 670342 | Currents -subsurface Eulerian | 2004-05-01 00:02:37 | 24.5055 N, 34.98917 W | RRS Discovery D279 |
| 1059221 | CTD or STD cast | 2004-05-01 03:08:00 | 24.49567 N, 34.38933 W | RRS Discovery D279 |
| 1262095 | Water sample data | 2004-05-01 04:39:00 | 24.49572 N, 34.38929 W | RRS Discovery D279 |
| 1059233 | CTD or STD cast | 2004-05-01 10:19:00 | 24.49917 N, 33.57333 W | RRS Discovery D279 |
| 1262102 | Water sample data | 2004-05-01 12:02:30 | 24.49909 N, 33.57325 W | RRS Discovery D279 |
| 1263873 | Water sample data | 2004-05-01 12:02:30 | 24.49909 N, 33.57325 W | RRS Discovery D279 |
| 1059245 | CTD or STD cast | 2004-05-01 18:36:00 | 24.50967 N, 32.65717 W | RRS Discovery D279 |
| 1262114 | Water sample data | 2004-05-01 20:20:00 | 24.50971 N, 32.6571 W | RRS Discovery D279 |
| 669549 | Currents -subsurface Eulerian | 2004-05-02 00:01:01 | 24.50667 N, 32.324 W | RRS Discovery D279 |
| 670354 | Currents -subsurface Eulerian | 2004-05-02 00:02:39 | 24.50667 N, 32.3185 W | RRS Discovery D279 |
| 1059257 | CTD or STD cast | 2004-05-02 03:05:00 | 24.4995 N, 31.73083 W | RRS Discovery D279 |
| 1262126 | Water sample data | 2004-05-02 04:51:30 | 24.49957 N, 31.73084 W | RRS Discovery D279 |
| 1059269 | CTD or STD cast | 2004-05-02 11:21:00 | 24.49517 N, 30.81267 W | RRS Discovery D279 |
| 1262138 | Water sample data | 2004-05-02 12:57:30 | 24.49512 N, 30.8127 W | RRS Discovery D279 |
| 1059270 | CTD or STD cast | 2004-05-02 19:32:00 | 24.5015 N, 29.89 W | RRS Discovery D279 |
| 1262151 | Water sample data | 2004-05-02 21:17:30 | 24.50153 N, 29.89004 W | RRS Discovery D279 |
| 1263885 | Water sample data | 2004-05-02 21:17:30 | 24.50153 N, 29.89004 W | RRS Discovery D279 |
| 669550 | Currents -subsurface Eulerian | 2004-05-03 00:01:02 | 24.502 N, 29.71967 W | RRS Discovery D279 |
| 670366 | Currents -subsurface Eulerian | 2004-05-03 00:01:05 | 24.502 N, 29.7195 W | RRS Discovery D279 |
| 1059282 | CTD or STD cast | 2004-05-03 03:53:00 | 24.50283 N, 28.98767 W | RRS Discovery D279 |
| 1262163 | Water sample data | 2004-05-03 05:31:00 | 24.50279 N, 28.98761 W | RRS Discovery D279 |
| 1059294 | CTD or STD cast | 2004-05-03 12:04:00 | 24.50117 N, 28.06867 W | RRS Discovery D279 |
| 1262175 | Water sample data | 2004-05-03 13:40:30 | 24.50125 N, 28.06863 W | RRS Discovery D279 |
| 1263897 | Water sample data | 2004-05-03 13:40:30 | 24.50125 N, 28.06863 W | RRS Discovery D279 |
| 1059301 | CTD or STD cast | 2004-05-03 20:13:00 | 24.51183 N, 27.1485 W | RRS Discovery D279 |
| 1262187 | Water sample data | 2004-05-03 21:51:00 | 24.51183 N, 27.14855 W | RRS Discovery D279 |
| 669562 | Currents -subsurface Eulerian | 2004-05-04 00:01:08 | 24.52783 N, 27.0845 W | RRS Discovery D279 |
| 670378 | Currents -subsurface Eulerian | 2004-05-04 00:01:10 | 24.52783 N, 27.0845 W | RRS Discovery D279 |
| 1059313 | CTD or STD cast | 2004-05-04 04:27:00 | 24.499 N, 26.23133 W | RRS Discovery D279 |
| 1262199 | Water sample data | 2004-05-04 06:00:30 | 24.49902 N, 26.23132 W | RRS Discovery D279 |
| 1263904 | Water sample data | 2004-05-04 06:00:30 | 24.49902 N, 26.23132 W | RRS Discovery D279 |
| 1059325 | CTD or STD cast | 2004-05-04 12:13:00 | 24.50117 N, 25.31767 W | RRS Discovery D279 |
| 1262206 | Water sample data | 2004-05-04 13:41:00 | 24.50115 N, 25.31769 W | RRS Discovery D279 |
| 1059337 | CTD or STD cast | 2004-05-04 20:22:00 | 24.49533 N, 24.404 W | RRS Discovery D279 |
| 1262218 | Water sample data | 2004-05-04 21:53:00 | 24.49529 N, 24.40399 W | RRS Discovery D279 |
| 669574 | Currents -subsurface Eulerian | 2004-05-05 00:01:06 | 24.4945 N, 24.3445 W | RRS Discovery D279 |
| 670391 | Currents -subsurface Eulerian | 2004-05-05 00:01:14 | 24.49467 N, 24.34417 W | RRS Discovery D279 |
| 1059349 | CTD or STD cast | 2004-05-05 04:31:00 | 24.51333 N, 23.49467 W | RRS Discovery D279 |
| 1262231 | Water sample data | 2004-05-05 05:59:00 | 24.51341 N, 23.49472 W | RRS Discovery D279 |
| 1059350 | CTD or STD cast | 2004-05-05 11:36:00 | 24.73817 N, 22.82233 W | RRS Discovery D279 |
| 1262243 | Water sample data | 2004-05-05 13:00:30 | 24.73816 N, 22.82232 W | RRS Discovery D279 |
| 1263916 | Water sample data | 2004-05-05 13:00:30 | 24.73816 N, 22.82232 W | RRS Discovery D279 |
| 1059362 | CTD or STD cast | 2004-05-05 18:40:00 | 24.985 N, 22.1485 W | RRS Discovery D279 |
| 1262255 | Water sample data | 2004-05-05 20:05:30 | 24.98499 N, 22.14856 W | RRS Discovery D279 |
| 669586 | Currents -subsurface Eulerian | 2004-05-06 00:01:10 | 25.13767 N, 21.69683 W | RRS Discovery D279 |
| 670409 | Currents -subsurface Eulerian | 2004-05-06 00:01:18 | 25.13783 N, 21.69633 W | RRS Discovery D279 |
| 1059374 | CTD or STD cast | 2004-05-06 01:18:00 | 25.22167 N, 21.47767 W | RRS Discovery D279 |
| 1262267 | Water sample data | 2004-05-06 02:48:30 | 25.22166 N, 21.47765 W | RRS Discovery D279 |
| 1059386 | CTD or STD cast | 2004-05-06 08:20:00 | 25.45017 N, 20.8045 W | RRS Discovery D279 |
| 1262279 | Water sample data | 2004-05-06 09:49:00 | 25.4502 N, 20.80444 W | RRS Discovery D279 |
| 1059398 | CTD or STD cast | 2004-05-06 16:19:00 | 25.64983 N, 20.24267 W | RRS Discovery D279 |
| 1262280 | Water sample data | 2004-05-06 17:37:00 | 25.64986 N, 20.24262 W | RRS Discovery D279 |
| 1263928 | Water sample data | 2004-05-06 17:37:00 | 25.64986 N, 20.24262 W | RRS Discovery D279 |
| 669598 | Currents -subsurface Eulerian | 2004-05-07 00:01:11 | 25.93033 N, 19.48033 W | RRS Discovery D279 |
| 670410 | Currents -subsurface Eulerian | 2004-05-07 00:01:22 | 25.9305 N, 19.48033 W | RRS Discovery D279 |
| 1059405 | CTD or STD cast | 2004-05-07 07:40:00 | 25.92033 N, 19.48617 W | RRS Discovery D279 |
| 1262292 | Water sample data | 2004-05-07 08:55:30 | 25.9204 N, 19.48611 W | RRS Discovery D279 |
| 1059417 | CTD or STD cast | 2004-05-07 13:35:00 | 26.13367 N, 18.90983 W | RRS Discovery D279 |
| 1262311 | Water sample data | 2004-05-07 14:36:00 | 26.13359 N, 18.90979 W | RRS Discovery D279 |
| 1263941 | Water sample data | 2004-05-07 14:36:00 | 26.13359 N, 18.90979 W | RRS Discovery D279 |
| 1059429 | CTD or STD cast | 2004-05-07 20:00:00 | 26.3855 N, 18.16067 W | RRS Discovery D279 |
| 1262323 | Water sample data | 2004-05-07 21:09:00 | 26.38548 N, 18.16072 W | RRS Discovery D279 |
| 669605 | Currents -subsurface Eulerian | 2004-05-08 00:01:14 | 26.47383 N, 17.85767 W | RRS Discovery D279 |
| 670422 | Currents -subsurface Eulerian | 2004-05-08 00:01:27 | 26.474 N, 17.85683 W | RRS Discovery D279 |
| 1059430 | CTD or STD cast | 2004-05-08 02:09:00 | 26.5965 N, 17.469 W | RRS Discovery D279 |
| 1262335 | Water sample data | 2004-05-08 03:19:30 | 26.59654 N, 17.46892 W | RRS Discovery D279 |
| 1059442 | CTD or STD cast | 2004-05-08 08:25:00 | 26.8145 N, 16.7845 W | RRS Discovery D279 |
| 1262347 | Water sample data | 2004-05-08 09:35:00 | 26.81446 N, 16.78454 W | RRS Discovery D279 |
| 1059454 | CTD or STD cast | 2004-05-08 15:31:00 | 27.04317 N, 16.122 W | RRS Discovery D279 |
| 1262359 | Water sample data | 2004-05-08 16:36:30 | 27.04313 N, 16.12192 W | RRS Discovery D279 |
| 1263953 | Water sample data | 2004-05-08 16:36:30 | 27.04313 N, 16.12192 W | RRS Discovery D279 |
| 1059466 | CTD or STD cast | 2004-05-08 20:50:00 | 27.2335 N, 15.59217 W | RRS Discovery D279 |
| 1262360 | Water sample data | 2004-05-08 21:49:30 | 27.23351 N, 15.59212 W | RRS Discovery D279 |
| 669617 | Currents -subsurface Eulerian | 2004-05-09 00:01:17 | 27.283 N, 15.4135 W | RRS Discovery D279 |
| 670434 | Currents -subsurface Eulerian | 2004-05-09 00:01:31 | 27.28317 N, 15.41283 W | RRS Discovery D279 |
| 1059478 | CTD or STD cast | 2004-05-09 03:15:00 | 27.43333 N, 14.86033 W | RRS Discovery D279 |
| 1262372 | Water sample data | 2004-05-09 04:03:30 | 27.43333 N, 14.86033 W | RRS Discovery D279 |
| 1059491 | CTD or STD cast | 2004-05-09 08:34:00 | 27.62067 N, 14.22867 W | RRS Discovery D279 |
| 1262384 | Water sample data | 2004-05-09 09:15:30 | 27.62067 N, 14.2287 W | RRS Discovery D279 |
| 1059509 | CTD or STD cast | 2004-05-09 12:38:00 | 27.82917 N, 13.8175 W | RRS Discovery D279 |
| 1262396 | Water sample data | 2004-05-09 13:06:30 | 27.82909 N, 13.81754 W | RRS Discovery D279 |
| 1058149 | CTD or STD cast | 2004-05-09 15:21:00 | 27.8525 N, 13.551 W | RRS Discovery D279 |
| 1262403 | Water sample data | 2004-05-09 15:48:00 | 27.85246 N, 13.55102 W | RRS Discovery D279 |
| 1058150 | CTD or STD cast | 2004-05-09 17:16:00 | 27.88 N, 13.42 W | RRS Discovery D279 |
| 1262415 | Water sample data | 2004-05-09 17:33:30 | 27.88 N, 13.41992 W | RRS Discovery D279 |
| 1058162 | CTD or STD cast | 2004-05-09 18:38:00 | 27.91583 N, 13.37383 W | RRS Discovery D279 |
| 1262427 | Water sample data | 2004-05-09 18:50:00 | 27.91582 N, 13.37385 W | RRS Discovery D279 |
| 1193136 | Currents -subsurface Eulerian | 2010-01-06 07:37:25 | 26.6371 N, 79.0754 W | RRS Discovery D346 |
| 1028897 | Currents -subsurface Eulerian | 2010-01-06 07:39:35 | 26.6414 N, 79.0798 W | RRS Discovery D346 |
| 1016859 | CTD or STD cast | 2010-01-06 16:49:44 | 27.835 N, 78.8402 W | RRS Discovery D346 |
| 1016860 | CTD or STD cast | 2010-01-07 04:19:57 | 27.3382 N, 79.9475 W | RRS Discovery D346 |
| 1342255 | Water sample data | 2010-01-07 04:31:30 | 27.33804 N, 79.9478 W | RRS Discovery D346 |
| 1344298 | Water sample data | 2010-01-07 04:31:30 | 27.33804 N, 79.9478 W | RRS Discovery D346 |
| 1016872 | CTD or STD cast | 2010-01-07 05:54:33 | 27.3456 N, 79.8516 W | RRS Discovery D346 |
| 1342267 | Water sample data | 2010-01-07 06:10:30 | 27.34605 N, 79.85183 W | RRS Discovery D346 |
| 1344305 | Water sample data | 2010-01-07 06:10:30 | 27.34605 N, 79.85183 W | RRS Discovery D346 |
| 1016884 | CTD or STD cast | 2010-01-07 07:51:44 | 27.3518 N, 79.7548 W | RRS Discovery D346 |
| 1342279 | Water sample data | 2010-01-07 08:15:30 | 27.35158 N, 79.75398 W | RRS Discovery D346 |
| 1344317 | Water sample data | 2010-01-07 08:15:30 | 27.35158 N, 79.75398 W | RRS Discovery D346 |
| 1016896 | CTD or STD cast | 2010-01-07 10:04:16 | 27.3402 N, 79.6742 W | RRS Discovery D346 |
| 1342280 | Water sample data | 2010-01-07 10:33:00 | 27.34112 N, 79.67438 W | RRS Discovery D346 |
| 1344329 | Water sample data | 2010-01-07 10:33:00 | 27.34112 N, 79.67438 W | RRS Discovery D346 |
| 1016903 | CTD or STD cast | 2010-01-07 12:41:28 | 27.344 N, 79.5779 W | RRS Discovery D346 |
| 1342292 | Water sample data | 2010-01-07 13:18:00 | 27.34423 N, 79.57801 W | RRS Discovery D346 |
| 1344330 | Water sample data | 2010-01-07 13:18:00 | 27.34423 N, 79.57801 W | RRS Discovery D346 |
| 1016915 | CTD or STD cast | 2010-01-07 15:33:24 | 27.3443 N, 79.5024 W | RRS Discovery D346 |
| 1342311 | Water sample data | 2010-01-07 15:59:30 | 27.34771 N, 79.50364 W | RRS Discovery D346 |
| 1344342 | Water sample data | 2010-01-07 15:59:30 | 27.34771 N, 79.50364 W | RRS Discovery D346 |
| 1016927 | CTD or STD cast | 2010-01-07 17:53:11 | 27.3472 N, 79.4168 W | RRS Discovery D346 |
| 1342323 | Water sample data | 2010-01-07 18:27:30 | 27.35106 N, 79.41633 W | RRS Discovery D346 |
| 1344354 | Water sample data | 2010-01-07 18:27:30 | 27.35106 N, 79.41633 W | RRS Discovery D346 |
| 1016939 | CTD or STD cast | 2010-01-07 20:23:31 | 27.3335 N, 79.3357 W | RRS Discovery D346 |
| 1342335 | Water sample data | 2010-01-07 20:48:30 | 27.33586 N, 79.33549 W | RRS Discovery D346 |
| 1344366 | Water sample data | 2010-01-07 20:48:30 | 27.33586 N, 79.33549 W | RRS Discovery D346 |
| 1016940 | CTD or STD cast | 2010-01-07 22:31:48 | 27.3323 N, 79.2504 W | RRS Discovery D346 |
| 1342347 | Water sample data | 2010-01-07 22:49:00 | 27.3329 N, 79.25042 W | RRS Discovery D346 |
| 1016952 | CTD or STD cast | 2010-01-08 00:16:51 | 27.3352 N, 79.2083 W | RRS Discovery D346 |
| 1342359 | Water sample data | 2010-01-08 00:34:30 | 27.3349 N, 79.20777 W | RRS Discovery D346 |
| 1344378 | Water sample data | 2010-01-08 00:34:30 | 27.3349 N, 79.20777 W | RRS Discovery D346 |
| 1016964 | CTD or STD cast | 2010-01-08 02:04:45 | 27.3382 N, 79.1836 W | RRS Discovery D346 |
| 1342360 | Water sample data | 2010-01-08 02:16:30 | 27.3387 N, 79.18341 W | RRS Discovery D346 |
| 1344391 | Water sample data | 2010-01-08 02:16:30 | 27.3387 N, 79.18341 W | RRS Discovery D346 |
| 1016976 | CTD or STD cast | 2010-01-08 04:01:57 | 27.3347 N, 79.1742 W | RRS Discovery D346 |
| 1344409 | Water sample data | 2010-01-08 04:09:30 | 27.33507 N, 79.17418 W | RRS Discovery D346 |
| 1016988 | CTD or STD cast | 2010-01-08 18:54:09 | 26.5012 N, 76.9342 W | RRS Discovery D346 |
| 1342372 | Water sample data | 2010-01-08 19:09:30 | 26.50108 N, 76.93452 W | RRS Discovery D346 |
| 1344410 | Water sample data | 2010-01-08 19:09:30 | 26.50108 N, 76.93452 W | RRS Discovery D346 |
| 1017003 | CTD or STD cast | 2010-01-08 20:35:52 | 26.4989 N, 76.8648 W | RRS Discovery D346 |
| 1342384 | Water sample data | 2010-01-08 21:21:30 | 26.4984 N, 76.86464 W | RRS Discovery D346 |
| 1344422 | Water sample data | 2010-01-08 21:21:30 | 26.4984 N, 76.86464 W | RRS Discovery D346 |
| 1017015 | CTD or STD cast | 2010-01-08 23:27:40 | 26.5328 N, 76.8162 W | RRS Discovery D346 |
| 1344434 | Water sample data | 2010-01-09 00:28:30 | 26.53293 N, 76.81668 W | RRS Discovery D346 |
| 1017027 | CTD or STD cast | 2010-01-09 03:13:18 | 26.5032 N, 76.7821 W | RRS Discovery D346 |
| 1342396 | Water sample data | 2010-01-09 04:19:00 | 26.50393 N, 76.78135 W | RRS Discovery D346 |
| 1344446 | Water sample data | 2010-01-09 04:19:00 | 26.50393 N, 76.78135 W | RRS Discovery D346 |
| 1017039 | CTD or STD cast | 2010-01-09 06:55:58 | 26.4988 N, 76.8008 W | RRS Discovery D346 |
| 1344458 | Water sample data | 2010-01-09 07:51:30 | 26.49865 N, 76.80089 W | RRS Discovery D346 |
| 1017040 | CTD or STD cast | 2010-01-09 10:02:51 | 26.4957 N, 76.7613 W | RRS Discovery D346 |
| 1342403 | Water sample data | 2010-01-09 12:03:30 | 26.49469 N, 76.76098 W | RRS Discovery D346 |
| 1344471 | Water sample data | 2010-01-09 12:03:30 | 26.49469 N, 76.76098 W | RRS Discovery D346 |
| 1017052 | CTD or STD cast | 2010-01-09 16:12:40 | 26.4992 N, 76.6826 W | RRS Discovery D346 |
| 1342415 | Water sample data | 2010-01-09 18:20:00 | 26.49875 N, 76.68424 W | RRS Discovery D346 |
| 1344483 | Water sample data | 2010-01-09 18:20:00 | 26.49875 N, 76.68424 W | RRS Discovery D346 |
| 1017064 | CTD or STD cast | 2010-01-09 23:15:14 | 26.4971 N, 76.6298 W | RRS Discovery D346 |
| 1342427 | Water sample data | 2010-01-10 01:14:30 | 26.49684 N, 76.62938 W | RRS Discovery D346 |
| 1344495 | Water sample data | 2010-01-10 01:14:30 | 26.49684 N, 76.62938 W | RRS Discovery D346 |
| 1017076 | CTD or STD cast | 2010-01-10 05:21:19 | 26.4961 N, 76.5379 W | RRS Discovery D346 |
| 1342439 | Water sample data | 2010-01-10 07:12:00 | 26.49494 N, 76.53818 W | RRS Discovery D346 |
| 1344502 | Water sample data | 2010-01-10 07:12:00 | 26.49494 N, 76.53818 W | RRS Discovery D346 |
| 1017088 | CTD or STD cast | 2010-01-10 13:48:19 | 26.4837 N, 76.4433 W | RRS Discovery D346 |
| 1342440 | Water sample data | 2010-01-10 15:48:00 | 26.48189 N, 76.44609 W | RRS Discovery D346 |
| 1344514 | Water sample data | 2010-01-10 15:48:00 | 26.48189 N, 76.44609 W | RRS Discovery D346 |
| 1017107 | CTD or STD cast | 2010-01-10 19:47:24 | 26.4959 N, 76.3029 W | RRS Discovery D346 |
| 1342452 | Water sample data | 2010-01-10 21:51:30 | 26.49375 N, 76.30589 W | RRS Discovery D346 |
| 1344526 | Water sample data | 2010-01-10 21:51:30 | 26.49375 N, 76.30589 W | RRS Discovery D346 |
| 1017119 | CTD or STD cast | 2010-01-11 01:49:13 | 26.4871 N, 76.2249 W | RRS Discovery D346 |
| 1342464 | Water sample data | 2010-01-11 03:50:00 | 26.48586 N, 76.22706 W | RRS Discovery D346 |
| 1344538 | Water sample data | 2010-01-11 03:50:00 | 26.48586 N, 76.22706 W | RRS Discovery D346 |
| 1017120 | CTD or STD cast | 2010-01-11 13:50:38 | 26.4958 N, 76.1087 W | RRS Discovery D346 |
| 1344551 | Water sample data | 2010-01-11 15:47:30 | 26.49558 N, 76.10989 W | RRS Discovery D346 |
| 1017132 | CTD or STD cast | 2010-01-11 19:54:21 | 26.5018 N, 75.9088 W | RRS Discovery D346 |
| 1342488 | Water sample data | 2010-01-11 21:55:00 | 26.5022 N, 75.91209 W | RRS Discovery D346 |
| 1344563 | Water sample data | 2010-01-11 21:55:00 | 26.5022 N, 75.91209 W | RRS Discovery D346 |
| 1017144 | CTD or STD cast | 2010-01-12 02:11:17 | 26.4985 N, 75.726 W | RRS Discovery D346 |
| 1342507 | Water sample data | 2010-01-12 04:02:00 | 26.49871 N, 75.72734 W | RRS Discovery D346 |
| 1344575 | Water sample data | 2010-01-12 04:02:00 | 26.49871 N, 75.72734 W | RRS Discovery D346 |
| 1017156 | CTD or STD cast | 2010-01-12 07:56:03 | 26.5005 N, 75.5089 W | RRS Discovery D346 |
| 1342519 | Water sample data | 2010-01-12 09:46:00 | 26.49974 N, 75.51019 W | RRS Discovery D346 |
| 1344587 | Water sample data | 2010-01-12 09:46:00 | 26.49974 N, 75.51019 W | RRS Discovery D346 |
| 1017168 | CTD or STD cast | 2010-01-12 13:26:37 | 26.4969 N, 75.312 W | RRS Discovery D346 |
| 1342520 | Water sample data | 2010-01-12 15:19:30 | 26.49867 N, 75.31252 W | RRS Discovery D346 |
| 1344599 | Water sample data | 2010-01-12 15:19:30 | 26.49867 N, 75.31252 W | RRS Discovery D346 |
| 1017181 | CTD or STD cast | 2010-01-12 19:12:23 | 26.5032 N, 75.0731 W | RRS Discovery D346 |
| 1342532 | Water sample data | 2010-01-12 21:02:00 | 26.50328 N, 75.07471 W | RRS Discovery D346 |
| 1344606 | Water sample data | 2010-01-12 21:02:00 | 26.50328 N, 75.07471 W | RRS Discovery D346 |
| 1017193 | CTD or STD cast | 2010-01-13 00:51:19 | 26.4966 N, 74.8041 W | RRS Discovery D346 |
| 1342544 | Water sample data | 2010-01-13 02:44:00 | 26.4942 N, 74.80497 W | RRS Discovery D346 |
| 1344618 | Water sample data | 2010-01-13 02:44:00 | 26.4942 N, 74.80497 W | RRS Discovery D346 |
| 1017200 | CTD or STD cast | 2010-01-13 06:37:22 | 26.498 N, 74.5169 W | RRS Discovery D346 |
| 1342556 | Water sample data | 2010-01-13 08:23:30 | 26.49863 N, 74.51781 W | RRS Discovery D346 |
| 1344631 | Water sample data | 2010-01-13 08:23:30 | 26.49863 N, 74.51781 W | RRS Discovery D346 |
| 1017212 | CTD or STD cast | 2010-01-13 12:17:23 | 26.498 N, 74.2419 W | RRS Discovery D346 |
| 1342568 | Water sample data | 2010-01-13 14:01:30 | 26.49713 N, 74.24363 W | RRS Discovery D346 |
| 1344643 | Water sample data | 2010-01-13 14:01:30 | 26.49713 N, 74.24363 W | RRS Discovery D346 |
| 1017224 | CTD or STD cast | 2010-01-13 18:01:56 | 26.5031 N, 73.9388 W | RRS Discovery D346 |
| 1342581 | Water sample data | 2010-01-13 19:54:30 | 26.5028 N, 73.94002 W | RRS Discovery D346 |
| 1344655 | Water sample data | 2010-01-13 19:54:30 | 26.5028 N, 73.94002 W | RRS Discovery D346 |
| 1017236 | CTD or STD cast | 2010-01-14 00:23:58 | 26.5164 N, 73.5857 W | RRS Discovery D346 |
| 1342593 | Water sample data | 2010-01-14 02:18:30 | 26.51838 N, 73.58549 W | RRS Discovery D346 |
| 1344667 | Water sample data | 2010-01-14 02:18:30 | 26.51838 N, 73.58549 W | RRS Discovery D346 |
| 1017248 | CTD or STD cast | 2010-01-14 07:00:21 | 26.5102 N, 73.2055 W | RRS Discovery D346 |
| 1342600 | Water sample data | 2010-01-14 08:53:00 | 26.51268 N, 73.20587 W | RRS Discovery D346 |
| 1344679 | Water sample data | 2010-01-14 08:53:00 | 26.51268 N, 73.20587 W | RRS Discovery D346 |
| 1017261 | CTD or STD cast | 2010-01-14 13:20:01 | 26.5059 N, 72.8415 W | RRS Discovery D346 |
| 1342612 | Water sample data | 2010-01-14 15:19:00 | 26.50665 N, 72.84284 W | RRS Discovery D346 |
| 1017273 | CTD or STD cast | 2010-01-14 20:04:06 | 26.5077 N, 72.4638 W | RRS Discovery D346 |
| 1342624 | Water sample data | 2010-01-14 22:06:30 | 26.51143 N, 72.46429 W | RRS Discovery D346 |
| 1344680 | Water sample data | 2010-01-14 22:06:30 | 26.51143 N, 72.46429 W | RRS Discovery D346 |
| 1017285 | CTD or STD cast | 2010-01-15 02:45:17 | 26.5136 N, 72.1067 W | RRS Discovery D346 |
| 1342636 | Water sample data | 2010-01-15 04:48:30 | 26.51372 N, 72.10567 W | RRS Discovery D346 |
| 1344692 | Water sample data | 2010-01-15 04:48:30 | 26.51372 N, 72.10567 W | RRS Discovery D346 |
| 1017297 | CTD or STD cast | 2010-01-15 09:36:12 | 26.5137 N, 71.7189 W | RRS Discovery D346 |
| 1342648 | Water sample data | 2010-01-15 11:55:30 | 26.51671 N, 71.71356 W | RRS Discovery D346 |
| 1344711 | Water sample data | 2010-01-15 11:55:30 | 26.51671 N, 71.71356 W | RRS Discovery D346 |
| 1017304 | CTD or STD cast | 2010-01-15 16:39:02 | 26.4959 N, 71.3615 W | RRS Discovery D346 |
| 1342661 | Water sample data | 2010-01-15 18:41:00 | 26.49692 N, 71.36012 W | RRS Discovery D346 |
| 1344723 | Water sample data | 2010-01-15 18:41:00 | 26.49692 N, 71.36012 W | RRS Discovery D346 |
| 1017316 | CTD or STD cast | 2010-01-15 23:14:46 | 26.4757 N, 71.0042 W | RRS Discovery D346 |
| 1342673 | Water sample data | 2010-01-16 01:28:30 | 26.47532 N, 71.0031 W | RRS Discovery D346 |
| 1344735 | Water sample data | 2010-01-16 01:28:30 | 26.47532 N, 71.0031 W | RRS Discovery D346 |
| 1017328 | CTD or STD cast | 2010-01-16 07:15:08 | 26.1026 N, 70.6338 W | RRS Discovery D346 |
| 1342685 | Water sample data | 2010-01-16 09:28:00 | 26.10572 N, 70.63513 W | RRS Discovery D346 |
| 1344747 | Water sample data | 2010-01-16 09:28:00 | 26.10572 N, 70.63513 W | RRS Discovery D346 |
| 1017341 | CTD or STD cast | 2010-01-16 15:26:34 | 25.699 N, 70.2657 W | RRS Discovery D346 |
| 1342697 | Water sample data | 2010-01-16 17:30:00 | 25.69979 N, 70.26573 W | RRS Discovery D346 |
| 1344759 | Water sample data | 2010-01-16 17:30:00 | 25.69979 N, 70.26573 W | RRS Discovery D346 |
| 1017353 | CTD or STD cast | 2010-01-16 23:16:01 | 25.3052 N, 69.9027 W | RRS Discovery D346 |
| 1342704 | Water sample data | 2010-01-17 01:09:00 | 25.30513 N, 69.90303 W | RRS Discovery D346 |
| 1344760 | Water sample data | 2010-01-17 01:09:00 | 25.30513 N, 69.90303 W | RRS Discovery D346 |
| 1017365 | CTD or STD cast | 2010-01-17 06:58:12 | 24.9046 N, 69.5358 W | RRS Discovery D346 |
| 1342716 | Water sample data | 2010-01-17 08:53:30 | 24.90678 N, 69.53661 W | RRS Discovery D346 |
| 1344772 | Water sample data | 2010-01-17 08:53:30 | 24.90678 N, 69.53661 W | RRS Discovery D346 |
| 1017377 | CTD or STD cast | 2010-01-17 14:35:13 | 24.505 N, 69.1528 W | RRS Discovery D346 |
| 1342728 | Water sample data | 2010-01-17 16:27:30 | 24.5057 N, 69.15375 W | RRS Discovery D346 |
| 1344784 | Water sample data | 2010-01-17 16:27:30 | 24.5057 N, 69.15375 W | RRS Discovery D346 |
| 1017389 | CTD or STD cast | 2010-01-17 23:07:47 | 24.5094 N, 68.4072 W | RRS Discovery D346 |
| 1342741 | Water sample data | 2010-01-18 01:05:30 | 24.50824 N, 68.40497 W | RRS Discovery D346 |
| 1344796 | Water sample data | 2010-01-18 01:05:30 | 24.50824 N, 68.40497 W | RRS Discovery D346 |
| 1017390 | CTD or STD cast | 2010-01-18 08:04:51 | 24.5084 N, 67.67 W | RRS Discovery D346 |
| 1342753 | Water sample data | 2010-01-18 09:59:00 | 24.5104 N, 67.66965 W | RRS Discovery D346 |
| 1344803 | Water sample data | 2010-01-18 09:59:00 | 24.5104 N, 67.66965 W | RRS Discovery D346 |
| 1017408 | CTD or STD cast | 2010-01-18 16:05:22 | 24.4999 N, 66.9392 W | RRS Discovery D346 |
| 1342765 | Water sample data | 2010-01-18 18:03:00 | 24.49903 N, 66.9409 W | RRS Discovery D346 |
| 1344815 | Water sample data | 2010-01-18 18:03:00 | 24.49903 N, 66.9409 W | RRS Discovery D346 |
| 1017421 | CTD or STD cast | 2010-01-19 00:15:47 | 24.4991 N, 66.2105 W | RRS Discovery D346 |
| 1342777 | Water sample data | 2010-01-19 01:58:30 | 24.49835 N, 66.20922 W | RRS Discovery D346 |
| 1344827 | Water sample data | 2010-01-19 01:58:30 | 24.49835 N, 66.20922 W | RRS Discovery D346 |
| 1017433 | CTD or STD cast | 2010-01-19 07:57:03 | 24.5016 N, 65.4893 W | RRS Discovery D346 |
| 1342789 | Water sample data | 2010-01-19 10:00:30 | 24.5019 N, 65.49149 W | RRS Discovery D346 |
| 1344839 | Water sample data | 2010-01-19 10:00:30 | 24.5019 N, 65.49149 W | RRS Discovery D346 |
| 1017445 | CTD or STD cast | 2010-01-19 16:43:48 | 24.4989 N, 64.7677 W | RRS Discovery D346 |
| 1342790 | Water sample data | 2010-01-19 18:52:30 | 24.49843 N, 64.76879 W | RRS Discovery D346 |
| 1344840 | Water sample data | 2010-01-19 18:52:30 | 24.49843 N, 64.76879 W | RRS Discovery D346 |
| 1017457 | CTD or STD cast | 2010-01-20 01:50:12 | 24.5136 N, 64.0161 W | RRS Discovery D346 |
| 1342808 | Water sample data | 2010-01-20 03:41:30 | 24.51382 N, 64.01524 W | RRS Discovery D346 |
| 1344852 | Water sample data | 2010-01-20 03:41:30 | 24.51382 N, 64.01524 W | RRS Discovery D346 |
| 1017469 | CTD or STD cast | 2010-01-20 10:06:29 | 24.4954 N, 63.2919 W | RRS Discovery D346 |
| 1342821 | Water sample data | 2010-01-20 11:53:30 | 24.49555 N, 63.29101 W | RRS Discovery D346 |
| 1344864 | Water sample data | 2010-01-20 11:53:30 | 24.49555 N, 63.29101 W | RRS Discovery D346 |
| 1017470 | CTD or STD cast | 2010-01-20 18:06:51 | 24.5011 N, 62.5559 W | RRS Discovery D346 |
| 1342833 | Water sample data | 2010-01-20 20:08:00 | 24.49957 N, 62.5552 W | RRS Discovery D346 |
| 1344876 | Water sample data | 2010-01-20 20:08:00 | 24.49957 N, 62.5552 W | RRS Discovery D346 |
| 1017482 | CTD or STD cast | 2010-01-21 02:46:15 | 24.5084 N, 61.8063 W | RRS Discovery D346 |
| 1342845 | Water sample data | 2010-01-21 04:34:30 | 24.50759 N, 61.80467 W | RRS Discovery D346 |
| 1344888 | Water sample data | 2010-01-21 04:34:30 | 24.50759 N, 61.80467 W | RRS Discovery D346 |
| 1017494 | CTD or STD cast | 2010-01-21 10:24:47 | 24.5016 N, 61.0844 W | RRS Discovery D346 |
| 1342857 | Water sample data | 2010-01-21 12:15:30 | 24.50159 N, 61.08662 W | RRS Discovery D346 |
| 1344907 | Water sample data | 2010-01-21 12:15:30 | 24.50159 N, 61.08662 W | RRS Discovery D346 |
| 1017501 | CTD or STD cast | 2010-01-21 18:17:55 | 24.4995 N, 60.3471 W | RRS Discovery D346 |
| 1342869 | Water sample data | 2010-01-21 20:22:00 | 24.49924 N, 60.34854 W | RRS Discovery D346 |
| 1344919 | Water sample data | 2010-01-21 20:22:00 | 24.49924 N, 60.34854 W | RRS Discovery D346 |
| 1017513 | CTD or STD cast | 2010-01-22 02:45:20 | 24.5062 N, 59.6282 W | RRS Discovery D346 |
| 1342870 | Water sample data | 2010-01-22 04:40:00 | 24.50682 N, 59.62942 W | RRS Discovery D346 |
| 1344920 | Water sample data | 2010-01-22 04:40:00 | 24.50682 N, 59.62942 W | RRS Discovery D346 |
| 1017525 | CTD or STD cast | 2010-01-22 11:17:42 | 24.498 N, 58.8964 W | RRS Discovery D346 |
| 1342882 | Water sample data | 2010-01-22 13:13:00 | 24.49885 N, 58.89326 W | RRS Discovery D346 |
| 1344932 | Water sample data | 2010-01-22 13:13:00 | 24.49885 N, 58.89326 W | RRS Discovery D346 |
| 1017537 | CTD or STD cast | 2010-01-22 19:59:35 | 24.5018 N, 58.1505 W | RRS Discovery D346 |
| 1342894 | Water sample data | 2010-01-22 21:50:00 | 24.50281 N, 58.15082 W | RRS Discovery D346 |
| 1344944 | Water sample data | 2010-01-22 21:50:00 | 24.50281 N, 58.15082 W | RRS Discovery D346 |
| 1017549 | CTD or STD cast | 2010-01-23 04:34:49 | 24.502 N, 57.3985 W | RRS Discovery D346 |
| 1342901 | Water sample data | 2010-01-23 06:47:00 | 24.50162 N, 57.39886 W | RRS Discovery D346 |
| 1344956 | Water sample data | 2010-01-23 06:47:00 | 24.50162 N, 57.39886 W | RRS Discovery D346 |
| 1018332 | CTD or STD cast | 2010-01-23 11:20:12 | 24.4967 N, 57.0506 W | RRS Discovery D346 |
| 1017550 | CTD or STD cast | 2010-01-23 19:57:17 | 24.4891 N, 56.6897 W | RRS Discovery D346 |
| 1342913 | Water sample data | 2010-01-23 22:10:00 | 24.48782 N, 56.69055 W | RRS Discovery D346 |
| 1344968 | Water sample data | 2010-01-23 22:10:00 | 24.48782 N, 56.69055 W | RRS Discovery D346 |
| 1017562 | CTD or STD cast | 2010-01-24 05:36:09 | 24.4799 N, 55.9437 W | RRS Discovery D346 |
| 1344981 | Water sample data | 2010-01-24 08:13:00 | 24.47713 N, 55.94313 W | RRS Discovery D346 |
| 1017574 | CTD or STD cast | 2010-01-24 18:34:57 | 24.4963 N, 55.2389 W | RRS Discovery D346 |
| 1342925 | Water sample data | 2010-01-24 20:50:30 | 24.4984 N, 55.24135 W | RRS Discovery D346 |
| 1344993 | Water sample data | 2010-01-24 20:50:30 | 24.4984 N, 55.24135 W | RRS Discovery D346 |
| 1017586 | CTD or STD cast | 2010-01-25 05:52:38 | 24.5097 N, 54.4528 W | RRS Discovery D346 |
| 1342937 | Water sample data | 2010-01-25 08:19:30 | 24.50906 N, 54.45181 W | RRS Discovery D346 |
| 1345007 | Water sample data | 2010-01-25 08:19:30 | 24.50906 N, 54.45181 W | RRS Discovery D346 |
| 1017598 | CTD or STD cast | 2010-01-25 15:08:50 | 24.51 N, 53.938 W | RRS Discovery D346 |
| 1342949 | Water sample data | 2010-01-25 17:33:30 | 24.50845 N, 53.93895 W | RRS Discovery D346 |
| 1345019 | Water sample data | 2010-01-25 17:33:30 | 24.50845 N, 53.93895 W | RRS Discovery D346 |
| 1017605 | CTD or STD cast | 2010-01-26 00:46:48 | 24.8391 N, 53.3993 W | RRS Discovery D346 |
| 1345020 | Water sample data | 2010-01-26 03:04:30 | 24.84099 N, 53.39958 W | RRS Discovery D346 |
| 1017617 | CTD or STD cast | 2010-01-26 09:38:18 | 25.1108 N, 52.8405 W | RRS Discovery D346 |
| 1342950 | Water sample data | 2010-01-26 11:52:00 | 25.11123 N, 52.8402 W | RRS Discovery D346 |
| 1345032 | Water sample data | 2010-01-26 11:52:00 | 25.11123 N, 52.8402 W | RRS Discovery D346 |
| 1017629 | CTD or STD cast | 2010-01-26 17:30:40 | 25.0799 N, 52.2902 W | RRS Discovery D346 |
| 1342962 | Water sample data | 2010-01-26 19:34:00 | 25.077 N, 52.28995 W | RRS Discovery D346 |
| 1345044 | Water sample data | 2010-01-26 19:34:00 | 25.077 N, 52.28995 W | RRS Discovery D346 |
| 1017630 | CTD or STD cast | 2010-01-27 12:19:10 | 25.0222 N, 51.7532 W | RRS Discovery D346 |
| 1342974 | Water sample data | 2010-01-27 14:39:00 | 25.0239 N, 51.75391 W | RRS Discovery D346 |
| 1345056 | Water sample data | 2010-01-27 14:39:00 | 25.0239 N, 51.75391 W | RRS Discovery D346 |
| 1017642 | CTD or STD cast | 2010-01-27 20:32:41 | 24.9374 N, 51.1852 W | RRS Discovery D346 |
| 1342986 | Water sample data | 2010-01-27 22:27:00 | 24.93713 N, 51.18432 W | RRS Discovery D346 |
| 1345068 | Water sample data | 2010-01-27 22:27:00 | 24.93713 N, 51.18432 W | RRS Discovery D346 |
| 1017654 | CTD or STD cast | 2010-01-28 03:37:17 | 24.7984 N, 50.632 W | RRS Discovery D346 |
| 1342998 | Water sample data | 2010-01-28 05:27:30 | 24.79935 N, 50.63183 W | RRS Discovery D346 |
| 1345081 | Water sample data | 2010-01-28 05:27:30 | 24.79935 N, 50.63183 W | RRS Discovery D346 |
| 1017666 | CTD or STD cast | 2010-01-28 10:38:11 | 24.6687 N, 50.0899 W | RRS Discovery D346 |
| 1343001 | Water sample data | 2010-01-28 12:44:00 | 24.66852 N, 50.09264 W | RRS Discovery D346 |
| 1345093 | Water sample data | 2010-01-28 12:44:00 | 24.66852 N, 50.09264 W | RRS Discovery D346 |
| 1017678 | CTD or STD cast | 2010-01-28 18:16:18 | 24.5207 N, 49.5342 W | RRS Discovery D346 |
| 1343013 | Water sample data | 2010-01-28 20:38:00 | 24.52057 N, 49.53572 W | RRS Discovery D346 |
| 1345100 | Water sample data | 2010-01-28 20:38:00 | 24.52057 N, 49.53572 W | RRS Discovery D346 |
| 1017691 | CTD or STD cast | 2010-01-29 02:26:43 | 24.349 N, 49.0082 W | RRS Discovery D346 |
| 1343025 | Water sample data | 2010-01-29 04:19:00 | 24.34836 N, 49.00696 W | RRS Discovery D346 |
| 1345112 | Water sample data | 2010-01-29 04:19:00 | 24.34836 N, 49.00696 W | RRS Discovery D346 |
| 1017709 | CTD or STD cast | 2010-01-29 09:37:27 | 24.196 N, 48.473 W | RRS Discovery D346 |
| 1343037 | Water sample data | 2010-01-29 11:24:30 | 24.1963 N, 48.47379 W | RRS Discovery D346 |
| 1345124 | Water sample data | 2010-01-29 11:24:30 | 24.1963 N, 48.47379 W | RRS Discovery D346 |
| 1017710 | CTD or STD cast | 2010-01-29 16:30:53 | 24.0662 N, 47.9426 W | RRS Discovery D346 |
| 1343049 | Water sample data | 2010-01-29 18:31:00 | 24.06649 N, 47.93983 W | RRS Discovery D346 |
| 1345136 | Water sample data | 2010-01-29 18:31:00 | 24.06649 N, 47.93983 W | RRS Discovery D346 |
| 1017722 | CTD or STD cast | 2010-01-29 23:57:39 | 23.9755 N, 47.4087 W | RRS Discovery D346 |
| 1345148 | Water sample data | 2010-01-30 01:50:00 | 23.97365 N, 47.41016 W | RRS Discovery D346 |
| 1017734 | CTD or STD cast | 2010-01-30 07:40:03 | 23.8992 N, 46.8761 W | RRS Discovery D346 |
| 1343050 | Water sample data | 2010-01-30 09:39:00 | 23.89929 N, 46.87672 W | RRS Discovery D346 |
| 1345161 | Water sample data | 2010-01-30 09:39:00 | 23.89929 N, 46.87672 W | RRS Discovery D346 |
| 1017746 | CTD or STD cast | 2010-01-30 15:19:41 | 23.8739 N, 46.3337 W | RRS Discovery D346 |
| 1343062 | Water sample data | 2010-01-30 17:13:30 | 23.87108 N, 46.33421 W | RRS Discovery D346 |
| 1345173 | Water sample data | 2010-01-30 17:13:30 | 23.87108 N, 46.33421 W | RRS Discovery D346 |
| 1017758 | CTD or STD cast | 2010-01-30 22:51:04 | 23.7669 N, 45.802 W | RRS Discovery D346 |
| 1343074 | Water sample data | 2010-01-31 00:29:30 | 23.76724 N, 45.80241 W | RRS Discovery D346 |
| 1345185 | Water sample data | 2010-01-31 00:29:30 | 23.76724 N, 45.80241 W | RRS Discovery D346 |
| 1017771 | CTD or STD cast | 2010-01-31 05:28:04 | 23.7325 N, 45.27 W | RRS Discovery D346 |
| 1343086 | Water sample data | 2010-01-31 07:03:30 | 23.73259 N, 45.2714 W | RRS Discovery D346 |
| 1345197 | Water sample data | 2010-01-31 07:03:30 | 23.73259 N, 45.2714 W | RRS Discovery D346 |
| 1017783 | CTD or STD cast | 2010-01-31 12:32:54 | 23.6355 N, 44.7354 W | RRS Discovery D346 |
| 1343098 | Water sample data | 2010-01-31 14:08:30 | 23.63517 N, 44.73504 W | RRS Discovery D346 |
| 1345204 | Water sample data | 2010-01-31 14:08:30 | 23.63517 N, 44.73504 W | RRS Discovery D346 |
| 1017795 | CTD or STD cast | 2010-01-31 19:19:54 | 23.5353 N, 44.2091 W | RRS Discovery D346 |
| 1343105 | Water sample data | 2010-01-31 21:02:30 | 23.53593 N, 44.20944 W | RRS Discovery D346 |
| 1345216 | Water sample data | 2010-01-31 21:02:30 | 23.53593 N, 44.20944 W | RRS Discovery D346 |
| 1017802 | CTD or STD cast | 2010-02-01 02:18:59 | 23.45 N, 43.6718 W | RRS Discovery D346 |
| 1343117 | Water sample data | 2010-02-01 04:06:00 | 23.44956 N, 43.67065 W | RRS Discovery D346 |
| 1345228 | Water sample data | 2010-02-01 04:06:00 | 23.44956 N, 43.67065 W | RRS Discovery D346 |
| 1017814 | CTD or STD cast | 2010-02-01 09:21:46 | 23.3727 N, 43.1415 W | RRS Discovery D346 |
| 1343129 | Water sample data | 2010-02-01 11:08:00 | 23.37276 N, 43.14126 W | RRS Discovery D346 |
| 1345241 | Water sample data | 2010-02-01 11:08:00 | 23.37276 N, 43.14126 W | RRS Discovery D346 |
| 1017826 | CTD or STD cast | 2010-02-01 16:18:44 | 23.2503 N, 42.6004 W | RRS Discovery D346 |
| 1343130 | Water sample data | 2010-02-01 18:24:30 | 23.2506 N, 42.60084 W | RRS Discovery D346 |
| 1345253 | Water sample data | 2010-02-01 18:24:30 | 23.2506 N, 42.60084 W | RRS Discovery D346 |
| 1017838 | CTD or STD cast | 2010-02-02 01:44:52 | 23.3847 N, 41.7691 W | RRS Discovery D346 |
| 1343142 | Water sample data | 2010-02-02 03:24:00 | 23.38595 N, 41.76971 W | RRS Discovery D346 |
| 1345265 | Water sample data | 2010-02-02 03:24:00 | 23.38595 N, 41.76971 W | RRS Discovery D346 |
| 1017851 | CTD or STD cast | 2010-02-02 10:05:18 | 23.5204 N, 40.9444 W | RRS Discovery D346 |
| 1343154 | Water sample data | 2010-02-02 11:43:30 | 23.52099 N, 40.94439 W | RRS Discovery D346 |
| 1345277 | Water sample data | 2010-02-02 11:43:30 | 23.52099 N, 40.94439 W | RRS Discovery D346 |
| 1017863 | CTD or STD cast | 2010-02-02 18:31:04 | 23.6671 N, 40.1083 W | RRS Discovery D346 |
| 1343166 | Water sample data | 2010-02-02 20:24:30 | 23.66841 N, 40.10839 W | RRS Discovery D346 |
| 1345289 | Water sample data | 2010-02-02 20:24:30 | 23.66841 N, 40.10839 W | RRS Discovery D346 |
| 1017875 | CTD or STD cast | 2010-02-03 03:18:35 | 23.7994 N, 39.2622 W | RRS Discovery D346 |
| 1343178 | Water sample data | 2010-02-03 05:08:30 | 23.79951 N, 39.26253 W | RRS Discovery D346 |
| 1345290 | Water sample data | 2010-02-03 05:08:30 | 23.79951 N, 39.26253 W | RRS Discovery D346 |
| 1017887 | CTD or STD cast | 2010-02-03 11:54:31 | 23.9348 N, 38.4332 W | RRS Discovery D346 |
| 1343191 | Water sample data | 2010-02-03 13:55:30 | 23.93409 N, 38.43501 W | RRS Discovery D346 |
| 1345308 | Water sample data | 2010-02-03 13:55:30 | 23.93409 N, 38.43501 W | RRS Discovery D346 |
| 1017899 | CTD or STD cast | 2010-02-03 20:50:04 | 24.0895 N, 37.6111 W | RRS Discovery D346 |
| 1343209 | Water sample data | 2010-02-03 22:40:00 | 24.08959 N, 37.61037 W | RRS Discovery D346 |
| 1345321 | Water sample data | 2010-02-03 22:40:00 | 24.08959 N, 37.61037 W | RRS Discovery D346 |
| 1017906 | CTD or STD cast | 2010-02-04 05:31:56 | 24.2193 N, 36.7698 W | RRS Discovery D346 |
| 1343210 | Water sample data | 2010-02-04 07:21:00 | 24.21911 N, 36.76954 W | RRS Discovery D346 |
| 1345333 | Water sample data | 2010-02-04 07:21:00 | 24.21911 N, 36.76954 W | RRS Discovery D346 |
| 1017918 | CTD or STD cast | 2010-02-04 13:54:12 | 24.3634 N, 35.9273 W | RRS Discovery D346 |
| 1343222 | Water sample data | 2010-02-04 15:54:30 | 24.36459 N, 35.9276 W | RRS Discovery D346 |
| 1345345 | Water sample data | 2010-02-04 15:54:30 | 24.36459 N, 35.9276 W | RRS Discovery D346 |
| 1017931 | CTD or STD cast | 2010-02-05 00:52:15 | 24.5062 N, 35.085 W | RRS Discovery D346 |
| 1343234 | Water sample data | 2010-02-05 02:50:00 | 24.50544 N, 35.08704 W | RRS Discovery D346 |
| 1345357 | Water sample data | 2010-02-05 02:50:00 | 24.50544 N, 35.08704 W | RRS Discovery D346 |
| 1017943 | CTD or STD cast | 2010-02-05 08:39:54 | 24.4954 N, 34.4167 W | RRS Discovery D346 |
| 1343246 | Water sample data | 2010-02-05 10:58:30 | 24.49656 N, 34.41498 W | RRS Discovery D346 |
| 1345369 | Water sample data | 2010-02-05 10:58:30 | 24.49656 N, 34.41498 W | RRS Discovery D346 |
| 1018344 | CTD or STD cast | 2010-02-05 15:34:09 | 24.5061 N, 34.0463 W | RRS Discovery D346 |
| 1017955 | CTD or STD cast | 2010-02-05 19:28:58 | 24.4961 N, 33.7285 W | RRS Discovery D346 |
| 1343258 | Water sample data | 2010-02-05 21:19:30 | 24.49568 N, 33.72751 W | RRS Discovery D346 |
| 1345370 | Water sample data | 2010-02-05 21:19:30 | 24.49568 N, 33.72751 W | RRS Discovery D346 |
| 1017967 | CTD or STD cast | 2010-02-06 02:51:21 | 24.5002 N, 33.0449 W | RRS Discovery D346 |
| 1343271 | Water sample data | 2010-02-06 04:47:30 | 24.50075 N, 33.04511 W | RRS Discovery D346 |
| 1345382 | Water sample data | 2010-02-06 04:47:30 | 24.50075 N, 33.04511 W | RRS Discovery D346 |
| 1017979 | CTD or STD cast | 2010-02-06 10:35:08 | 24.494 N, 32.3574 W | RRS Discovery D346 |
| 1343283 | Water sample data | 2010-02-06 12:30:00 | 24.49286 N, 32.35696 W | RRS Discovery D346 |
| 1345394 | Water sample data | 2010-02-06 12:30:00 | 24.49286 N, 32.35696 W | RRS Discovery D346 |
| 1017980 | CTD or STD cast | 2010-02-06 18:07:00 | 24.4976 N, 31.6808 W | RRS Discovery D346 |
| 1343295 | Water sample data | 2010-02-06 20:14:00 | 24.49735 N, 31.68006 W | RRS Discovery D346 |
| 1345401 | Water sample data | 2010-02-06 20:14:00 | 24.49735 N, 31.68006 W | RRS Discovery D346 |
| 1017992 | CTD or STD cast | 2010-02-07 02:21:34 | 24.4964 N, 31.0027 W | RRS Discovery D346 |
| 1343302 | Water sample data | 2010-02-07 04:25:30 | 24.49611 N, 31.00389 W | RRS Discovery D346 |
| 1345413 | Water sample data | 2010-02-07 04:25:30 | 24.49611 N, 31.00389 W | RRS Discovery D346 |
| 1018006 | CTD or STD cast | 2010-02-07 10:39:03 | 24.4919 N, 30.3215 W | RRS Discovery D346 |
| 1343314 | Water sample data | 2010-02-07 12:55:30 | 24.49241 N, 30.32428 W | RRS Discovery D346 |
| 1345425 | Water sample data | 2010-02-07 12:55:30 | 24.49241 N, 30.32428 W | RRS Discovery D346 |
| 1018018 | CTD or STD cast | 2010-02-07 19:30:12 | 24.5028 N, 29.6583 W | RRS Discovery D346 |
| 1343326 | Water sample data | 2010-02-07 21:40:00 | 24.50286 N, 29.65925 W | RRS Discovery D346 |
| 1345437 | Water sample data | 2010-02-07 21:40:00 | 24.50286 N, 29.65925 W | RRS Discovery D346 |
| 1018031 | CTD or STD cast | 2010-02-08 04:13:40 | 24.5009 N, 28.9609 W | RRS Discovery D346 |
| 1343338 | Water sample data | 2010-02-08 06:30:00 | 24.50148 N, 28.96346 W | RRS Discovery D346 |
| 1345449 | Water sample data | 2010-02-08 06:30:00 | 24.50148 N, 28.96346 W | RRS Discovery D346 |
| 1018043 | CTD or STD cast | 2010-02-08 13:03:44 | 24.5009 N, 28.2953 W | RRS Discovery D346 |
| 1343351 | Water sample data | 2010-02-08 15:26:30 | 24.50023 N, 28.29389 W | RRS Discovery D346 |
| 1345450 | Water sample data | 2010-02-08 15:26:30 | 24.50023 N, 28.29389 W | RRS Discovery D346 |
| 1018055 | CTD or STD cast | 2010-02-08 22:15:58 | 24.4916 N, 27.5993 W | RRS Discovery D346 |
| 1343363 | Water sample data | 2010-02-09 00:22:00 | 24.4927 N, 27.60176 W | RRS Discovery D346 |
| 1345462 | Water sample data | 2010-02-09 00:22:00 | 24.4927 N, 27.60176 W | RRS Discovery D346 |
| 1018067 | CTD or STD cast | 2010-02-09 06:37:24 | 24.512 N, 26.9118 W | RRS Discovery D346 |
| 1343375 | Water sample data | 2010-02-09 08:43:00 | 24.51282 N, 26.9139 W | RRS Discovery D346 |
| 1345474 | Water sample data | 2010-02-09 08:43:00 | 24.51282 N, 26.9139 W | RRS Discovery D346 |
| 1018079 | CTD or STD cast | 2010-02-09 15:02:52 | 24.5099 N, 26.225 W | RRS Discovery D346 |
| 1343387 | Water sample data | 2010-02-09 17:03:00 | 24.51089 N, 26.23072 W | RRS Discovery D346 |
| 1345486 | Water sample data | 2010-02-09 17:03:00 | 24.51089 N, 26.23072 W | RRS Discovery D346 |
| 1018080 | CTD or STD cast | 2010-02-09 23:28:37 | 24.5112 N, 25.5416 W | RRS Discovery D346 |
| 1343399 | Water sample data | 2010-02-10 01:35:30 | 24.51277 N, 25.54231 W | RRS Discovery D346 |
| 1345498 | Water sample data | 2010-02-10 01:35:30 | 24.51277 N, 25.54231 W | RRS Discovery D346 |
| 1018092 | CTD or STD cast | 2010-02-10 08:11:21 | 24.5142 N, 24.8471 W | RRS Discovery D346 |
| 1343406 | Water sample data | 2010-02-10 10:03:00 | 24.51549 N, 24.84693 W | RRS Discovery D346 |
| 1345505 | Water sample data | 2010-02-10 10:03:00 | 24.51549 N, 24.84693 W | RRS Discovery D346 |
| 1018111 | CTD or STD cast | 2010-02-10 15:58:39 | 24.4998 N, 24.1647 W | RRS Discovery D346 |
| 1343418 | Water sample data | 2010-02-10 17:49:00 | 24.50054 N, 24.16319 W | RRS Discovery D346 |
| 1345517 | Water sample data | 2010-02-10 17:49:00 | 24.50054 N, 24.16319 W | RRS Discovery D346 |
| 1018123 | CTD or STD cast | 2010-02-10 23:29:08 | 24.4942 N, 23.501 W | RRS Discovery D346 |
| 1343431 | Water sample data | 2010-02-11 01:17:00 | 24.49592 N, 23.50076 W | RRS Discovery D346 |
| 1345529 | Water sample data | 2010-02-11 01:17:00 | 24.49592 N, 23.50076 W | RRS Discovery D346 |
| 1018135 | CTD or STD cast | 2010-02-11 06:51:19 | 24.7142 N, 22.8842 W | RRS Discovery D346 |
| 1343443 | Water sample data | 2010-02-11 08:37:30 | 24.71531 N, 22.88196 W | RRS Discovery D346 |
| 1345530 | Water sample data | 2010-02-11 08:37:30 | 24.71531 N, 22.88196 W | RRS Discovery D346 |
| 1018147 | CTD or STD cast | 2010-02-11 14:07:15 | 24.9187 N, 22.2656 W | RRS Discovery D346 |
| 1343455 | Water sample data | 2010-02-11 15:47:30 | 24.91937 N, 22.2652 W | RRS Discovery D346 |
| 1345542 | Water sample data | 2010-02-11 15:47:30 | 24.91937 N, 22.2652 W | RRS Discovery D346 |
| 1018159 | CTD or STD cast | 2010-02-11 21:09:19 | 25.1367 N, 21.6523 W | RRS Discovery D346 |
| 1343467 | Water sample data | 2010-02-11 22:42:30 | 25.13793 N, 21.6519 W | RRS Discovery D346 |
| 1345554 | Water sample data | 2010-02-11 22:42:30 | 25.13793 N, 21.6519 W | RRS Discovery D346 |
| 1018160 | CTD or STD cast | 2010-02-12 03:51:43 | 25.3346 N, 21.0304 W | RRS Discovery D346 |
| 1343479 | Water sample data | 2010-02-12 05:24:30 | 25.33535 N, 21.03194 W | RRS Discovery D346 |
| 1345566 | Water sample data | 2010-02-12 05:24:30 | 25.33535 N, 21.03194 W | RRS Discovery D346 |
| 1018172 | CTD or STD cast | 2010-02-12 10:32:14 | 25.5458 N, 20.4184 W | RRS Discovery D346 |
| 1343480 | Water sample data | 2010-02-12 12:03:00 | 25.54707 N, 20.41807 W | RRS Discovery D346 |
| 1345578 | Water sample data | 2010-02-12 12:03:00 | 25.54707 N, 20.41807 W | RRS Discovery D346 |
| 1018184 | CTD or STD cast | 2010-02-12 17:10:41 | 25.7426 N, 19.7968 W | RRS Discovery D346 |
| 1343492 | Water sample data | 2010-02-12 18:35:30 | 25.74195 N, 19.79598 W | RRS Discovery D346 |
| 1345591 | Water sample data | 2010-02-12 18:35:30 | 25.74195 N, 19.79598 W | RRS Discovery D346 |
| 1018196 | CTD or STD cast | 2010-02-12 23:39:53 | 25.9624 N, 19.1884 W | RRS Discovery D346 |
| 1343511 | Water sample data | 2010-02-13 00:55:30 | 25.9632 N, 19.18957 W | RRS Discovery D346 |
| 1345609 | Water sample data | 2010-02-13 00:55:30 | 25.9632 N, 19.18957 W | RRS Discovery D346 |
| 1018203 | CTD or STD cast | 2010-02-13 05:53:44 | 26.1676 N, 18.5738 W | RRS Discovery D346 |
| 1343523 | Water sample data | 2010-02-13 07:12:30 | 26.16697 N, 18.57381 W | RRS Discovery D346 |
| 1345610 | Water sample data | 2010-02-13 07:12:30 | 26.16697 N, 18.57381 W | RRS Discovery D346 |
| 1018215 | CTD or STD cast | 2010-02-13 12:12:53 | 26.3764 N, 17.959 W | RRS Discovery D346 |
| 1343535 | Water sample data | 2010-02-13 13:35:00 | 26.37611 N, 17.96116 W | RRS Discovery D346 |
| 1345622 | Water sample data | 2010-02-13 13:35:00 | 26.37611 N, 17.96116 W | RRS Discovery D346 |
| 1018227 | CTD or STD cast | 2010-02-13 18:40:12 | 26.5763 N, 17.3344 W | RRS Discovery D346 |
| 1343547 | Water sample data | 2010-02-13 19:58:00 | 26.57625 N, 17.33568 W | RRS Discovery D346 |
| 1345634 | Water sample data | 2010-02-13 19:58:00 | 26.57625 N, 17.33568 W | RRS Discovery D346 |
| 1018239 | CTD or STD cast | 2010-02-14 01:05:26 | 26.7898 N, 16.7151 W | RRS Discovery D346 |
| 1343559 | Water sample data | 2010-02-14 02:27:00 | 26.78982 N, 16.71396 W | RRS Discovery D346 |
| 1345646 | Water sample data | 2010-02-14 02:27:00 | 26.78982 N, 16.71396 W | RRS Discovery D346 |
| 1018240 | CTD or STD cast | 2010-02-14 07:21:05 | 26.9886 N, 16.0968 W | RRS Discovery D346 |
| 1343560 | Water sample data | 2010-02-14 08:39:30 | 26.98827 N, 16.09626 W | RRS Discovery D346 |
| 1345658 | Water sample data | 2010-02-14 08:39:30 | 26.98827 N, 16.09626 W | RRS Discovery D346 |
| 1018252 | CTD or STD cast | 2010-02-14 13:39:01 | 27.1971 N, 15.483 W | RRS Discovery D346 |
| 1343572 | Water sample data | 2010-02-14 14:54:30 | 27.19634 N, 15.48435 W | RRS Discovery D346 |
| 1345671 | Water sample data | 2010-02-14 14:54:30 | 27.19634 N, 15.48435 W | RRS Discovery D346 |
| 1018264 | CTD or STD cast | 2010-02-14 19:50:24 | 27.4145 N, 14.8686 W | RRS Discovery D346 |
| 1343584 | Water sample data | 2010-02-14 20:56:30 | 27.41372 N, 14.8685 W | RRS Discovery D346 |
| 1345683 | Water sample data | 2010-02-14 20:56:30 | 27.41372 N, 14.8685 W | RRS Discovery D346 |
| 1018276 | CTD or STD cast | 2010-02-15 01:50:00 | 27.6229 N, 14.2368 W | RRS Discovery D346 |
| 1343596 | Water sample data | 2010-02-15 02:40:30 | 27.6221 N, 14.23772 W | RRS Discovery D346 |
| 1345695 | Water sample data | 2010-02-15 02:40:30 | 27.6221 N, 14.23772 W | RRS Discovery D346 |
| 1018288 | CTD or STD cast | 2010-02-15 06:33:01 | 27.7894 N, 13.7772 W | RRS Discovery D346 |
| 1343603 | Water sample data | 2010-02-15 07:23:30 | 27.78881 N, 13.77898 W | RRS Discovery D346 |
| 1345702 | Water sample data | 2010-02-15 07:23:30 | 27.78881 N, 13.77898 W | RRS Discovery D346 |
| 1018307 | CTD or STD cast | 2010-02-15 10:15:31 | 27.8667 N, 13.5561 W | RRS Discovery D346 |
| 1343615 | Water sample data | 2010-02-15 10:48:30 | 27.86678 N, 13.55629 W | RRS Discovery D346 |
| 1345714 | Water sample data | 2010-02-15 10:48:30 | 27.86678 N, 13.55629 W | RRS Discovery D346 |
| 1018319 | CTD or STD cast | 2010-02-15 13:02:52 | 27.9113 N, 13.4101 W | RRS Discovery D346 |
| 1343627 | Water sample data | 2010-02-15 13:25:00 | 27.911 N, 13.41072 W | RRS Discovery D346 |
| 1345726 | Water sample data | 2010-02-15 13:25:00 | 27.911 N, 13.41072 W | RRS Discovery D346 |
| 1018320 | CTD or STD cast | 2010-02-15 15:25:16 | 27.9275 N, 13.3692 W | RRS Discovery D346 |
| 1343639 | Water sample data | 2010-02-15 15:43:00 | 27.92782 N, 13.36938 W | RRS Discovery D346 |
| 1345738 | Water sample data | 2010-02-15 15:43:00 | 27.92782 N, 13.36938 W | RRS Discovery D346 |
| 1816672 | Currents -subsurface Eulerian | 2015-12-06 23:30:39 | 25.08129 N, 77.33905 W | RRS Discovery DY040 |
| 1816660 | Currents -subsurface Eulerian | 2015-12-06 23:50:53 | 25.08343 N, 77.34695 W | RRS Discovery DY040 |
| 1843817 | CTD or STD cast | 2015-12-09 21:27:40 | 26.4336 N, 78.6669 W | RRS Discovery DY040 |
| 1894909 | Water sample data | 2015-12-09 21:48:00 | 26.4336 N, 78.66688 W | RRS Discovery DY040 |
| 1842236 | CTD or STD cast | 2015-12-10 06:51:36 | 27.0016 N, 79.9975 W | RRS Discovery DY040 |
| 1894910 | Water sample data | 2015-12-10 06:54:00 | 27.00157 N, 79.99747 W | RRS Discovery DY040 |
| 1842248 | CTD or STD cast | 2015-12-10 08:14:49 | 27.0038 N, 79.9681 W | RRS Discovery DY040 |
| 1894922 | Water sample data | 2015-12-10 08:20:00 | 27.00379 N, 79.96814 W | RRS Discovery DY040 |
| 1842261 | CTD or STD cast | 2015-12-10 09:47:52 | 27.0048 N, 79.9353 W | RRS Discovery DY040 |
| 1894934 | Water sample data | 2015-12-10 09:57:00 | 27.00485 N, 79.93531 W | RRS Discovery DY040 |
| 1842273 | CTD or STD cast | 2015-12-10 11:35:38 | 27.0079 N, 79.8679 W | RRS Discovery DY040 |
| 1894946 | Water sample data | 2015-12-10 11:44:00 | 27.0079 N, 79.86786 W | RRS Discovery DY040 |
| 1842285 | CTD or STD cast | 2015-12-10 14:19:13 | 27.0191 N, 79.7837 W | RRS Discovery DY040 |
| 1894958 | Water sample data | 2015-12-10 14:37:00 | 27.01906 N, 79.78371 W | RRS Discovery DY040 |
| 1842297 | CTD or STD cast | 2015-12-10 23:21:05 | 27.016 N, 79.7803 W | RRS Discovery DY040 |
| 1894971 | Water sample data | 2015-12-10 23:37:00 | 27.01603 N, 79.78029 W | RRS Discovery DY040 |
| 1842304 | CTD or STD cast | 2015-12-11 02:01:34 | 27.0161 N, 79.681 W | RRS Discovery DY040 |
| 1894983 | Water sample data | 2015-12-11 02:19:00 | 27.01611 N, 79.68102 W | RRS Discovery DY040 |
| 1842316 | CTD or STD cast | 2015-12-11 04:47:24 | 27.0135 N, 79.6161 W | RRS Discovery DY040 |
| 1894995 | Water sample data | 2015-12-11 05:03:00 | 27.01355 N, 79.61612 W | RRS Discovery DY040 |
| 1842328 | CTD or STD cast | 2015-12-11 07:32:18 | 27.0103 N, 79.4994 W | RRS Discovery DY040 |
| 1895009 | Water sample data | 2015-12-11 07:48:00 | 27.01026 N, 79.49937 W | RRS Discovery DY040 |
| 1842341 | CTD or STD cast | 2015-12-11 10:39:27 | 27.0074 N, 79.383 W | RRS Discovery DY040 |
| 1895010 | Water sample data | 2015-12-11 10:55:00 | 27.00736 N, 79.38295 W | RRS Discovery DY040 |
| 1842353 | CTD or STD cast | 2015-12-11 13:38:24 | 27.004 N, 79.2805 W | RRS Discovery DY040 |
| 1895022 | Water sample data | 2015-12-11 13:55:00 | 27.00401 N, 79.28046 W | RRS Discovery DY040 |
| 1842365 | CTD or STD cast | 2015-12-11 16:03:34 | 27.0005 N, 79.1985 W | RRS Discovery DY040 |
| 1895034 | Water sample data | 2015-12-11 16:17:00 | 27.00051 N, 79.19847 W | RRS Discovery DY040 |
| 1842377 | CTD or STD cast | 2015-12-11 18:05:23 | 27.0 N, 79.1751 W | RRS Discovery DY040 |
| 1895046 | Water sample data | 2015-12-11 18:16:00 | 26.99999 N, 79.17506 W | RRS Discovery DY040 |
| 1842389 | CTD or STD cast | 2015-12-11 21:19:44 | 26.9999 N, 79.1582 W | RRS Discovery DY040 |
| 1895058 | Water sample data | 2015-12-11 21:30:00 | 26.99987 N, 79.15816 W | RRS Discovery DY040 |
| 1842390 | CTD or STD cast | 2015-12-12 02:38:21 | 27.0037 N, 79.9312 W | RRS Discovery DY040 |
| 1842408 | CTD or STD cast | 2015-12-12 03:40:29 | 27.0062 N, 79.865 W | RRS Discovery DY040 |
| 1842421 | CTD or STD cast | 2015-12-12 05:09:31 | 27.0148 N, 79.7805 W | RRS Discovery DY040 |
| 1842433 | CTD or STD cast | 2015-12-12 06:39:31 | 27.0165 N, 79.6833 W | RRS Discovery DY040 |
| 1842445 | CTD or STD cast | 2015-12-12 08:04:32 | 27.0173 N, 79.617 W | RRS Discovery DY040 |
| 1842457 | CTD or STD cast | 2015-12-12 09:50:24 | 27.012 N, 79.5017 W | RRS Discovery DY040 |
| 1842469 | CTD or STD cast | 2015-12-12 12:03:47 | 27.0067 N, 79.384 W | RRS Discovery DY040 |
| 1842470 | CTD or STD cast | 2015-12-12 14:00:37 | 27.0014 N, 79.2833 W | RRS Discovery DY040 |
| 1842482 | CTD or STD cast | 2015-12-12 15:44:36 | 26.9985 N, 79.2 W | RRS Discovery DY040 |
| 1842494 | CTD or STD cast | 2015-12-13 14:10:18 | 26.5003 N, 76.9335 W | RRS Discovery DY040 |
| 1895071 | Water sample data | 2015-12-13 14:24:00 | 26.50026 N, 76.93345 W | RRS Discovery DY040 |
| 1842501 | CTD or STD cast | 2015-12-13 16:08:20 | 26.5001 N, 76.8671 W | RRS Discovery DY040 |
| 1895083 | Water sample data | 2015-12-13 16:44:00 | 26.50011 N, 76.86712 W | RRS Discovery DY040 |
| 1842513 | CTD or STD cast | 2015-12-13 18:42:23 | 26.5167 N, 76.8252 W | RRS Discovery DY040 |
| 1895095 | Water sample data | 2015-12-13 19:12:00 | 26.51674 N, 76.82522 W | RRS Discovery DY040 |
| 1842525 | CTD or STD cast | 2015-12-13 20:58:39 | 26.5001 N, 76.8002 W | RRS Discovery DY040 |
| 1895102 | Water sample data | 2015-12-13 21:27:00 | 26.5001 N, 76.80023 W | RRS Discovery DY040 |
| 1842537 | CTD or STD cast | 2015-12-13 23:30:18 | 26.5001 N, 76.7836 W | RRS Discovery DY040 |
| 1895114 | Water sample data | 2015-12-14 00:14:00 | 26.50006 N, 76.78357 W | RRS Discovery DY040 |
| 1842549 | CTD or STD cast | 2015-12-14 02:49:16 | 26.5002 N, 76.7586 W | RRS Discovery DY040 |
| 1895126 | Water sample data | 2015-12-14 04:05:00 | 26.50015 N, 76.75859 W | RRS Discovery DY040 |
| 1842550 | CTD or STD cast | 2015-12-14 07:37:57 | 26.5001 N, 76.6835 W | RRS Discovery DY040 |
| 1895138 | Water sample data | 2015-12-14 09:06:00 | 26.50014 N, 76.68353 W | RRS Discovery DY040 |
| 1842562 | CTD or STD cast | 2015-12-14 13:30:55 | 26.5002 N, 76.6168 W | RRS Discovery DY040 |
| 1895151 | Water sample data | 2015-12-14 14:58:00 | 26.50018 N, 76.61682 W | RRS Discovery DY040 |
| 1842574 | CTD or STD cast | 2015-12-14 18:33:11 | 26.4999 N, 76.5333 W | RRS Discovery DY040 |
| 1895163 | Water sample data | 2015-12-14 20:02:00 | 26.49995 N, 76.53331 W | RRS Discovery DY040 |
| 1842586 | CTD or STD cast | 2015-12-14 23:27:18 | 26.5 N, 76.4333 W | RRS Discovery DY040 |
| 1895175 | Water sample data | 2015-12-15 00:55:00 | 26.50002 N, 76.43329 W | RRS Discovery DY040 |
| 1842598 | CTD or STD cast | 2015-12-15 04:31:56 | 26.5003 N, 76.3002 W | RRS Discovery DY040 |
| 1895187 | Water sample data | 2015-12-15 05:56:00 | 26.50032 N, 76.3002 W | RRS Discovery DY040 |
| 1842605 | CTD or STD cast | 2015-12-15 09:41:45 | 26.5002 N, 76.2167 W | RRS Discovery DY040 |
| 1895199 | Water sample data | 2015-12-15 11:05:00 | 26.50021 N, 76.21672 W | RRS Discovery DY040 |
| 1842617 | CTD or STD cast | 2015-12-15 14:59:13 | 26.5002 N, 76.1002 W | RRS Discovery DY040 |
| 1895206 | Water sample data | 2015-12-15 16:27:00 | 26.50017 N, 76.10016 W | RRS Discovery DY040 |
| 1842629 | CTD or STD cast | 2015-12-18 06:44:57 | 26.5001 N, 76.1004 W | RRS Discovery DY040 |
| 1842630 | CTD or STD cast | 2015-12-18 11:20:29 | 26.5002 N, 75.9001 W | RRS Discovery DY040 |
| 1895218 | Water sample data | 2015-12-18 12:52:00 | 26.50018 N, 75.90009 W | RRS Discovery DY040 |
| 1842642 | CTD or STD cast | 2015-12-18 17:35:36 | 26.5003 N, 75.7003 W | RRS Discovery DY040 |
| 1895231 | Water sample data | 2015-12-18 18:59:00 | 26.50033 N, 75.70033 W | RRS Discovery DY040 |
| 1842654 | CTD or STD cast | 2015-12-18 22:38:31 | 26.5002 N, 75.5 W | RRS Discovery DY040 |
| 1895243 | Water sample data | 2015-12-19 00:01:00 | 26.50021 N, 75.50003 W | RRS Discovery DY040 |
| 1842666 | CTD or STD cast | 2015-12-19 03:36:08 | 26.5002 N, 75.3001 W | RRS Discovery DY040 |
| 1895255 | Water sample data | 2015-12-19 04:56:00 | 26.50017 N, 75.30015 W | RRS Discovery DY040 |
| 1842678 | CTD or STD cast | 2015-12-19 08:30:20 | 26.5007 N, 75.0672 W | RRS Discovery DY040 |
| 1895267 | Water sample data | 2015-12-19 09:59:00 | 26.5007 N, 75.06721 W | RRS Discovery DY040 |
| 1842691 | CTD or STD cast | 2015-12-19 14:14:23 | 26.4997 N, 74.8003 W | RRS Discovery DY040 |
| 1895279 | Water sample data | 2015-12-19 15:38:00 | 26.49974 N, 74.80026 W | RRS Discovery DY040 |
| 1842709 | CTD or STD cast | 2015-12-19 19:39:22 | 26.5004 N, 74.5191 W | RRS Discovery DY040 |
| 1895280 | Water sample data | 2015-12-19 21:02:00 | 26.50042 N, 74.51914 W | RRS Discovery DY040 |
| 1842710 | CTD or STD cast | 2015-12-20 01:32:16 | 26.4997 N, 74.2376 W | RRS Discovery DY040 |
| 1895292 | Water sample data | 2015-12-20 02:58:00 | 26.49966 N, 74.23763 W | RRS Discovery DY040 |
| 1842722 | CTD or STD cast | 2015-12-20 07:08:20 | 26.5007 N, 73.9345 W | RRS Discovery DY040 |
| 1895311 | Water sample data | 2015-12-20 08:31:00 | 26.5007 N, 73.93448 W | RRS Discovery DY040 |
| 1842734 | CTD or STD cast | 2015-12-20 13:28:41 | 26.4979 N, 73.5674 W | RRS Discovery DY040 |
| 1895323 | Water sample data | 2015-12-20 15:03:00 | 26.49786 N, 73.56736 W | RRS Discovery DY040 |
| 1842746 | CTD or STD cast | 2015-12-20 19:47:18 | 26.4994 N, 73.202 W | RRS Discovery DY040 |
| 1895335 | Water sample data | 2015-12-20 21:19:00 | 26.49937 N, 73.20201 W | RRS Discovery DY040 |
| 1842758 | CTD or STD cast | 2015-12-21 02:30:13 | 26.5031 N, 72.8416 W | RRS Discovery DY040 |
| 1895347 | Water sample data | 2015-12-21 04:03:00 | 26.50306 N, 72.8416 W | RRS Discovery DY040 |
| 1842771 | CTD or STD cast | 2015-12-21 09:39:54 | 26.4997 N, 72.3777 W | RRS Discovery DY040 |
| 1895359 | Water sample data | 2015-12-21 11:14:00 | 26.49972 N, 72.37774 W | RRS Discovery DY040 |
| 1842783 | CTD or STD cast | 2015-12-21 17:12:11 | 26.5002 N, 71.9172 W | RRS Discovery DY040 |
| 1895360 | Water sample data | 2015-12-21 18:48:00 | 26.5002 N, 71.91718 W | RRS Discovery DY040 |
| 1842795 | CTD or STD cast | 2015-12-22 00:01:57 | 26.5018 N, 71.4606 W | RRS Discovery DY040 |
| 1895372 | Water sample data | 2015-12-22 01:40:00 | 26.50182 N, 71.46056 W | RRS Discovery DY040 |
| 1842802 | CTD or STD cast | 2015-12-22 07:19:08 | 26.5001 N, 71.0002 W | RRS Discovery DY040 |
| 1895384 | Water sample data | 2015-12-22 08:57:00 | 26.50008 N, 71.00023 W | RRS Discovery DY040 |
| 1842814 | CTD or STD cast | 2015-12-22 16:13:27 | 25.9993 N, 70.5373 W | RRS Discovery DY040 |
| 1895396 | Water sample data | 2015-12-22 17:54:00 | 25.99935 N, 70.53731 W | RRS Discovery DY040 |
| 1842826 | CTD or STD cast | 2015-12-23 00:49:54 | 25.5032 N, 70.0774 W | RRS Discovery DY040 |
| 1895403 | Water sample data | 2015-12-23 02:33:00 | 25.50317 N, 70.07744 W | RRS Discovery DY040 |
| 1842838 | CTD or STD cast | 2015-12-23 09:28:15 | 25.0035 N, 69.615 W | RRS Discovery DY040 |
| 1895415 | Water sample data | 2015-12-23 11:06:00 | 25.00353 N, 69.61504 W | RRS Discovery DY040 |
| 1842851 | CTD or STD cast | 2015-12-23 18:19:34 | 24.4996 N, 69.1511 W | RRS Discovery DY040 |
| 1895427 | Water sample data | 2015-12-23 20:01:00 | 24.49958 N, 69.15108 W | RRS Discovery DY040 |
| 1842863 | CTD or STD cast | 2015-12-24 03:32:56 | 24.5009 N, 68.417 W | RRS Discovery DY040 |
| 1895439 | Water sample data | 2015-12-24 05:11:00 | 24.50095 N, 68.41702 W | RRS Discovery DY040 |
| 1842875 | CTD or STD cast | 2015-12-24 12:30:26 | 24.5 N, 67.6849 W | RRS Discovery DY040 |
| 1895440 | Water sample data | 2015-12-24 14:13:00 | 24.50003 N, 67.68494 W | RRS Discovery DY040 |
| 1842887 | CTD or STD cast | 2015-12-24 22:17:38 | 24.5011 N, 66.9543 W | RRS Discovery DY040 |
| 1895452 | Water sample data | 2015-12-25 00:01:00 | 24.50106 N, 66.95433 W | RRS Discovery DY040 |
| 1842899 | CTD or STD cast | 2015-12-25 07:34:50 | 24.5 N, 66.2176 W | RRS Discovery DY040 |
| 1895464 | Water sample data | 2015-12-25 09:06:00 | 24.49999 N, 66.21761 W | RRS Discovery DY040 |
| 1842906 | CTD or STD cast | 2015-12-25 12:54:14 | 24.4964 N, 66.0287 W | RRS Discovery DY040 |
| 1895476 | Water sample data | 2015-12-25 14:41:00 | 24.49641 N, 66.02868 W | RRS Discovery DY040 |
| 1842918 | CTD or STD cast | 2015-12-25 20:08:00 | 24.4998 N, 65.4843 W | RRS Discovery DY040 |
| 1895488 | Water sample data | 2015-12-25 21:43:00 | 24.49975 N, 65.48434 W | RRS Discovery DY040 |
| 1842931 | CTD or STD cast | 2015-12-26 04:58:19 | 24.4994 N, 64.7511 W | RRS Discovery DY040 |
| 1895507 | Water sample data | 2015-12-26 06:40:00 | 24.49944 N, 64.75113 W | RRS Discovery DY040 |
| 1842943 | CTD or STD cast | 2015-12-26 14:53:09 | 24.4994 N, 64.0166 W | RRS Discovery DY040 |
| 1895519 | Water sample data | 2015-12-26 16:37:00 | 24.49939 N, 64.0166 W | RRS Discovery DY040 |
| 1842955 | CTD or STD cast | 2015-12-27 00:00:24 | 24.5023 N, 63.2847 W | RRS Discovery DY040 |
| 1895520 | Water sample data | 2015-12-27 01:43:00 | 24.50234 N, 63.28468 W | RRS Discovery DY040 |
| 1842967 | CTD or STD cast | 2015-12-27 09:07:59 | 24.503 N, 62.5543 W | RRS Discovery DY040 |
| 1895532 | Water sample data | 2015-12-27 10:49:00 | 24.50299 N, 62.5543 W | RRS Discovery DY040 |
| 1842979 | CTD or STD cast | 2015-12-27 18:06:49 | 24.4997 N, 61.8174 W | RRS Discovery DY040 |
| 1895544 | Water sample data | 2015-12-27 19:48:00 | 24.4997 N, 61.8174 W | RRS Discovery DY040 |
| 1842980 | CTD or STD cast | 2015-12-28 03:04:01 | 24.5004 N, 61.0834 W | RRS Discovery DY040 |
| 1895556 | Water sample data | 2015-12-28 04:43:00 | 24.50036 N, 61.08344 W | RRS Discovery DY040 |
| 1842992 | CTD or STD cast | 2015-12-28 11:39:32 | 24.4992 N, 60.3509 W | RRS Discovery DY040 |
| 1895568 | Water sample data | 2015-12-28 13:24:00 | 24.49924 N, 60.3509 W | RRS Discovery DY040 |
| 1843006 | CTD or STD cast | 2015-12-28 20:11:09 | 24.5002 N, 59.6163 W | RRS Discovery DY040 |
| 1895581 | Water sample data | 2015-12-28 21:56:00 | 24.50015 N, 59.61628 W | RRS Discovery DY040 |
| 1843018 | CTD or STD cast | 2015-12-29 04:28:19 | 24.4995 N, 58.8832 W | RRS Discovery DY040 |
| 1895593 | Water sample data | 2015-12-29 06:07:00 | 24.49949 N, 58.88324 W | RRS Discovery DY040 |
| 1843031 | CTD or STD cast | 2015-12-29 12:46:35 | 24.5 N, 58.1505 W | RRS Discovery DY040 |
| 1895600 | Water sample data | 2015-12-29 14:32:00 | 24.50002 N, 58.15049 W | RRS Discovery DY040 |
| 1843043 | CTD or STD cast | 2015-12-29 21:13:25 | 24.5021 N, 57.4169 W | RRS Discovery DY040 |
| 1895612 | Water sample data | 2015-12-29 23:01:00 | 24.50206 N, 57.41692 W | RRS Discovery DY040 |
| 1843055 | CTD or STD cast | 2015-12-30 05:26:36 | 24.5 N, 56.6834 W | RRS Discovery DY040 |
| 1895624 | Water sample data | 2015-12-30 07:14:00 | 24.5 N, 56.68337 W | RRS Discovery DY040 |
| 1843067 | CTD or STD cast | 2015-12-30 14:03:40 | 24.5 N, 55.9505 W | RRS Discovery DY040 |
| 1895636 | Water sample data | 2015-12-30 15:54:00 | 24.49998 N, 55.95053 W | RRS Discovery DY040 |
| 1843079 | CTD or STD cast | 2015-12-30 22:25:32 | 24.5003 N, 55.2185 W | RRS Discovery DY040 |
| 1895648 | Water sample data | 2015-12-31 00:21:00 | 24.50027 N, 55.21845 W | RRS Discovery DY040 |
| 1843080 | CTD or STD cast | 2015-12-31 06:43:58 | 24.5001 N, 54.4831 W | RRS Discovery DY040 |
| 1895661 | Water sample data | 2015-12-31 08:11:00 | 24.50013 N, 54.4831 W | RRS Discovery DY040 |
| 1843092 | CTD or STD cast | 2015-12-31 14:46:59 | 24.4996 N, 53.751 W | RRS Discovery DY040 |
| 1895673 | Water sample data | 2015-12-31 16:30:00 | 24.49957 N, 53.75104 W | RRS Discovery DY040 |
| 1843111 | CTD or STD cast | 2015-12-31 23:03:24 | 24.5006 N, 53.0179 W | RRS Discovery DY040 |
| 1895685 | Water sample data | 2016-01-01 00:40:00 | 24.50058 N, 53.01792 W | RRS Discovery DY040 |
| 1843123 | CTD or STD cast | 2016-01-01 07:00:37 | 24.5 N, 52.2839 W | RRS Discovery DY040 |
| 1895697 | Water sample data | 2016-01-01 08:40:00 | 24.49995 N, 52.28386 W | RRS Discovery DY040 |
| 1843135 | CTD or STD cast | 2016-01-01 15:06:23 | 24.5001 N, 51.5502 W | RRS Discovery DY040 |
| 1895704 | Water sample data | 2016-01-01 16:41:00 | 24.50015 N, 51.55017 W | RRS Discovery DY040 |
| 1843147 | CTD or STD cast | 2016-01-01 22:53:23 | 24.4996 N, 50.8158 W | RRS Discovery DY040 |
| 1895716 | Water sample data | 2016-01-02 00:28:00 | 24.49963 N, 50.81579 W | RRS Discovery DY040 |
| 1843159 | CTD or STD cast | 2016-01-02 06:37:51 | 24.5005 N, 50.0834 W | RRS Discovery DY040 |
| 1895728 | Water sample data | 2016-01-02 08:02:00 | 24.50051 N, 50.08341 W | RRS Discovery DY040 |
| 1843160 | CTD or STD cast | 2016-01-02 14:15:36 | 24.5004 N, 49.35 W | RRS Discovery DY040 |
| 1895741 | Water sample data | 2016-01-02 15:55:00 | 24.50039 N, 49.34996 W | RRS Discovery DY040 |
| 1843172 | CTD or STD cast | 2016-01-02 23:56:14 | 24.4991 N, 48.6174 W | RRS Discovery DY040 |
| 1895753 | Water sample data | 2016-01-03 01:06:00 | 24.49911 N, 48.61735 W | RRS Discovery DY040 |
| 1843184 | CTD or STD cast | 2016-01-03 07:14:28 | 24.5005 N, 47.8833 W | RRS Discovery DY040 |
| 1895765 | Water sample data | 2016-01-03 08:25:00 | 24.50049 N, 47.88333 W | RRS Discovery DY040 |
| 1843196 | CTD or STD cast | 2016-01-03 14:25:42 | 24.4992 N, 47.1503 W | RRS Discovery DY040 |
| 1895777 | Water sample data | 2016-01-03 15:35:00 | 24.49925 N, 47.15029 W | RRS Discovery DY040 |
| 1843203 | CTD or STD cast | 2016-01-03 20:52:59 | 24.4999 N, 46.5003 W | RRS Discovery DY040 |
| 1895789 | Water sample data | 2016-01-03 21:59:00 | 24.49989 N, 46.50032 W | RRS Discovery DY040 |
| 1843215 | CTD or STD cast | 2016-01-04 03:17:41 | 24.5004 N, 45.8509 W | RRS Discovery DY040 |
| 1895790 | Water sample data | 2016-01-04 04:14:00 | 24.5004 N, 45.85088 W | RRS Discovery DY040 |
| 1843227 | CTD or STD cast | 2016-01-04 09:13:58 | 24.4992 N, 45.1999 W | RRS Discovery DY040 |
| 1895808 | Water sample data | 2016-01-04 10:17:00 | 24.49925 N, 45.19992 W | RRS Discovery DY040 |
| 1843239 | CTD or STD cast | 2016-01-04 15:54:52 | 24.5003 N, 44.551 W | RRS Discovery DY040 |
| 1895821 | Water sample data | 2016-01-04 17:07:00 | 24.50032 N, 44.55096 W | RRS Discovery DY040 |
| 1843240 | CTD or STD cast | 2016-01-04 22:38:23 | 24.5 N, 43.9015 W | RRS Discovery DY040 |
| 1895833 | Water sample data | 2016-01-04 23:51:00 | 24.49998 N, 43.90148 W | RRS Discovery DY040 |
| 1843252 | CTD or STD cast | 2016-01-05 05:10:34 | 24.5001 N, 43.251 W | RRS Discovery DY040 |
| 1895845 | Water sample data | 2016-01-05 06:14:00 | 24.5001 N, 43.25099 W | RRS Discovery DY040 |
| 1843264 | CTD or STD cast | 2016-01-05 12:03:09 | 24.5002 N, 42.6004 W | RRS Discovery DY040 |
| 1895857 | Water sample data | 2016-01-05 13:22:00 | 24.50019 N, 42.60044 W | RRS Discovery DY040 |
| 1843276 | CTD or STD cast | 2016-01-05 19:19:18 | 24.4989 N, 41.9512 W | RRS Discovery DY040 |
| 1895869 | Water sample data | 2016-01-05 20:34:00 | 24.49891 N, 41.95117 W | RRS Discovery DY040 |
| 1843288 | CTD or STD cast | 2016-01-06 02:25:18 | 24.5 N, 41.3005 W | RRS Discovery DY040 |
| 1895870 | Water sample data | 2016-01-06 03:49:00 | 24.50001 N, 41.30048 W | RRS Discovery DY040 |
| 1843307 | CTD or STD cast | 2016-01-06 09:29:19 | 24.4995 N, 40.6491 W | RRS Discovery DY040 |
| 1895882 | Water sample data | 2016-01-06 11:01:00 | 24.49952 N, 40.64905 W | RRS Discovery DY040 |
| 1843319 | CTD or STD cast | 2016-01-06 16:50:45 | 24.4995 N, 40.0008 W | RRS Discovery DY040 |
| 1895894 | Water sample data | 2016-01-06 18:30:00 | 24.49953 N, 40.00082 W | RRS Discovery DY040 |
| 1843320 | CTD or STD cast | 2016-01-07 00:31:26 | 24.5007 N, 39.3502 W | RRS Discovery DY040 |
| 1895901 | Water sample data | 2016-01-07 02:02:00 | 24.50065 N, 39.35024 W | RRS Discovery DY040 |
| 1843332 | CTD or STD cast | 2016-01-07 07:34:52 | 24.5022 N, 38.6992 W | RRS Discovery DY040 |
| 1895913 | Water sample data | 2016-01-07 08:59:00 | 24.50221 N, 38.69916 W | RRS Discovery DY040 |
| 1843344 | CTD or STD cast | 2016-01-07 14:31:36 | 24.4992 N, 38.0671 W | RRS Discovery DY040 |
| 1895925 | Water sample data | 2016-01-07 16:10:00 | 24.49918 N, 38.06709 W | RRS Discovery DY040 |
| 1843356 | CTD or STD cast | 2016-01-07 21:39:49 | 24.5015 N, 37.4338 W | RRS Discovery DY040 |
| 1895937 | Water sample data | 2016-01-07 23:29:00 | 24.50153 N, 37.43381 W | RRS Discovery DY040 |
| 1843368 | CTD or STD cast | 2016-01-08 05:09:35 | 24.4996 N, 36.8003 W | RRS Discovery DY040 |
| 1895949 | Water sample data | 2016-01-08 06:58:00 | 24.49959 N, 36.80033 W | RRS Discovery DY040 |
| 1843381 | CTD or STD cast | 2016-01-08 12:54:51 | 24.4999 N, 36.1674 W | RRS Discovery DY040 |
| 1895950 | Water sample data | 2016-01-08 14:38:00 | 24.49994 N, 36.16738 W | RRS Discovery DY040 |
| 1843393 | CTD or STD cast | 2016-01-08 20:22:58 | 24.5024 N, 35.5341 W | RRS Discovery DY040 |
| 1895962 | Water sample data | 2016-01-08 22:03:00 | 24.50236 N, 35.5341 W | RRS Discovery DY040 |
| 1843400 | CTD or STD cast | 2016-01-09 03:31:59 | 24.4997 N, 34.8998 W | RRS Discovery DY040 |
| 1895974 | Water sample data | 2016-01-09 05:21:00 | 24.4997 N, 34.89983 W | RRS Discovery DY040 |
| 1843412 | CTD or STD cast | 2016-01-09 11:29:56 | 24.5 N, 34.2668 W | RRS Discovery DY040 |
| 1895986 | Water sample data | 2016-01-09 13:15:00 | 24.50004 N, 34.26684 W | RRS Discovery DY040 |
| 1843424 | CTD or STD cast | 2016-01-09 19:07:42 | 24.5017 N, 33.6359 W | RRS Discovery DY040 |
| 1895998 | Water sample data | 2016-01-09 20:51:00 | 24.50173 N, 33.63592 W | RRS Discovery DY040 |
| 1843436 | CTD or STD cast | 2016-01-10 02:48:42 | 24.5003 N, 33.0 W | RRS Discovery DY040 |
| 1896001 | Water sample data | 2016-01-10 04:32:00 | 24.5003 N, 33.0 W | RRS Discovery DY040 |
| 1843448 | CTD or STD cast | 2016-01-10 10:32:56 | 24.5008 N, 32.3659 W | RRS Discovery DY040 |
| 1896013 | Water sample data | 2016-01-10 12:14:00 | 24.50082 N, 32.36592 W | RRS Discovery DY040 |
| 1843461 | CTD or STD cast | 2016-01-10 17:59:44 | 24.5006 N, 31.7335 W | RRS Discovery DY040 |
| 1896025 | Water sample data | 2016-01-10 19:51:00 | 24.50056 N, 31.7335 W | RRS Discovery DY040 |
| 1843473 | CTD or STD cast | 2016-01-11 01:45:47 | 24.5002 N, 31.0998 W | RRS Discovery DY040 |
| 1896037 | Water sample data | 2016-01-11 03:27:00 | 24.5002 N, 31.09981 W | RRS Discovery DY040 |
| 1843485 | CTD or STD cast | 2016-01-11 08:58:24 | 24.4989 N, 30.4675 W | RRS Discovery DY040 |
| 1896049 | Water sample data | 2016-01-11 10:43:00 | 24.49885 N, 30.46751 W | RRS Discovery DY040 |
| 1843497 | CTD or STD cast | 2016-01-11 16:36:18 | 24.5002 N, 29.8335 W | RRS Discovery DY040 |
| 1896050 | Water sample data | 2016-01-11 18:12:00 | 24.50024 N, 29.83353 W | RRS Discovery DY040 |
| 1843504 | CTD or STD cast | 2016-01-11 23:59:25 | 24.5 N, 29.1999 W | RRS Discovery DY040 |
| 1896062 | Water sample data | 2016-01-12 01:44:00 | 24.50004 N, 29.19988 W | RRS Discovery DY040 |
| 1843516 | CTD or STD cast | 2016-01-12 07:29:36 | 24.5001 N, 28.5684 W | RRS Discovery DY040 |
| 1843528 | CTD or STD cast | 2016-01-12 15:30:33 | 24.4997 N, 27.9335 W | RRS Discovery DY040 |
| 1843541 | CTD or STD cast | 2016-01-14 08:55:59 | 24.5028 N, 27.214 W | RRS Discovery DY040 |
| 1843553 | CTD or STD cast | 2016-01-14 17:09:27 | 24.5003 N, 26.4748 W | RRS Discovery DY040 |
| 1843565 | CTD or STD cast | 2016-01-15 01:11:14 | 24.5007 N, 25.7332 W | RRS Discovery DY040 |
| 1843577 | CTD or STD cast | 2016-01-15 06:52:34 | 24.4985 N, 25.3573 W | RRS Discovery DY040 |
| 1843589 | CTD or STD cast | 2016-01-15 12:26:59 | 24.4998 N, 24.9919 W | RRS Discovery DY040 |
| 1843590 | CTD or STD cast | 2016-01-15 20:13:44 | 24.4983 N, 24.2501 W | RRS Discovery DY040 |
| 1843608 | CTD or STD cast | 2016-01-16 04:06:04 | 24.4998 N, 23.5003 W | RRS Discovery DY040 |
| 1843621 | CTD or STD cast | 2016-01-16 11:40:39 | 24.7082 N, 22.8835 W | RRS Discovery DY040 |
| 1843633 | CTD or STD cast | 2016-01-16 18:48:00 | 24.9169 N, 22.2672 W | RRS Discovery DY040 |
| 1843645 | CTD or STD cast | 2016-01-17 02:06:48 | 25.1261 N, 21.6498 W | RRS Discovery DY040 |
| 1843657 | CTD or STD cast | 2016-01-17 08:59:13 | 25.3344 N, 21.0338 W | RRS Discovery DY040 |
| 1843669 | CTD or STD cast | 2016-01-17 16:01:12 | 25.5426 N, 20.4175 W | RRS Discovery DY040 |
| 1843670 | CTD or STD cast | 2016-01-17 22:55:38 | 25.7513 N, 19.8005 W | RRS Discovery DY040 |
| 1843682 | CTD or STD cast | 2016-01-18 05:24:03 | 25.9609 N, 19.1836 W | RRS Discovery DY040 |
| 1843694 | CTD or STD cast | 2016-01-18 11:54:57 | 26.168 N, 18.5669 W | RRS Discovery DY040 |
| 1843701 | CTD or STD cast | 2016-01-18 18:21:09 | 26.3783 N, 17.9508 W | RRS Discovery DY040 |
| 1843713 | CTD or STD cast | 2016-01-19 00:54:42 | 26.5855 N, 17.3335 W | RRS Discovery DY040 |
| 1843725 | CTD or STD cast | 2016-01-19 07:14:47 | 26.7954 N, 16.7178 W | RRS Discovery DY040 |
| 1843737 | CTD or STD cast | 2016-01-19 13:59:23 | 27.0026 N, 16.1008 W | RRS Discovery DY040 |
| 1843749 | CTD or STD cast | 2016-01-19 21:43:47 | 27.2109 N, 15.4835 W | RRS Discovery DY040 |
| 1843750 | CTD or STD cast | 2016-01-20 03:50:14 | 27.42 N, 14.8689 W | RRS Discovery DY040 |
| 1843762 | CTD or STD cast | 2016-01-20 09:59:26 | 27.6291 N, 14.2511 W | RRS Discovery DY040 |
| 1843774 | CTD or STD cast | 2016-01-20 14:45:31 | 27.7856 N, 13.7843 W | RRS Discovery DY040 |
| 1843786 | CTD or STD cast | 2016-01-20 17:33:05 | 27.8653 N, 13.5508 W | RRS Discovery DY040 |
| 1843798 | CTD or STD cast | 2016-01-20 19:47:02 | 27.9133 N, 13.4086 W | RRS Discovery DY040 |
| 1843805 | CTD or STD cast | 2016-01-20 21:27:09 | 27.9267 N, 13.3671 W | RRS Discovery DY040 |
| 1896086 | Water sample data | 2016-01-12 17:14:00 | 24.49965 N, 27.93349 W | RRS Discovery DY040 |
| 1896098 | Water sample data | 2016-01-14 10:34:00 | 24.50282 N, 27.21398 W | RRS Discovery DY040 |
| 1896105 | Water sample data | 2016-01-14 18:47:00 | 24.50033 N, 26.47485 W | RRS Discovery DY040 |
| 1896117 | Water sample data | 2016-01-15 02:45:00 | 24.50074 N, 25.73321 W | RRS Discovery DY040 |
| 1896129 | Water sample data | 2016-01-15 14:02:00 | 24.49976 N, 24.99189 W | RRS Discovery DY040 |
| 1896130 | Water sample data | 2016-01-15 21:46:00 | 24.49831 N, 24.25008 W | RRS Discovery DY040 |
| 1896142 | Water sample data | 2016-01-16 05:46:00 | 24.4998 N, 23.5003 W | RRS Discovery DY040 |
| 1896154 | Water sample data | 2016-01-16 13:09:00 | 24.70819 N, 22.88352 W | RRS Discovery DY040 |
| 1896166 | Water sample data | 2016-01-16 20:18:00 | 24.91691 N, 22.26717 W | RRS Discovery DY040 |
| 1896178 | Water sample data | 2016-01-17 03:29:00 | 25.12609 N, 21.64978 W | RRS Discovery DY040 |
| 1896191 | Water sample data | 2016-01-17 10:22:00 | 25.33439 N, 21.03379 W | RRS Discovery DY040 |
| 1896209 | Water sample data | 2016-01-17 17:18:00 | 25.54257 N, 20.41748 W | RRS Discovery DY040 |
| 1896210 | Water sample data | 2016-01-18 00:05:00 | 25.75129 N, 19.80046 W | RRS Discovery DY040 |
| 1896222 | Water sample data | 2016-01-18 06:31:00 | 25.96091 N, 19.18355 W | RRS Discovery DY040 |
| 1896234 | Water sample data | 2016-01-18 12:57:00 | 26.16805 N, 18.56688 W | RRS Discovery DY040 |
| 1896246 | Water sample data | 2016-01-18 19:29:00 | 26.37832 N, 17.95081 W | RRS Discovery DY040 |
| 1896258 | Water sample data | 2016-01-19 01:59:00 | 26.58552 N, 17.33351 W | RRS Discovery DY040 |
| 1896271 | Water sample data | 2016-01-19 08:27:00 | 26.79537 N, 16.7178 W | RRS Discovery DY040 |
| 1896283 | Water sample data | 2016-01-19 15:02:00 | 27.00256 N, 16.1008 W | RRS Discovery DY040 |
| 1896295 | Water sample data | 2016-01-19 22:39:00 | 27.21087 N, 15.48352 W | RRS Discovery DY040 |
| 1896302 | Water sample data | 2016-01-20 04:39:00 | 27.41999 N, 14.86894 W | RRS Discovery DY040 |
| 1896314 | Water sample data | 2016-01-20 10:40:00 | 27.62906 N, 14.25112 W | RRS Discovery DY040 |
| 1896326 | Water sample data | 2016-01-20 15:15:00 | 27.78556 N, 13.78429 W | RRS Discovery DY040 |
| 1896338 | Water sample data | 2016-01-20 17:58:00 | 27.86528 N, 13.55085 W | RRS Discovery DY040 |
| 1896351 | Water sample data | 2016-01-20 20:05:00 | 27.91334 N, 13.40859 W | RRS Discovery DY040 |
| 1896363 | Water sample data | 2016-01-20 21:38:00 | 27.92669 N, 13.36707 W | RRS Discovery DY040 |
| 2026483 | Currents -subsurface Eulerian | 2020-01-19 19:25:56 | 26.50885 N, 78.82784 W | RRS James Cook JC191 |
| 2026495 | Currents -subsurface Eulerian | 2020-01-19 19:25:57 | 26.50886 N, 78.82783 W | RRS James Cook JC191 |
| 2023995 | CTD or STD cast | 2020-01-20 00:01:12 | 26.4335 N, 78.667 W | RRS James Cook JC191 |
| 2204938 | Currents -subsurface Eulerian | 2020-01-20 00:01:12 | 26.43346 N, 78.66696 W | RRS James Cook JC191 |
| 2025455 | CTD or STD cast | 2020-01-20 14:18:18 | 26.9997 N, 80.0011 W | RRS James Cook JC191 |
| 2290125 | Water sample data | 2020-01-20 14:18:18 | 26.9997 N, 80.0011 W | RRS James Cook JC191 |
| 2024009 | CTD or STD cast | 2020-01-20 15:44:53 | 27.0055 N, 79.9883 W | RRS James Cook JC191 |
| 2290137 | Water sample data | 2020-01-20 15:44:53 | 27.0055 N, 79.9883 W | RRS James Cook JC191 |
| 2024010 | CTD or STD cast | 2020-01-20 18:14:38 | 27.0125 N, 79.9326 W | RRS James Cook JC191 |
| 2290149 | Water sample data | 2020-01-20 18:14:38 | 27.0125 N, 79.9326 W | RRS James Cook JC191 |
| 2024022 | CTD or STD cast | 2020-01-20 21:12:54 | 27.0145 N, 79.8662 W | RRS James Cook JC191 |
| 2203554 | Currents -subsurface Eulerian | 2020-01-20 21:12:54 | 27.01583 N, 79.8662 W | RRS James Cook JC191 |
| 2290150 | Water sample data | 2020-01-20 21:12:54 | 27.0145 N, 79.8662 W | RRS James Cook JC191 |
| 2024034 | CTD or STD cast | 2020-01-21 00:17:06 | 27.0138 N, 79.7836 W | RRS James Cook JC191 |
| 2203566 | Currents -subsurface Eulerian | 2020-01-21 00:17:06 | 27.01725 N, 79.78354 W | RRS James Cook JC191 |
| 2290162 | Water sample data | 2020-01-21 00:17:06 | 27.0138 N, 79.7836 W | RRS James Cook JC191 |
| 2024046 | CTD or STD cast | 2020-01-21 03:35:37 | 27.0164 N, 79.6838 W | RRS James Cook JC191 |
| 2203578 | Currents -subsurface Eulerian | 2020-01-21 03:35:37 | 27.01959 N, 79.68375 W | RRS James Cook JC191 |
| 2290174 | Water sample data | 2020-01-21 03:35:37 | 27.0164 N, 79.6838 W | RRS James Cook JC191 |
| 2024058 | CTD or STD cast | 2020-01-21 06:30:48 | 27.0137 N, 79.6168 W | RRS James Cook JC191 |
| 2203591 | Currents -subsurface Eulerian | 2020-01-21 06:30:48 | 27.01509 N, 79.61686 W | RRS James Cook JC191 |
| 2290186 | Water sample data | 2020-01-21 06:30:48 | 27.0137 N, 79.6168 W | RRS James Cook JC191 |
| 2024071 | CTD or STD cast | 2020-01-21 09:42:16 | 27.0084 N, 79.4992 W | RRS James Cook JC191 |
| 2203609 | Currents -subsurface Eulerian | 2020-01-21 09:42:16 | 27.00911 N, 79.49924 W | RRS James Cook JC191 |
| 2290198 | Water sample data | 2020-01-21 09:42:16 | 27.0084 N, 79.4992 W | RRS James Cook JC191 |
| 2024083 | CTD or STD cast | 2020-01-21 12:34:59 | 27.0053 N, 79.3655 W | RRS James Cook JC191 |
| 2203610 | Currents -subsurface Eulerian | 2020-01-21 12:34:59 | 27.00612 N, 79.36547 W | RRS James Cook JC191 |
| 2290205 | Water sample data | 2020-01-21 12:34:59 | 27.0053 N, 79.3655 W | RRS James Cook JC191 |
| 2024095 | CTD or STD cast | 2020-01-21 15:28:50 | 27.0036 N, 79.2843 W | RRS James Cook JC191 |
| 2203622 | Currents -subsurface Eulerian | 2020-01-21 15:28:50 | 27.00495 N, 79.28433 W | RRS James Cook JC191 |
| 2290217 | Water sample data | 2020-01-21 15:28:50 | 27.0036 N, 79.2843 W | RRS James Cook JC191 |
| 2024102 | CTD or STD cast | 2020-01-21 17:57:47 | 27.0016 N, 79.2007 W | RRS James Cook JC191 |
| 2203634 | Currents -subsurface Eulerian | 2020-01-21 17:57:47 | 27.00251 N, 79.20072 W | RRS James Cook JC191 |
| 2290229 | Water sample data | 2020-01-21 17:57:47 | 27.0016 N, 79.2007 W | RRS James Cook JC191 |
| 2024114 | CTD or STD cast | 2020-01-21 20:44:22 | 27.0011 N, 79.1691 W | RRS James Cook JC191 |
| 2203646 | Currents -subsurface Eulerian | 2020-01-21 20:44:22 | 27.00168 N, 79.16967 W | RRS James Cook JC191 |
| 2290230 | Water sample data | 2020-01-21 20:44:22 | 27.0011 N, 79.1691 W | RRS James Cook JC191 |
| 2024126 | CTD or STD cast | 2020-01-22 23:48:14 | 26.5007 N, 76.9314 W | RRS James Cook JC191 |
| 2203658 | Currents -subsurface Eulerian | 2020-01-22 23:48:14 | 26.50071 N, 76.93138 W | RRS James Cook JC191 |
| 2290242 | Water sample data | 2020-01-22 23:48:14 | 26.5007 N, 76.9314 W | RRS James Cook JC191 |
| 2024138 | CTD or STD cast | 2020-01-23 02:53:07 | 26.4996 N, 76.8658 W | RRS James Cook JC191 |
| 2203671 | Currents -subsurface Eulerian | 2020-01-23 02:53:07 | 26.49962 N, 76.8658 W | RRS James Cook JC191 |
| 2290254 | Water sample data | 2020-01-23 02:53:07 | 26.4996 N, 76.8658 W | RRS James Cook JC191 |
| 2024151 | CTD or STD cast | 2020-01-23 05:37:19 | 26.516 N, 76.8254 W | RRS James Cook JC191 |
| 2203683 | Currents -subsurface Eulerian | 2020-01-23 05:37:19 | 26.51601 N, 76.82538 W | RRS James Cook JC191 |
| 2024163 | CTD or STD cast | 2020-01-23 08:48:32 | 26.4981 N, 76.8012 W | RRS James Cook JC191 |
| 2203695 | Currents -subsurface Eulerian | 2020-01-23 08:48:32 | 26.49813 N, 76.80121 W | RRS James Cook JC191 |
| 2290266 | Water sample data | 2020-01-23 08:48:32 | 26.4981 N, 76.8012 W | RRS James Cook JC191 |
| 2024175 | CTD or STD cast | 2020-01-23 12:09:24 | 26.4993 N, 76.7838 W | RRS James Cook JC191 |
| 2203702 | Currents -subsurface Eulerian | 2020-01-23 12:09:24 | 26.4993 N, 76.78379 W | RRS James Cook JC191 |
| 2290278 | Water sample data | 2020-01-23 12:09:24 | 26.4993 N, 76.7838 W | RRS James Cook JC191 |
| 2024187 | CTD or STD cast | 2020-01-23 16:42:37 | 26.4971 N, 76.7617 W | RRS James Cook JC191 |
| 2203714 | Currents -subsurface Eulerian | 2020-01-23 16:42:37 | 26.49599 N, 76.76321 W | RRS James Cook JC191 |
| 2290291 | Water sample data | 2020-01-23 16:42:37 | 26.4971 N, 76.7617 W | RRS James Cook JC191 |
| 2024199 | CTD or STD cast | 2020-01-23 22:13:20 | 26.4963 N, 76.6894 W | RRS James Cook JC191 |
| 2203726 | Currents -subsurface Eulerian | 2020-01-23 22:13:20 | 26.49708 N, 76.68819 W | RRS James Cook JC191 |
| 2290309 | Water sample data | 2020-01-23 22:13:20 | 26.4963 N, 76.6894 W | RRS James Cook JC191 |
| 2024206 | CTD or STD cast | 2020-01-24 02:57:58 | 26.496 N, 76.6896 W | RRS James Cook JC191 |
| 2203738 | Currents -subsurface Eulerian | 2020-01-24 02:57:58 | 26.49612 N, 76.68951 W | RRS James Cook JC191 |
| 2024218 | CTD or STD cast | 2020-01-24 07:20:49 | 26.4981 N, 76.6209 W | RRS James Cook JC191 |
| 2203751 | Currents -subsurface Eulerian | 2020-01-24 07:20:49 | 26.49741 N, 76.62218 W | RRS James Cook JC191 |
| 2290310 | Water sample data | 2020-01-24 07:20:49 | 26.4981 N, 76.6209 W | RRS James Cook JC191 |
| 2024231 | CTD or STD cast | 2020-01-24 12:29:31 | 26.5005 N, 76.5339 W | RRS James Cook JC191 |
| 2203763 | Currents -subsurface Eulerian | 2020-01-24 12:29:31 | 26.4986 N, 76.5394 W | RRS James Cook JC191 |
| 2290322 | Water sample data | 2020-01-24 12:29:31 | 26.5005 N, 76.5339 W | RRS James Cook JC191 |
| 2024243 | CTD or STD cast | 2020-01-24 17:50:33 | 26.4966 N, 76.4409 W | RRS James Cook JC191 |
| 2203775 | Currents -subsurface Eulerian | 2020-01-24 17:50:33 | 26.49845 N, 76.43779 W | RRS James Cook JC191 |
| 2290334 | Water sample data | 2020-01-24 17:50:33 | 26.4966 N, 76.4409 W | RRS James Cook JC191 |
| 2024255 | CTD or STD cast | 2020-01-24 23:31:56 | 26.4993 N, 76.3003 W | RRS James Cook JC191 |
| 2203787 | Currents -subsurface Eulerian | 2020-01-24 23:31:56 | 26.49873 N, 76.30161 W | RRS James Cook JC191 |
| 2290346 | Water sample data | 2020-01-24 23:31:56 | 26.4993 N, 76.3003 W | RRS James Cook JC191 |
| 2024267 | CTD or STD cast | 2020-01-25 04:36:12 | 26.4972 N, 76.2271 W | RRS James Cook JC191 |
| 2203799 | Currents -subsurface Eulerian | 2020-01-25 04:36:12 | 26.49743 N, 76.22669 W | RRS James Cook JC191 |
| 2290358 | Water sample data | 2020-01-25 04:36:12 | 26.4972 N, 76.2271 W | RRS James Cook JC191 |
| 2024279 | CTD or STD cast | 2020-01-25 08:00:50 | 26.5001 N, 76.1506 W | RRS James Cook JC191 |
| 2024280 | CTD or STD cast | 2020-01-25 10:44:28 | 26.4994 N, 76.1015 W | RRS James Cook JC191 |
| 2203806 | Currents -subsurface Eulerian | 2020-01-25 10:44:28 | 26.49833 N, 76.10302 W | RRS James Cook JC191 |
| 2290371 | Water sample data | 2020-01-25 10:44:28 | 26.4994 N, 76.1015 W | RRS James Cook JC191 |
| 2024292 | CTD or STD cast | 2020-01-25 15:48:42 | 26.4899 N, 75.9112 W | RRS James Cook JC191 |
| 2203818 | Currents -subsurface Eulerian | 2020-01-25 15:48:42 | 26.4908 N, 75.91096 W | RRS James Cook JC191 |
| 2290383 | Water sample data | 2020-01-25 15:48:42 | 26.4899 N, 75.9112 W | RRS James Cook JC191 |
| 2024311 | CTD or STD cast | 2020-01-25 21:14:56 | 26.4966 N, 75.7093 W | RRS James Cook JC191 |
| 2203831 | Currents -subsurface Eulerian | 2020-01-25 21:14:56 | 26.49725 N, 75.70822 W | RRS James Cook JC191 |
| 2290395 | Water sample data | 2020-01-25 21:14:56 | 26.4966 N, 75.7093 W | RRS James Cook JC191 |
| 2024323 | CTD or STD cast | 2020-01-26 02:14:20 | 26.4967 N, 75.5065 W | RRS James Cook JC191 |
| 2203843 | Currents -subsurface Eulerian | 2020-01-26 02:14:20 | 26.49652 N, 75.50689 W | RRS James Cook JC191 |
| 2290402 | Water sample data | 2020-01-26 02:14:20 | 26.4967 N, 75.5065 W | RRS James Cook JC191 |
| 2024335 | CTD or STD cast | 2020-01-26 07:09:29 | 26.496 N, 75.3066 W | RRS James Cook JC191 |
| 2203855 | Currents -subsurface Eulerian | 2020-01-26 07:09:29 | 26.49594 N, 75.30668 W | RRS James Cook JC191 |
| 2290414 | Water sample data | 2020-01-26 07:09:29 | 26.496 N, 75.3066 W | RRS James Cook JC191 |
| 2024347 | CTD or STD cast | 2020-01-26 12:18:27 | 26.5 N, 75.0668 W | RRS James Cook JC191 |
| 2203867 | Currents -subsurface Eulerian | 2020-01-26 12:18:27 | 26.50005 N, 75.06681 W | RRS James Cook JC191 |
| 2290426 | Water sample data | 2020-01-26 12:18:27 | 26.5 N, 75.0668 W | RRS James Cook JC191 |
| 2024359 | CTD or STD cast | 2020-01-26 17:33:39 | 26.5007 N, 74.8011 W | RRS James Cook JC191 |
| 2203879 | Currents -subsurface Eulerian | 2020-01-26 17:33:39 | 26.50102 N, 74.80094 W | RRS James Cook JC191 |
| 2290438 | Water sample data | 2020-01-26 17:33:39 | 26.5007 N, 74.8011 W | RRS James Cook JC191 |
| 2024360 | CTD or STD cast | 2020-01-26 22:49:55 | 26.4997 N, 74.5173 W | RRS James Cook JC191 |
| 2203880 | Currents -subsurface Eulerian | 2020-01-26 22:49:55 | 26.49968 N, 74.51728 W | RRS James Cook JC191 |
| 2290451 | Water sample data | 2020-01-26 22:49:55 | 26.4997 N, 74.5173 W | RRS James Cook JC191 |
| 2024372 | CTD or STD cast | 2020-01-27 04:03:49 | 26.4991 N, 74.2357 W | RRS James Cook JC191 |
| 2203892 | Currents -subsurface Eulerian | 2020-01-27 04:03:49 | 26.49897 N, 74.23589 W | RRS James Cook JC191 |
| 2290463 | Water sample data | 2020-01-27 04:03:49 | 26.4991 N, 74.2357 W | RRS James Cook JC191 |
| 2024384 | CTD or STD cast | 2020-01-27 09:24:56 | 26.4999 N, 73.9334 W | RRS James Cook JC191 |
| 2203911 | Currents -subsurface Eulerian | 2020-01-27 09:24:56 | 26.49989 N, 73.93344 W | RRS James Cook JC191 |
| 2290475 | Water sample data | 2020-01-27 09:24:56 | 26.4999 N, 73.9334 W | RRS James Cook JC191 |
| 2024396 | CTD or STD cast | 2020-01-27 15:06:46 | 26.5009 N, 73.5669 W | RRS James Cook JC191 |
| 2203923 | Currents -subsurface Eulerian | 2020-01-27 15:06:46 | 26.50087 N, 73.56689 W | RRS James Cook JC191 |
| 2290487 | Water sample data | 2020-01-27 15:06:46 | 26.5009 N, 73.5669 W | RRS James Cook JC191 |
| 2024403 | CTD or STD cast | 2020-01-27 21:22:32 | 26.4996 N, 73.2007 W | RRS James Cook JC191 |
| 2203935 | Currents -subsurface Eulerian | 2020-01-27 21:22:32 | 26.49956 N, 73.20074 W | RRS James Cook JC191 |
| 2290499 | Water sample data | 2020-01-27 21:22:32 | 26.4996 N, 73.2007 W | RRS James Cook JC191 |
| 2024415 | CTD or STD cast | 2020-01-28 03:39:24 | 26.5008 N, 72.8393 W | RRS James Cook JC191 |
| 2203947 | Currents -subsurface Eulerian | 2020-01-28 03:39:24 | 26.50079 N, 72.83935 W | RRS James Cook JC191 |
| 2290506 | Water sample data | 2020-01-28 03:39:24 | 26.5008 N, 72.8393 W | RRS James Cook JC191 |
| 2024427 | CTD or STD cast | 2020-01-28 10:08:43 | 26.5018 N, 72.4674 W | RRS James Cook JC191 |
| 2203959 | Currents -subsurface Eulerian | 2020-01-28 10:08:43 | 26.50184 N, 72.46735 W | RRS James Cook JC191 |
| 2290518 | Water sample data | 2020-01-28 10:08:43 | 26.5018 N, 72.4674 W | RRS James Cook JC191 |
| 2024439 | CTD or STD cast | 2020-01-28 16:06:25 | 26.5002 N, 72.0995 W | RRS James Cook JC191 |
| 2203960 | Currents -subsurface Eulerian | 2020-01-28 16:06:25 | 26.50037 N, 72.09904 W | RRS James Cook JC191 |
| 2290531 | Water sample data | 2020-01-28 16:06:25 | 26.5002 N, 72.0995 W | RRS James Cook JC191 |
| 2024440 | CTD or STD cast | 2020-01-28 22:17:16 | 26.5002 N, 71.7319 W | RRS James Cook JC191 |
| 2203972 | Currents -subsurface Eulerian | 2020-01-28 22:17:16 | 26.50024 N, 71.73192 W | RRS James Cook JC191 |
| 2290543 | Water sample data | 2020-01-28 22:17:16 | 26.5002 N, 71.7319 W | RRS James Cook JC191 |
| 2024452 | CTD or STD cast | 2020-01-29 05:14:51 | 26.4973 N, 71.3679 W | RRS James Cook JC191 |
| 2203984 | Currents -subsurface Eulerian | 2020-01-29 05:14:51 | 26.49733 N, 71.3679 W | RRS James Cook JC191 |
| 2290555 | Water sample data | 2020-01-29 05:14:51 | 26.4973 N, 71.3679 W | RRS James Cook JC191 |
| 2024464 | CTD or STD cast | 2020-01-29 11:34:36 | 26.4962 N, 70.9985 W | RRS James Cook JC191 |
| 2203996 | Currents -subsurface Eulerian | 2020-01-29 11:34:36 | 26.49573 N, 70.99822 W | RRS James Cook JC191 |
| 2290567 | Water sample data | 2020-01-29 11:34:36 | 26.4962 N, 70.9985 W | RRS James Cook JC191 |
| 2024476 | CTD or STD cast | 2020-01-29 18:55:15 | 26.0998 N, 70.6332 W | RRS James Cook JC191 |
| 2204011 | Currents -subsurface Eulerian | 2020-01-29 18:55:15 | 26.09981 N, 70.6332 W | RRS James Cook JC191 |
| 2290579 | Water sample data | 2020-01-29 18:55:15 | 26.0998 N, 70.6332 W | RRS James Cook JC191 |
| 2024488 | CTD or STD cast | 2020-01-30 02:07:06 | 25.6957 N, 70.2649 W | RRS James Cook JC191 |
| 2204023 | Currents -subsurface Eulerian | 2020-01-30 02:07:06 | 25.69526 N, 70.26464 W | RRS James Cook JC191 |
| 2290580 | Water sample data | 2020-01-30 02:07:06 | 25.6957 N, 70.2649 W | RRS James Cook JC191 |
| 2024507 | CTD or STD cast | 2020-01-30 09:32:18 | 25.2999 N, 69.9 W | RRS James Cook JC191 |
| 2204035 | Currents -subsurface Eulerian | 2020-01-30 09:32:18 | 25.29986 N, 69.9 W | RRS James Cook JC191 |
| 2290592 | Water sample data | 2020-01-30 09:32:18 | 25.2999 N, 69.9 W | RRS James Cook JC191 |
| 2024519 | CTD or STD cast | 2020-01-30 16:59:34 | 24.8997 N, 69.5324 W | RRS James Cook JC191 |
| 2204047 | Currents -subsurface Eulerian | 2020-01-30 16:59:34 | 24.90004 N, 69.53267 W | RRS James Cook JC191 |
| 2290611 | Water sample data | 2020-01-30 16:59:34 | 24.8997 N, 69.5324 W | RRS James Cook JC191 |
| 2024520 | CTD or STD cast | 2020-01-31 00:27:41 | 24.5002 N, 69.1501 W | RRS James Cook JC191 |
| 2204059 | Currents -subsurface Eulerian | 2020-01-31 00:27:41 | 24.50018 N, 69.15015 W | RRS James Cook JC191 |
| 2290623 | Water sample data | 2020-01-31 00:27:41 | 24.5002 N, 69.1501 W | RRS James Cook JC191 |
| 2024532 | CTD or STD cast | 2020-01-31 08:46:46 | 24.5 N, 68.4148 W | RRS James Cook JC191 |
| 2204060 | Currents -subsurface Eulerian | 2020-01-31 08:46:46 | 24.4999 N, 68.41518 W | RRS James Cook JC191 |
| 2290635 | Water sample data | 2020-01-31 08:46:46 | 24.5 N, 68.4148 W | RRS James Cook JC191 |
| 2024544 | CTD or STD cast | 2020-01-31 17:23:47 | 24.5004 N, 67.6679 W | RRS James Cook JC191 |
| 2204072 | Currents -subsurface Eulerian | 2020-01-31 17:23:47 | 24.50036 N, 67.66786 W | RRS James Cook JC191 |
| 2290647 | Water sample data | 2020-01-31 17:23:47 | 24.5004 N, 67.6679 W | RRS James Cook JC191 |
| 2024556 | CTD or STD cast | 2020-02-01 02:09:34 | 24.4977 N, 66.937 W | RRS James Cook JC191 |
| 2204084 | Currents -subsurface Eulerian | 2020-02-01 02:09:34 | 24.49872 N, 66.93594 W | RRS James Cook JC191 |
| 2290659 | Water sample data | 2020-02-01 02:09:34 | 24.4977 N, 66.937 W | RRS James Cook JC191 |
| 2024568 | CTD or STD cast | 2020-02-01 10:51:04 | 24.5001 N, 66.1681 W | RRS James Cook JC191 |
| 2204096 | Currents -subsurface Eulerian | 2020-02-01 10:51:04 | 24.50016 N, 66.16806 W | RRS James Cook JC191 |
| 2290660 | Water sample data | 2020-02-01 10:51:04 | 24.5001 N, 66.1681 W | RRS James Cook JC191 |
| 2024581 | CTD or STD cast | 2020-02-01 18:59:41 | 24.4998 N, 65.4677 W | RRS James Cook JC191 |
| 2204103 | Currents -subsurface Eulerian | 2020-02-01 18:59:41 | 24.4998 N, 65.46772 W | RRS James Cook JC191 |
| 2290672 | Water sample data | 2020-02-01 18:59:41 | 24.4998 N, 65.4677 W | RRS James Cook JC191 |
| 2024593 | CTD or STD cast | 2020-02-02 03:19:19 | 24.4991 N, 64.7344 W | RRS James Cook JC191 |
| 2204115 | Currents -subsurface Eulerian | 2020-02-02 03:19:19 | 24.49905 N, 64.73436 W | RRS James Cook JC191 |
| 2290684 | Water sample data | 2020-02-02 03:19:19 | 24.4991 N, 64.7344 W | RRS James Cook JC191 |
| 2024600 | CTD or STD cast | 2020-02-02 11:42:07 | 24.5006 N, 63.9991 W | RRS James Cook JC191 |
| 2204127 | Currents -subsurface Eulerian | 2020-02-02 11:42:07 | 24.50115 N, 63.99855 W | RRS James Cook JC191 |
| 2290696 | Water sample data | 2020-02-02 11:42:07 | 24.5006 N, 63.9991 W | RRS James Cook JC191 |
| 2024612 | CTD or STD cast | 2020-02-02 20:03:01 | 24.5004 N, 63.2651 W | RRS James Cook JC191 |
| 2204139 | Currents -subsurface Eulerian | 2020-02-02 20:03:01 | 24.50081 N, 63.26458 W | RRS James Cook JC191 |
| 2290703 | Water sample data | 2020-02-02 20:03:01 | 24.5004 N, 63.2651 W | RRS James Cook JC191 |
| 2024624 | CTD or STD cast | 2020-02-03 04:33:43 | 24.4999 N, 62.5313 W | RRS James Cook JC191 |
| 2204140 | Currents -subsurface Eulerian | 2020-02-03 04:33:43 | 24.49999 N, 62.53127 W | RRS James Cook JC191 |
| 2290715 | Water sample data | 2020-02-03 04:33:43 | 24.4999 N, 62.5313 W | RRS James Cook JC191 |
| 2024636 | CTD or STD cast | 2020-02-03 13:06:52 | 24.5 N, 61.8006 W | RRS James Cook JC191 |
| 2204152 | Currents -subsurface Eulerian | 2020-02-03 13:06:52 | 24.49998 N, 61.80063 W | RRS James Cook JC191 |
| 2290727 | Water sample data | 2020-02-03 13:06:52 | 24.5 N, 61.8006 W | RRS James Cook JC191 |
| 2024648 | CTD or STD cast | 2020-02-03 21:34:05 | 24.4999 N, 61.0667 W | RRS James Cook JC191 |
| 2204164 | Currents -subsurface Eulerian | 2020-02-03 21:34:05 | 24.49988 N, 61.06666 W | RRS James Cook JC191 |
| 2290739 | Water sample data | 2020-02-03 21:34:05 | 24.4999 N, 61.0667 W | RRS James Cook JC191 |
| 2024661 | CTD or STD cast | 2020-02-04 06:13:38 | 24.4998 N, 60.3334 W | RRS James Cook JC191 |
| 2204176 | Currents -subsurface Eulerian | 2020-02-04 06:13:38 | 24.49976 N, 60.33342 W | RRS James Cook JC191 |
| 2290740 | Water sample data | 2020-02-04 06:13:38 | 24.4998 N, 60.3334 W | RRS James Cook JC191 |
| 2024673 | CTD or STD cast | 2020-02-04 14:48:01 | 24.5001 N, 59.6015 W | RRS James Cook JC191 |
| 2204188 | Currents -subsurface Eulerian | 2020-02-04 14:48:01 | 24.50012 N, 59.60153 W | RRS James Cook JC191 |
| 2290752 | Water sample data | 2020-02-04 14:48:01 | 24.5001 N, 59.6015 W | RRS James Cook JC191 |
| 2024685 | CTD or STD cast | 2020-02-04 23:30:35 | 24.5007 N, 58.8673 W | RRS James Cook JC191 |
| 2204207 | Currents -subsurface Eulerian | 2020-02-04 23:30:35 | 24.5007 N, 58.86727 W | RRS James Cook JC191 |
| 2290764 | Water sample data | 2020-02-04 23:30:35 | 24.5007 N, 58.8673 W | RRS James Cook JC191 |
| 2024697 | CTD or STD cast | 2020-02-05 08:17:31 | 24.4998 N, 58.1335 W | RRS James Cook JC191 |
| 2204219 | Currents -subsurface Eulerian | 2020-02-05 08:17:31 | 24.49983 N, 58.13348 W | RRS James Cook JC191 |
| 2290776 | Water sample data | 2020-02-05 08:17:31 | 24.4998 N, 58.1335 W | RRS James Cook JC191 |
| 2024704 | CTD or STD cast | 2020-02-05 17:27:37 | 24.4995 N, 57.3957 W | RRS James Cook JC191 |
| 2290788 | Water sample data | 2020-02-05 17:27:37 | 24.4995 N, 57.3957 W | RRS James Cook JC191 |
| 2024716 | CTD or STD cast | 2020-02-06 02:17:43 | 24.4992 N, 56.6679 W | RRS James Cook JC191 |
| 2290807 | Water sample data | 2020-02-06 02:17:43 | 24.4992 N, 56.6679 W | RRS James Cook JC191 |
| 2024728 | CTD or STD cast | 2020-02-06 11:12:04 | 24.5 N, 55.9501 W | RRS James Cook JC191 |
| 2290819 | Water sample data | 2020-02-06 11:12:04 | 24.5 N, 55.9501 W | RRS James Cook JC191 |
| 2024741 | CTD or STD cast | 2020-02-06 19:49:38 | 24.5001 N, 55.2007 W | RRS James Cook JC191 |
| 2290820 | Water sample data | 2020-02-06 19:49:38 | 24.5001 N, 55.2007 W | RRS James Cook JC191 |
| 2024753 | CTD or STD cast | 2020-02-07 04:42:52 | 24.5001 N, 54.473 W | RRS James Cook JC191 |
| 2204220 | Currents -subsurface Eulerian | 2020-02-07 04:42:52 | 24.50012 N, 54.47298 W | RRS James Cook JC191 |
| 2290832 | Water sample data | 2020-02-07 04:42:52 | 24.5001 N, 54.473 W | RRS James Cook JC191 |
| 2024765 | CTD or STD cast | 2020-02-07 13:17:06 | 24.5 N, 53.7335 W | RRS James Cook JC191 |
| 2204232 | Currents -subsurface Eulerian | 2020-02-07 13:17:06 | 24.50004 N, 53.73355 W | RRS James Cook JC191 |
| 2290844 | Water sample data | 2020-02-07 13:17:06 | 24.5 N, 53.7335 W | RRS James Cook JC191 |
| 2024777 | CTD or STD cast | 2020-02-08 05:02:07 | 24.8391 N, 53.1018 W | RRS James Cook JC191 |
| 2204244 | Currents -subsurface Eulerian | 2020-02-08 05:02:07 | 24.83909 N, 53.10176 W | RRS James Cook JC191 |
| 2290856 | Water sample data | 2020-02-08 05:02:07 | 24.8391 N, 53.1018 W | RRS James Cook JC191 |
| 2024789 | CTD or STD cast | 2020-02-08 13:04:53 | 25.1103 N, 52.668 W | RRS James Cook JC191 |
| 2204256 | Currents -subsurface Eulerian | 2020-02-08 13:04:53 | 25.1103 N, 52.66804 W | RRS James Cook JC191 |
| 2290868 | Water sample data | 2020-02-08 13:04:53 | 25.1103 N, 52.668 W | RRS James Cook JC191 |
| 2024790 | CTD or STD cast | 2020-02-08 21:05:27 | 25.1251 N, 52.1676 W | RRS James Cook JC191 |
| 2204268 | Currents -subsurface Eulerian | 2020-02-08 21:05:27 | 25.12514 N, 52.16757 W | RRS James Cook JC191 |
| 2290881 | Water sample data | 2020-02-08 21:05:27 | 25.1251 N, 52.1676 W | RRS James Cook JC191 |
| 2024808 | CTD or STD cast | 2020-02-09 05:18:26 | 25.022 N, 51.667 W | RRS James Cook JC191 |
| 2204281 | Currents -subsurface Eulerian | 2020-02-09 05:18:26 | 25.02195 N, 51.66697 W | RRS James Cook JC191 |
| 2290893 | Water sample data | 2020-02-09 05:18:26 | 25.022 N, 51.667 W | RRS James Cook JC191 |
| 2024821 | CTD or STD cast | 2020-02-09 12:51:25 | 24.9374 N, 51.1672 W | RRS James Cook JC191 |
| 2204293 | Currents -subsurface Eulerian | 2020-02-09 12:51:25 | 24.93734 N, 51.1672 W | RRS James Cook JC191 |
| 2290900 | Water sample data | 2020-02-09 12:51:25 | 24.9374 N, 51.1672 W | RRS James Cook JC191 |
| 2024833 | CTD or STD cast | 2020-02-09 21:04:40 | 24.7985 N, 50.6323 W | RRS James Cook JC191 |
| 2204300 | Currents -subsurface Eulerian | 2020-02-09 21:04:40 | 24.79846 N, 50.63224 W | RRS James Cook JC191 |
| 2290912 | Water sample data | 2020-02-09 21:04:40 | 24.7985 N, 50.6323 W | RRS James Cook JC191 |
| 2024845 | CTD or STD cast | 2020-02-10 04:47:05 | 24.669 N, 50.0904 W | RRS James Cook JC191 |
| 2204312 | Currents -subsurface Eulerian | 2020-02-10 04:47:05 | 24.66904 N, 50.09041 W | RRS James Cook JC191 |
| 2290924 | Water sample data | 2020-02-10 04:47:05 | 24.669 N, 50.0904 W | RRS James Cook JC191 |
| 2024857 | CTD or STD cast | 2020-02-10 12:29:31 | 24.5208 N, 49.5344 W | RRS James Cook JC191 |
| 2204324 | Currents -subsurface Eulerian | 2020-02-10 12:29:31 | 24.52084 N, 49.53437 W | RRS James Cook JC191 |
| 2290936 | Water sample data | 2020-02-10 12:29:31 | 24.5208 N, 49.5344 W | RRS James Cook JC191 |
| 2024869 | CTD or STD cast | 2020-02-10 20:32:43 | 24.3492 N, 49.0089 W | RRS James Cook JC191 |
| 2204336 | Currents -subsurface Eulerian | 2020-02-10 20:32:43 | 24.34913 N, 49.0089 W | RRS James Cook JC191 |
| 2290948 | Water sample data | 2020-02-10 20:32:43 | 24.3492 N, 49.0089 W | RRS James Cook JC191 |
| 2024870 | CTD or STD cast | 2020-02-11 04:09:03 | 24.1968 N, 48.4729 W | RRS James Cook JC191 |
| 2204348 | Currents -subsurface Eulerian | 2020-02-11 04:09:03 | 24.19674 N, 48.47288 W | RRS James Cook JC191 |
| 2290961 | Water sample data | 2020-02-11 04:09:03 | 24.1968 N, 48.4729 W | RRS James Cook JC191 |
| 2024882 | CTD or STD cast | 2020-02-11 11:36:15 | 24.0662 N, 47.9429 W | RRS James Cook JC191 |
| 2204361 | Currents -subsurface Eulerian | 2020-02-11 11:36:15 | 24.06625 N, 47.9429 W | RRS James Cook JC191 |
| 2290973 | Water sample data | 2020-02-11 11:36:15 | 24.0662 N, 47.9429 W | RRS James Cook JC191 |
| 2024894 | CTD or STD cast | 2020-02-11 18:38:29 | 23.9753 N, 47.4089 W | RRS James Cook JC191 |
| 2204373 | Currents -subsurface Eulerian | 2020-02-11 18:38:29 | 23.97524 N, 47.40885 W | RRS James Cook JC191 |
| 2290985 | Water sample data | 2020-02-11 18:38:29 | 23.9753 N, 47.4089 W | RRS James Cook JC191 |
| 2024901 | CTD or STD cast | 2020-02-12 01:39:02 | 23.8994 N, 46.8758 W | RRS James Cook JC191 |
| 2204385 | Currents -subsurface Eulerian | 2020-02-12 01:39:02 | 23.89938 N, 46.87576 W | RRS James Cook JC191 |
| 2290997 | Water sample data | 2020-02-12 01:39:02 | 23.8994 N, 46.8758 W | RRS James Cook JC191 |
| 2024913 | CTD or STD cast | 2020-02-12 08:43:41 | 23.8739 N, 46.3346 W | RRS James Cook JC191 |
| 2204397 | Currents -subsurface Eulerian | 2020-02-12 08:43:41 | 23.87387 N, 46.33456 W | RRS James Cook JC191 |
| 2291000 | Water sample data | 2020-02-12 08:43:41 | 23.8739 N, 46.3346 W | RRS James Cook JC191 |
| 2024925 | CTD or STD cast | 2020-02-12 15:43:00 | 23.7676 N, 45.8023 W | RRS James Cook JC191 |
| 2204404 | Currents -subsurface Eulerian | 2020-02-12 15:43:00 | 23.76762 N, 45.80232 W | RRS James Cook JC191 |
| 2291012 | Water sample data | 2020-02-12 15:43:00 | 23.7676 N, 45.8023 W | RRS James Cook JC191 |
| 2024937 | CTD or STD cast | 2020-02-12 22:28:34 | 23.7324 N, 45.2687 W | RRS James Cook JC191 |
| 2204416 | Currents -subsurface Eulerian | 2020-02-12 22:28:34 | 23.73243 N, 45.26874 W | RRS James Cook JC191 |
| 2291024 | Water sample data | 2020-02-12 22:28:34 | 23.7324 N, 45.2687 W | RRS James Cook JC191 |
| 2024949 | CTD or STD cast | 2020-02-13 05:27:33 | 23.6356 N, 44.7355 W | RRS James Cook JC191 |
| 2204428 | Currents -subsurface Eulerian | 2020-02-13 05:27:33 | 23.6356 N, 44.73546 W | RRS James Cook JC191 |
| 2291036 | Water sample data | 2020-02-13 05:27:33 | 23.6356 N, 44.7355 W | RRS James Cook JC191 |
| 2024950 | CTD or STD cast | 2020-02-13 12:14:25 | 23.535 N, 44.2086 W | RRS James Cook JC191 |
| 2204441 | Currents -subsurface Eulerian | 2020-02-13 12:14:25 | 23.53502 N, 44.2086 W | RRS James Cook JC191 |
| 2291048 | Water sample data | 2020-02-13 12:14:25 | 23.535 N, 44.2086 W | RRS James Cook JC191 |
| 2024962 | CTD or STD cast | 2020-02-13 19:18:33 | 23.45 N, 43.6724 W | RRS James Cook JC191 |
| 2204453 | Currents -subsurface Eulerian | 2020-02-13 19:18:33 | 23.44995 N, 43.67238 W | RRS James Cook JC191 |
| 2291061 | Water sample data | 2020-02-13 19:18:33 | 23.45 N, 43.6724 W | RRS James Cook JC191 |
| 2024974 | CTD or STD cast | 2020-02-14 02:29:04 | 23.3731 N, 43.1416 W | RRS James Cook JC191 |
| 2204465 | Currents -subsurface Eulerian | 2020-02-14 02:29:04 | 23.37314 N, 43.14158 W | RRS James Cook JC191 |
| 2291073 | Water sample data | 2020-02-14 02:29:04 | 23.3731 N, 43.1416 W | RRS James Cook JC191 |
| 2024986 | CTD or STD cast | 2020-02-14 09:43:40 | 23.2504 N, 42.6006 W | RRS James Cook JC191 |
| 2204477 | Currents -subsurface Eulerian | 2020-02-14 09:43:40 | 23.25036 N, 42.60058 W | RRS James Cook JC191 |
| 2291085 | Water sample data | 2020-02-14 09:43:40 | 23.2504 N, 42.6006 W | RRS James Cook JC191 |
| 2024998 | CTD or STD cast | 2020-02-14 17:52:03 | 23.3336 N, 41.8837 W | RRS James Cook JC191 |
| 2204489 | Currents -subsurface Eulerian | 2020-02-14 17:52:03 | 23.33359 N, 41.88368 W | RRS James Cook JC191 |
| 2291097 | Water sample data | 2020-02-14 17:52:03 | 23.3336 N, 41.8837 W | RRS James Cook JC191 |
| 2025001 | CTD or STD cast | 2020-02-14 23:32:42 | 23.4002 N, 41.467 W | RRS James Cook JC191 |
| 2204490 | Currents -subsurface Eulerian | 2020-02-14 23:32:42 | 23.40022 N, 41.46702 W | RRS James Cook JC191 |
| 2025013 | CTD or STD cast | 2020-02-15 04:44:48 | 23.4499 N, 41.0501 W | RRS James Cook JC191 |
| 2204508 | Currents -subsurface Eulerian | 2020-02-15 04:44:48 | 23.44993 N, 41.05008 W | RRS James Cook JC191 |
| 2291104 | Water sample data | 2020-02-15 04:44:48 | 23.4499 N, 41.0501 W | RRS James Cook JC191 |
| 2025025 | CTD or STD cast | 2020-02-15 12:58:41 | 23.5796 N, 40.3333 W | RRS James Cook JC191 |
| 2204521 | Currents -subsurface Eulerian | 2020-02-15 12:58:41 | 23.57964 N, 40.3333 W | RRS James Cook JC191 |
| 2291116 | Water sample data | 2020-02-15 12:58:41 | 23.5796 N, 40.3333 W | RRS James Cook JC191 |
| 2025037 | CTD or STD cast | 2020-02-15 21:19:54 | 23.7096 N, 39.6166 W | RRS James Cook JC191 |
| 2204533 | Currents -subsurface Eulerian | 2020-02-15 21:19:54 | 23.70954 N, 39.6166 W | RRS James Cook JC191 |
| 2291128 | Water sample data | 2020-02-15 21:19:54 | 23.7096 N, 39.6166 W | RRS James Cook JC191 |
| 2025049 | CTD or STD cast | 2020-02-16 05:37:59 | 23.839 N, 38.9001 W | RRS James Cook JC191 |
| 2204545 | Currents -subsurface Eulerian | 2020-02-16 05:37:59 | 23.83905 N, 38.90008 W | RRS James Cook JC191 |
| 2291141 | Water sample data | 2020-02-16 05:37:59 | 23.839 N, 38.9001 W | RRS James Cook JC191 |
| 2025050 | CTD or STD cast | 2020-02-16 14:03:56 | 23.9691 N, 38.1825 W | RRS James Cook JC191 |
| 2204557 | Currents -subsurface Eulerian | 2020-02-16 14:03:56 | 23.96907 N, 38.18249 W | RRS James Cook JC191 |
| 2291153 | Water sample data | 2020-02-16 14:03:56 | 23.9691 N, 38.1825 W | RRS James Cook JC191 |
| 2025062 | CTD or STD cast | 2020-02-16 22:39:30 | 24.1008 N, 37.4739 W | RRS James Cook JC191 |
| 2204569 | Currents -subsurface Eulerian | 2020-02-16 22:39:30 | 24.10099 N, 37.47323 W | RRS James Cook JC191 |
| 2291165 | Water sample data | 2020-02-16 22:39:30 | 24.1008 N, 37.4739 W | RRS James Cook JC191 |
| 2025074 | CTD or STD cast | 2020-02-17 07:15:13 | 24.2284 N, 36.7507 W | RRS James Cook JC191 |
| 2204570 | Currents -subsurface Eulerian | 2020-02-17 07:15:13 | 24.22838 N, 36.75068 W | RRS James Cook JC191 |
| 2291177 | Water sample data | 2020-02-17 07:15:13 | 24.2284 N, 36.7507 W | RRS James Cook JC191 |
| 2025086 | CTD or STD cast | 2020-02-17 15:38:45 | 24.3584 N, 36.0334 W | RRS James Cook JC191 |
| 2204582 | Currents -subsurface Eulerian | 2020-02-17 15:38:45 | 24.3584 N, 36.03344 W | RRS James Cook JC191 |
| 2291189 | Water sample data | 2020-02-17 15:38:45 | 24.3584 N, 36.0334 W | RRS James Cook JC191 |
| 2025098 | CTD or STD cast | 2020-02-18 00:02:12 | 24.4889 N, 35.3154 W | RRS James Cook JC191 |
| 2204594 | Currents -subsurface Eulerian | 2020-02-18 00:02:12 | 24.48888 N, 35.31544 W | RRS James Cook JC191 |
| 2291190 | Water sample data | 2020-02-18 00:02:12 | 24.4889 N, 35.3154 W | RRS James Cook JC191 |
| 2025105 | CTD or STD cast | 2020-02-18 08:10:24 | 24.4999 N, 34.6006 W | RRS James Cook JC191 |
| 2204601 | Currents -subsurface Eulerian | 2020-02-18 08:10:24 | 24.49993 N, 34.60058 W | RRS James Cook JC191 |
| 2291208 | Water sample data | 2020-02-18 08:10:24 | 24.4999 N, 34.6006 W | RRS James Cook JC191 |
| 2025117 | CTD or STD cast | 2020-02-18 16:55:51 | 24.4998 N, 33.9021 W | RRS James Cook JC191 |
| 2204613 | Currents -subsurface Eulerian | 2020-02-18 16:55:51 | 24.49977 N, 33.90207 W | RRS James Cook JC191 |
| 2291221 | Water sample data | 2020-02-18 16:55:51 | 24.4998 N, 33.9021 W | RRS James Cook JC191 |
| 2025129 | CTD or STD cast | 2020-02-19 01:54:28 | 24.5 N, 33.2 W | RRS James Cook JC191 |
| 2204625 | Currents -subsurface Eulerian | 2020-02-19 01:54:28 | 24.5 N, 33.20005 W | RRS James Cook JC191 |
| 2291233 | Water sample data | 2020-02-19 01:54:28 | 24.5 N, 33.2 W | RRS James Cook JC191 |
| 2025130 | CTD or STD cast | 2020-02-19 10:45:51 | 24.4997 N, 32.5002 W | RRS James Cook JC191 |
| 2204637 | Currents -subsurface Eulerian | 2020-02-19 10:45:51 | 24.4997 N, 32.50024 W | RRS James Cook JC191 |
| 2291245 | Water sample data | 2020-02-19 10:45:51 | 24.4997 N, 32.5002 W | RRS James Cook JC191 |
| 2025142 | CTD or STD cast | 2020-02-19 19:36:45 | 24.4999 N, 31.8 W | RRS James Cook JC191 |
| 2204649 | Currents -subsurface Eulerian | 2020-02-19 19:36:45 | 24.49994 N, 31.80004 W | RRS James Cook JC191 |
| 2291257 | Water sample data | 2020-02-19 19:36:45 | 24.4999 N, 31.8 W | RRS James Cook JC191 |
| 2025154 | CTD or STD cast | 2020-02-20 04:28:29 | 24.5 N, 31.1022 W | RRS James Cook JC191 |
| 2204650 | Currents -subsurface Eulerian | 2020-02-20 04:28:29 | 24.5 N, 31.10224 W | RRS James Cook JC191 |
| 2291269 | Water sample data | 2020-02-20 04:28:29 | 24.5 N, 31.1022 W | RRS James Cook JC191 |
| 2025166 | CTD or STD cast | 2020-02-20 13:33:17 | 24.5006 N, 30.3999 W | RRS James Cook JC191 |
| 2204662 | Currents -subsurface Eulerian | 2020-02-20 13:33:17 | 24.50059 N, 30.3999 W | RRS James Cook JC191 |
| 2291270 | Water sample data | 2020-02-20 13:33:17 | 24.5006 N, 30.3999 W | RRS James Cook JC191 |
| 2025178 | CTD or STD cast | 2020-02-20 22:16:29 | 24.5 N, 29.7003 W | RRS James Cook JC191 |
| 2204674 | Currents -subsurface Eulerian | 2020-02-20 22:16:29 | 24.50005 N, 29.70032 W | RRS James Cook JC191 |
| 2291282 | Water sample data | 2020-02-20 22:16:29 | 24.5 N, 29.7003 W | RRS James Cook JC191 |
| 2025191 | CTD or STD cast | 2020-02-21 08:42:59 | 24.499 N, 28.7181 W | RRS James Cook JC191 |
| 2204686 | Currents -subsurface Eulerian | 2020-02-21 08:42:59 | 24.49898 N, 28.71812 W | RRS James Cook JC191 |
| 2291294 | Water sample data | 2020-02-21 08:42:59 | 24.499 N, 28.7181 W | RRS James Cook JC191 |
| 2025209 | CTD or STD cast | 2020-02-21 19:08:53 | 24.4998 N, 27.7333 W | RRS James Cook JC191 |
| 2204698 | Currents -subsurface Eulerian | 2020-02-21 19:08:53 | 24.49983 N, 27.73331 W | RRS James Cook JC191 |
| 2291301 | Water sample data | 2020-02-21 19:08:53 | 24.4998 N, 27.7333 W | RRS James Cook JC191 |
| 2025210 | CTD or STD cast | 2020-02-22 05:43:45 | 24.4996 N, 26.7505 W | RRS James Cook JC191 |
| 2204705 | Currents -subsurface Eulerian | 2020-02-22 05:43:45 | 24.49963 N, 26.75052 W | RRS James Cook JC191 |
| 2291313 | Water sample data | 2020-02-22 05:43:45 | 24.4996 N, 26.7505 W | RRS James Cook JC191 |
| 2025222 | CTD or STD cast | 2020-02-22 15:45:32 | 24.4997 N, 25.7666 W | RRS James Cook JC191 |
| 2204717 | Currents -subsurface Eulerian | 2020-02-22 15:45:32 | 24.49974 N, 25.76663 W | RRS James Cook JC191 |
| 2291325 | Water sample data | 2020-02-22 15:45:32 | 24.4997 N, 25.7666 W | RRS James Cook JC191 |
| 2025234 | CTD or STD cast | 2020-02-23 01:06:40 | 24.4999 N, 24.783 W | RRS James Cook JC191 |
| 2204729 | Currents -subsurface Eulerian | 2020-02-23 01:06:40 | 24.49996 N, 24.78297 W | RRS James Cook JC191 |
| 2291337 | Water sample data | 2020-02-23 01:06:40 | 24.4999 N, 24.783 W | RRS James Cook JC191 |
| 2025246 | CTD or STD cast | 2020-02-23 10:13:18 | 24.4997 N, 23.8 W | RRS James Cook JC191 |
| 2204730 | Currents -subsurface Eulerian | 2020-02-23 10:13:18 | 24.49973 N, 23.80002 W | RRS James Cook JC191 |
| 2291349 | Water sample data | 2020-02-23 10:13:18 | 24.4997 N, 23.8 W | RRS James Cook JC191 |
| 2025258 | CTD or STD cast | 2020-02-23 18:55:44 | 24.7335 N, 22.8159 W | RRS James Cook JC191 |
| 2204742 | Currents -subsurface Eulerian | 2020-02-23 18:55:44 | 24.7332 N, 22.81607 W | RRS James Cook JC191 |
| 2291350 | Water sample data | 2020-02-23 18:55:44 | 24.7335 N, 22.8159 W | RRS James Cook JC191 |
| 2025271 | CTD or STD cast | 2020-02-24 02:33:58 | 24.9813 N, 22.1516 W | RRS James Cook JC191 |
| 2204754 | Currents -subsurface Eulerian | 2020-02-24 02:33:58 | 24.9813 N, 22.15156 W | RRS James Cook JC191 |
| 2291362 | Water sample data | 2020-02-24 02:33:58 | 24.9813 N, 22.1516 W | RRS James Cook JC191 |
| 2025283 | CTD or STD cast | 2020-02-24 10:25:34 | 25.2161 N, 21.4847 W | RRS James Cook JC191 |
| 2204766 | Currents -subsurface Eulerian | 2020-02-24 10:25:34 | 25.21614 N, 21.48467 W | RRS James Cook JC191 |
| 2291374 | Water sample data | 2020-02-24 10:25:34 | 25.2161 N, 21.4847 W | RRS James Cook JC191 |
| 2025295 | CTD or STD cast | 2020-02-24 18:05:13 | 25.4502 N, 20.8001 W | RRS James Cook JC191 |
| 2204778 | Currents -subsurface Eulerian | 2020-02-24 18:05:13 | 25.45015 N, 20.80008 W | RRS James Cook JC191 |
| 2291386 | Water sample data | 2020-02-24 18:05:13 | 25.4502 N, 20.8001 W | RRS James Cook JC191 |
| 2025302 | CTD or STD cast | 2020-02-25 01:09:24 | 25.65 N, 20.2501 W | RRS James Cook JC191 |
| 2204791 | Currents -subsurface Eulerian | 2020-02-25 01:09:24 | 25.65002 N, 20.25008 W | RRS James Cook JC191 |
| 2291398 | Water sample data | 2020-02-25 01:09:24 | 25.65 N, 20.2501 W | RRS James Cook JC191 |
| 2025314 | CTD or STD cast | 2020-02-25 09:00:10 | 25.9166 N, 19.484 W | RRS James Cook JC191 |
| 2204809 | Currents -subsurface Eulerian | 2020-02-25 09:00:10 | 25.91656 N, 19.48406 W | RRS James Cook JC191 |
| 2291405 | Water sample data | 2020-02-25 09:00:10 | 25.9166 N, 19.484 W | RRS James Cook JC191 |
| 2025326 | CTD or STD cast | 2020-02-25 15:29:34 | 26.1334 N, 18.9167 W | RRS James Cook JC191 |
| 2204810 | Currents -subsurface Eulerian | 2020-02-25 15:29:34 | 26.13335 N, 18.9167 W | RRS James Cook JC191 |
| 2291417 | Water sample data | 2020-02-25 15:29:34 | 26.1334 N, 18.9167 W | RRS James Cook JC191 |
| 2025338 | CTD or STD cast | 2020-02-25 23:05:48 | 26.3835 N, 18.166 W | RRS James Cook JC191 |
| 2204822 | Currents -subsurface Eulerian | 2020-02-25 23:05:48 | 26.38352 N, 18.16598 W | RRS James Cook JC191 |
| 2291429 | Water sample data | 2020-02-25 23:05:48 | 26.3835 N, 18.166 W | RRS James Cook JC191 |
| 2025351 | CTD or STD cast | 2020-02-26 06:24:21 | 26.5997 N, 17.4671 W | RRS James Cook JC191 |
| 2204834 | Currents -subsurface Eulerian | 2020-02-26 06:24:21 | 26.59966 N, 17.46712 W | RRS James Cook JC191 |
| 2291430 | Water sample data | 2020-02-26 06:24:21 | 26.5997 N, 17.4671 W | RRS James Cook JC191 |
| 2025363 | CTD or STD cast | 2020-02-26 13:56:45 | 26.8185 N, 16.7849 W | RRS James Cook JC191 |
| 2204846 | Currents -subsurface Eulerian | 2020-02-26 13:56:45 | 26.81795 N, 16.78466 W | RRS James Cook JC191 |
| 2291442 | Water sample data | 2020-02-26 13:56:45 | 26.8185 N, 16.7849 W | RRS James Cook JC191 |
| 2025375 | CTD or STD cast | 2020-02-26 21:12:45 | 27.0495 N, 16.1174 W | RRS James Cook JC191 |
| 2204858 | Currents -subsurface Eulerian | 2020-02-26 21:12:45 | 27.04948 N, 16.1174 W | RRS James Cook JC191 |
| 2291454 | Water sample data | 2020-02-26 21:12:45 | 27.0495 N, 16.1174 W | RRS James Cook JC191 |
| 2025387 | CTD or STD cast | 2020-02-27 03:18:04 | 27.2329 N, 15.6002 W | RRS James Cook JC191 |
| 2204871 | Currents -subsurface Eulerian | 2020-02-27 03:18:04 | 27.23292 N, 15.60019 W | RRS James Cook JC191 |
| 2291466 | Water sample data | 2020-02-27 03:18:04 | 27.2329 N, 15.6002 W | RRS James Cook JC191 |
| 2025399 | CTD or STD cast | 2020-02-27 07:56:34 | 27.333 N, 15.2336 W | RRS James Cook JC191 |
| 2204883 | Currents -subsurface Eulerian | 2020-02-27 07:56:34 | 27.33305 N, 15.23364 W | RRS James Cook JC191 |
| 2025406 | CTD or STD cast | 2020-02-27 12:19:04 | 27.4336 N, 14.867 W | RRS James Cook JC191 |
| 2204895 | Currents -subsurface Eulerian | 2020-02-27 12:19:04 | 27.43362 N, 14.86702 W | RRS James Cook JC191 |
| 2291478 | Water sample data | 2020-02-27 12:19:04 | 27.4336 N, 14.867 W | RRS James Cook JC191 |
| 2025418 | CTD or STD cast | 2020-02-27 17:58:28 | 27.6168 N, 14.2335 W | RRS James Cook JC191 |
| 2204902 | Currents -subsurface Eulerian | 2020-02-27 17:58:28 | 27.61676 N, 14.23346 W | RRS James Cook JC191 |
| 2291491 | Water sample data | 2020-02-27 17:58:28 | 27.6168 N, 14.2335 W | RRS James Cook JC191 |
| 2025431 | CTD or STD cast | 2020-02-27 22:50:49 | 27.7833 N, 13.7667 W | RRS James Cook JC191 |
| 2204914 | Currents -subsurface Eulerian | 2020-02-27 22:50:49 | 27.78331 N, 13.76672 W | RRS James Cook JC191 |
| 2291509 | Water sample data | 2020-02-27 22:50:49 | 27.7833 N, 13.7667 W | RRS James Cook JC191 |
| 2025443 | CTD or STD cast | 2020-02-28 16:21:48 | 28.4309 N, 13.2276 W | RRS James Cook JC191 |
| 2204926 | Currents -subsurface Eulerian | 2020-02-28 16:21:48 | 28.43094 N, 13.22758 W | RRS James Cook JC191 |
| 2291510 | Water sample data | 2020-02-28 16:21:48 | 28.4309 N, 13.2276 W | RRS James Cook JC191 |
