Metadata Report for BODC Series Reference Number 1194232
Metadata Summary
Problem Reports
Data Access Policy
Narrative Documents
Project Information
Data Activity or Cruise Information
Fixed Station Information
BODC Quality Flags
SeaDataNet Quality Flags
Metadata Summary
Data Description |
|||||||||||||||||||||||||
|
|||||||||||||||||||||||||
Data Identifiers |
|||||||||||||||||||||||||
|
|||||||||||||||||||||||||
Time Co-ordinates(UT) |
|||||||||||||||||||||||||
|
|||||||||||||||||||||||||
Spatial Co-ordinates | |||||||||||||||||||||||||
|
|||||||||||||||||||||||||
Parameters |
|||||||||||||||||||||||||
|
|||||||||||||||||||||||||
|
|||||||||||||||||||||||||
Problem Reports
No Problem Report Found in the Database
Smartbuoy quality report - PAR
Originator's Quality report
| Originator's identifier | BODC identifier | Summary of originator's flags applied | |||||
|---|---|---|---|---|---|---|---|
| 2 | 4 | 9 | 11 | 12 | 14 | ||
| LB1_001_PAR_13 | 1193241 | Y | |||||
| LB1_003_PAR_13 | 1193345 | Y | |||||
| LB1_004_PAR_8 | 1193394 | Y | |||||
| LB1_005_PAR_13 | 1193450 | Y | |||||
| LB1_005_PAR_18 | 1193462 | Y | |||||
| LB1_006_PAR_20 | 1193517 | Y | |||||
| LB1_006_PAR_8 | 1193529 | Y | Y | ||||
| LB1_007_PAR_13 | 1193578 | Y | |||||
| LB1_007_PAR_18 | 1193591 | Y | |||||
| LB1_008_PAR_20 | 1193658 | Y | Y | ||||
| LB1_008_PAR_8 | 1193671 | Y | Y | ||||
| LB1_009_PAR_13 | 1193738 | Y | Y | ||||
| LB1_009_PAR_18 | 1193751 | Y | Y | ||||
| LB1_010_PAR_20 | 1193818 | Y | Y | ||||
| LB1_010_PAR_8 | 1193831 | Y | Y | ||||
| LB1_011_PAR_13 | 1193880 | Y | |||||
| LB1_011_PAR_18 | 1193892 | Y | |||||
| LB1_014_PAR_20 | 1194084 | Y | |||||
| LB1_014_PAR_8 | 1194096 | Y | |||||
| LB1_016_PAR_20 | 1194232 | Y | |||||
| LB1_016_PAR_8 | 1194244 | Y | |||||
| LB1_017_PAR_18 | 1194324 | Y | |||||
| LB1_018_PAR_20 | 1194397 | Y | |||||
| LB1_019_PAR_18 | 1194489 | Y | |||||
| LB1_020_PAR_20 | 1194557 | Y | |||||
| LB1_022_PAR_20 | 1194698 | Y | |||||
| LB1_022_PAR_8 | 1194705 | Y | |||||
| LB1_023_PAR_13 | 1194766 | Y | |||||
| LB1_023_PAR_18 | 1194778 | Y | |||||
| LB1_026_PAR_20 | 1195002 | Y | |||||
| LB1_026_PAR_8 | 1195014 | Y | |||||
| LB1_027_PAR_13 | 1195087 | Y | |||||
| LB1_027_PAR_18 | 1195099 | Y | |||||
The originator's files including flags applied have been archived by BODC and are available on request.
Originator's flag 2
Flag 2 is used by CEFAS for data that have failed their QA process because it is below the minimum for the parameter. Typically, in these series, the only cycles affected are those sampled over night. As a result the cycles flagged in this way have been assigned BODC flag L (improbable value - originator's quality control).
Originator's flag 4
Flag 4 is used by CEFAS for data that have failed their QA process because it is suspected that the sensor was biofouled. As a result the cycles flagged in this way have been assigned BODC flag L (improbable value - originator's quality control).
Originator's flag 9
Flag 9 is used by CEFAS for data that have failed their QA process because the data are deemed to be suspicious (unknown cause). As a result the cycles flagged in this way have been assigned BODC flag L (improbable value - originator's quality control).
Originator's flag 11
Flag 11 is used by CEFAS for data that have failed their QA process because the sensor platform was out of position. As a result the cycles flagged in this way have been assigned BODC flag L (improbable value - originator's quality control).
Originator's flag 12
Flag 12 is used by CEFAS for data that have failed their QA process because of a suspected sensor malfunction. As a result the cycles flagged in this way have been assigned BODC flag L (improbable value - originator's quality control).
Originator's flag 14
Flag 14 is used by CEFAS for data that have failed their QA process because of a suspected dependency failure. This is typically seen towards the end of a series where the sensor has been deployed for a significant period of time. As a result the cycles flagged in this way have been assigned BODC flag L (improbable value - originator's quality control).
Data Access Policy
Open Data
These data have no specific confidentiality restrictions for users. However, users must acknowledge data sources as it is not ethical to publish data without proper attribution. Any publication or other output resulting from usage of the data should include an acknowledgment.
If the Information Provider does not provide a specific attribution statement, or if you are using Information from several Information Providers and multiple attributions are not practical in your product or application, you may consider using the following:
"Contains public sector information licensed under the Open Government Licence v1.0."
Narrative Documents
LI-COR LI-192 Underwater Quantum Sensor
The LI-192 Underwater Quantum Sensor is used to measure photosynthetic photon flux density and is cosine corrected. The sensor is often referred to as LI-192SA or LI-192SB (the LI-192SB model was superseded by LI-192SA). One of the main differences is that the LI-192SA model includes a built-in voltage output for interfacing with NexSens iSIC and SDL data loggers.
Sensor specifications, current at January 2012, are given in the table below. More information can be found in the manufacturer's LI-192SA andLI-192SB specification sheets.
Sensor Specifications
(Specifications apply to both models unless otherwise stated)
| Absolute Calibration | ± 5 % in air traceable to NBS. |
|---|---|
| Sensitivity | Typically 3 µA per 1000 µmol s-1 m-2 for LI-192SB and 4 µA per 1000 µmol s-1 m-2 for LI-192SA in water. |
| Linearity | Maximum deviation of 1 % up to 10,000 µmol s-1 m-2. |
| Stability | < ± 2 % change over a 1 year period. |
| Response Time | 10 µs. |
| Temperature Dependence | ± 0.15 % per °C maximum. |
| Cosine Correction | Optimized for both underwater and atmospheric use. |
| Azimuth | < ± 1 % error over 360 ° at 45 ° elevation. |
| Detector | High stability silicon photovoltaic detector (blue enhanced). |
| Sensor Housing | Corrosion resistant metal with acrylic diffuser for both saltwater and freshwater applications. Waterproof to withstand 800 psi (5500 kPa) (560 meters). |
CEFAS SmartBuoy Parameter Mapping 2002-2005
Orginators parameters have been mapped to BODC parameters in the following way:
| Originators parameter | Originators units | BODC parameter | BODC units | Conversion | Comments |
|---|---|---|---|---|---|
| Conductivity | mmho cm-1 | CNDCPR01 | S m-1 | /10 | |
| Temperature | Degrees Celsius | TEMPPR01 | Degree Celsius | None | |
| Salinity | PSCLCCI1 | None | Data calibrated with field samples | ||
| Fluorescence | SP (arbitary values) | FVLTTDZX | Dimensionless | None | |
| Chlorophyll concentration | µg l-1 | CPHLPS01 | mg m-3 | None | mg m-3 = µg l-1 |
| Turbidity | FTU | TURBPR01 | NTU | None | FTU = NTU |
| Suspended load | mg l-1 | TSEDBSCL | mg l-1 | None | |
| Total oxidised nitrogen | µmol l-1 | NTRZNS01 | µmol l-1 | None | |
| PAR irradiance | µE m-2 s-1 | IRRDUV01 | µE m-2 s-1 | None | PAR sensor deployed in water column |
| Silicate | µmol l-1 | SLCAAATX | µmol l-1 | None | |
| Total oxidised nitrogen | µmol l-1 | NTRZAATX | µmol l-1 | None | |
| Suspended load | mg l-1 | TSEDGVP2 | mg l-1 | None | Measure by filtration and gravimetry and calibration against sample data |
Please note that this document includes details of all of the parameters supplied by CEFAS at the time of submission, each series may contain only a subset of these parameter.
Cefas SmartBuoy data processing
This document outlines the procedures in place at Cefas in August 2005 for processing and quality assuring SmartBuoy data.
Raw data files are processed and the data move through 4 levels, starting with raw data at level 0 through to level 3, where data are fully quality-assured and expressed in appropriate units. The application of the procedures at each level result in data deemed fit to progress to the next level.
Cefas Quality Assurance (QA) Protocols
At Level 0, raw binary data files from the loggers are transferred to the network.
Automated checks - Level 1
Level 1 involves applying automated quality assurance procedures to the data. These include the following steps:
- Burst data are loaded into memory for processing.
- Calibration data for all instruments and sensors used on the deployment are retrieved from the SmartBuoy database. These may be manufacturers' sensor calibrations or the most current laboratory calibrations. Instruments are returned to the manufacturer and re-calibrated at regular intervals.
- mV are converted to volts, where necessary.
- LiCor signals are converted from Volts to PAR irradiance in µE m-2 s-1.
- Salinity is derived from C and T using UNESCO 88 (PSS78) formula.
- Burst data maximum and minimum ranges are checked and flagged if they fail the checks.
- Burst means, result count, and result standard deviation are calculated from non-flagged burst data.
- If there are data from two PAR sensors at different depths, Kd (m-1) is calculated for burst mean data only as LN(PAR1m/PAR2m).
- Burst mean data maximum, minimum and rate of change checks are carried out and flags applied to any failures.
- Time stamped burst and burst mean data with default units are stored on SmartBuoy database.
The data are now at QA status = 1.
Manual checks - Level 2
Level 1 burst mean data are now ready for manual QA procedures in order to progress to Level 2. Deployment notes are consulted for any comments on sensor performance or malfunction and post-deployment photographs of sensors, if available, are examined.
Cefas use a data visualisation tool to examine the SmartBuoy data.
- A comparison is made between the end of one deployment with beginning of the next to identify possible drift and/or biofouling of OBS, Fluorometer, Salinity, PAR, and oxygen sensors.
- Battery voltages are checked for sudden jumps and, if present, other sensors are examined for similar jumps to determine whether there is a problem with the sensor or if the buoy was disturbed.
- Reference voltages on the FSI CT module are checked.
- The standard deviation of OBS is examined. A steady increase in standard deviation is a good indication of the onset of biofouling. It is also used as a rough indicator for fluorometers during summer, except during spring, when there are large fluctuations in chlorophyll.
- Li-Cor is examined for fouling, which could be indicated by a steady drop in daily maximum or a steady increase in standard deviation. If above-water Li-Cor data are available, they are used for comparison.
- Pressure is examined for sudden decreases, indicating when the buoy was taken out of the water.
- Roll and pitch are examined for any anomalies. It is expected that the spring/neap cycle will be present in the buoy tilt signal.
- Where possible, comparison is made between burst mean data from sensors measuring the same variable. This is in order to determine whether there is a systematic offset (drift) or sensor fault and whether biofouling is present.
- Comparison is made between burst mean sensor outputs from different variables as this can be helpful in determining the onset of biofouling. Any data that fail the checks are flagged with flags specific to the check that was failed.
Calibrations - Level 3
The combined information from Level 2 is used to determine the periods during which the data series are considered suspect. The data have now reached QA status = 2 and can progress to Level 3, where they will be fully calibrated with field-derived sample data.
- For salinity an offset is calculated as the difference between result output from logger and the result from a discrete sample collected at the same time.
- Calibration from regression analysis of field samples and logger output is applied to derive new parameters, e.g. chlorophyll calculated from fluorescence, suspended load calculated from OBS.
- Chlorophyll calibrations are determined from GF/F filtered water samples, which are extracted in acetone and measured for fluorescence using a Turner Designs Fluorometer.
- Suspended matter calibrations are determined from a known volume of water sample filtered through pre-weighed 0.4 µm Cyclopore filters. The filters are dried and reweighed to determine the weight of material per unit volume.
- Salinity is calibrated using water samples that have been analysed with a Guildline Autosal salinometer.
- Water samples from the Aqua Monitor are analysed for nutrients by colorimetric analysis of 0.4 µm Cyclopore-filtered samples.
The data have now reached QA status = 3 as time stamped, field calibrated burst mean data with parameter codes and units stored on SmartBuoy database with associated uncertainty or 95% confidence limits as appropriate. All SmartBuoy data banked at BODC have passed full Cefas QA procedures. Data that fail the Cefas QA checks are not submitted for banking.
General Data Screening carried out by BODC
BODC screen both the series header qualifying information and the parameter values in the data cycles themselves.
Header information is inspected for:
- Irregularities such as unfeasible values
- Inconsistencies between related information, for example:
- Times for instrument deployment and for start/end of data series
- Length of record and the number of data cycles/cycle interval
- Parameters expected and the parameters actually present in the data cycles
- Originator's comments on meter/mooring performance and data quality
Documents are written by BODC highlighting irregularities which cannot be resolved.
Data cycles are inspected using time or depth series plots of all parameters. Currents are additionally inspected using vector scatter plots and time series plots of North and East velocity components. These presentations undergo intrinsic and extrinsic screening to detect infeasible values within the data cycles themselves and inconsistencies as seen when comparing characteristics of adjacent data sets displaced with respect to depth, position or time. Values suspected of being of non-oceanographic origin may be tagged with the BODC flag denoting suspect value; the data values will not be altered.
The following types of irregularity, each relying on visual detection in the plot, are amongst those which may be flagged as suspect:
- Spurious data at the start or end of the record.
- Obvious spikes occurring in periods free from meteorological disturbance.
- A sequence of constant values in consecutive data cycles.
If a large percentage of the data is affected by irregularities then a Problem Report will be written rather than flagging the individual suspect values. Problem Reports are also used to highlight irregularities seen in the graphical data presentations.
Inconsistencies between the characteristics of the data set and those of its neighbours are sought and, where necessary, documented. This covers inconsistencies such as the following:
- Maximum and minimum values of parameters (spikes excluded).
- The occurrence of meteorological events.
This intrinsic and extrinsic screening of the parameter values seeks to confirm the qualifying information and the source laboratory's comments on the series. In screening and collating information, every care is taken to ensure that errors of BODC making are not introduced.
SmartBuoy data processing by BODC
The following outlines the procedures that take place at BODC for banking Cefas SmartBuoy data.
BODC receives SmartBuoy data from Cefas after all quality checks have been passed and all possible calibrations applied. The data files are submitted as separate MS Excel spreadsheets for each parameter, i.e. there are separate files for temperature and salinity from the same instrument. An exact copy of the data is archived for safekeeping upon arrival.
Once the submitted data files are safely archived, the data undergo standard reformatting and banking procedures:
- The data files are reformatted using an in-house program into a common format, which is a NetCDF subset.
- Data files arising from the same instrument are combined into a single file.
- Standard parameter codes are assigned that accurately describe the data.
- Unit conversions are applied, if necessary, so that units are standardised. Oxygen concentration supplied by the originator in units of mg l-1 is converted to µmol l-1 by multiplying by 31.25.
- The data are screened visually and any spikes or instrument malfunctions can be clearly labelled with quality control flags.
- Comprehensive documentation is prepared describing the collection, processing and quality of each data series.
- Detailed metadata and documents are loaded to the database and linked to each series so that the information is readily available to future users.
Project Information
Proudman Oceanographic Laboratory Coastal Observatory
The Coastal Observatory was established by Proudman Oceanographic Laboratory as a coastal zone real time observing and monitoring system. The main objective is to understand a coastal sea's response both to natural forcing and to the consequences of human activity. Near real-time measurements will be integrated with coupled models into a pre-operational coastal prediction system whose results will be displayed on the World Wide Web.
The Observatory is expected to grow and evolve as resources and technology allow, all the while building up long time series. A site selection pilot study was carried out in September 2001 and the Observatory became operational in August 2002.
The site is located in Liverpool Bay and is subject to typical coastal sea processes, with strong tides, occasional large storm surges and waves, freshwater input, stable and unstable stratification, high suspended sediment concentration and biogeochemical interaction. Measurements and monitoring will focus on the impacts of storms, variations in river discharge (especially the Mersey), seasonality and blooms in Liverpool Bay.
A variety of methods will be used to obtain measurements, including:
- Moored instruments for in situ time series of currents, temperature and salinity profiles, and surface waves and meteorology. It is hoped that turbidity and chlorophyll measurements will be made at another site as the Observatory progresses;
- The Cefas Smartbuoy for surface properties such as nutrients and chlorophyll, starting late 2002;
- R.V. Prince Madog to carry out spatial surveys and service moorings;
- Instrumented ferries for near surface temperature, salinity, turbidity, chlorophyll and nutrients. The first route will be Liverpool to Douglas, Isle of Man, starting late 2002;
- Drifters for surface currents and properties such as temperature and salinity, starting in 2004;
- Tide gauges, with sensors for meteorology, waves, temperature and salinity, where appropriate;
- Meteorological data from Bidston Observatory and Hilbre Island, HF radar and tide gauge sites;
- Shore-based HF radar measuring waves and surface currents out to a range of 50 km, starting in 2003;
- Satellite data, with infrared for sea surface temperature and visible for chlorophyll and suspended sediment.
The partners currently involved with the project are listed below:
- Proudman Oceanographic Laboratory
- British Oceanographic Data Centre
- UK Meteorological Office
- Centre for Environment, Fisheries and Aquaculture Science
- Environment Agency
- Liverpool University and Port Erin Marine Laboratory
- Bangor University School of Ocean Sciences
- National Oceanography Centre Southampton
- Department of Agriculture and Rural Development in Northern Ireland
A summary of Coastal Observatory cruises to date on R.V. Prince Madog is given in the table below:
| Year | No. of cruises | Work summary |
|---|---|---|
| 2001 | 1 | Site selection and pilot study. 95 CTD casts. |
| 2002 | 4 | POL moorings deployed and serviced Cefas Waverider and SmartBuoy deployed and serviced 103 CTD casts |
| 2003 | 10 | POL moorings serviced Cefas Waverider and SmartBuoy serviced 341 CTD/LISST casts |
| 2004 | 9 | POL moorings serviced Cefas Waverider and SmartBuoy serviced 347 CTD/LISST casts |
| 2005 | 9 | POL moorings serviced Cefas Waverider and SmartBuoy serviced 268 CTD/LISST casts |
| 2006 | 11 | POL moorings serviced Cefas Waverider and SmartBuoy serviced 508 CTD/LISST casts |
| 2007 | 9 | POL moorings serviced Cefas Waverider and SmartBuoy serviced 471 CTD/LISST casts |
| 2008 | 9 | POL moorings serviced Cefas Waverider and SmartBuoy serviced 260 CTD/LISST casts |
| 2009 | 7 | POL moorings serviced Cefas Waverider and SmartBuoy serviced 213 CTD/LISST casts |
| 2010 | 8 | POL moorings serviced Cefas Waverider and SmartBuoy serviced 268 CTD/LISST casts |
| 2011 | 6 | POL moorings serviced Cefas Waverider and SmartBuoy serviced 307 CTD/LISST casts to date, ongoing |
Data Activity or Cruise Information
Data Activity
| Start Date (yyyy-mm-dd) | 2004-06-09 |
| End Date (yyyy-mm-dd) | 2004-07-20 |
| Organization Undertaking Activity | Proudman Oceanographic Laboratory (now National Oceanography Centre, Liverpool) |
| Country of Organization | United Kingdom |
| Originator's Data Activity Identifier | LB1_016/POLRIG897 |
| Platform Category | moored surface buoy |
SmartBuoy deployment LB1_016/897
Deployment and recovery
This mooring was deployed in a collaboration between Cefas and the POL Liverpool Bay Coastal Observatory.
| Deployment cruise | RV Prince Madog cruise PD22/04 |
|---|---|
| Recovery cruise | RV Prince Madog cruise PD29/04 |
| Rig position | 53° 32.025' N, 3° 21.74' W |
Rig Description
The Cefas SmartBuoy carried a suite of instruments mounted just below the surface, as well as instrumentation belonging to POL at 5 and 10 metres below the surface. Further information about the instrument suite is given in the table below.
The single point mooring was composed mainly of 0.5 inch long link chain, marked by a 1.8 m diameter toroid and anchored with a half tonne clump of scrap chain.
| Instrument | Serial Number | Meter depth (m) | Record Length (days) | Comment | Owner |
|---|---|---|---|---|---|
| Seapoint Chlorophyll Fluorometer | 2211 | 1 | 26 | - | Cefas |
| Chelsea Instruments MINItracka Fluorometer | 175064 | 1 | 19 | - | Cefas |
| Falmouth Scientific OEM CT sensor | 1408 | 1 | 41 | - | Cefas |
| Seapoint Turbidity meter | 1433 | 1 | 41 | - | Cefas |
| LI-COR-192 Underwater Quantum sensor | 20 | 1 | 25 | - | Cefas |
| LI-COR-192 Underwater Quantum sensor | 8 | 2 | 26 | - | Cefas |
| EnviroTech NAS 2E in-situ nutrient analyser | 2316 | 1 | 32 | - | Cefas |
| EnviroTech WMS-1 AquaMonitor water sampler | 2384 | 1 | 39 | - | Cefas |
| EnviroTech WMS-2 AquaMonitor water sampler | 2327 | 1 | unknown | - | Cefas |
| Sea-Bird MicroCAT IM 37 | 2010 | 5 | 31 | - | POL |
| Aanderaa RCM 7 (No fin: deployed as TC logger only) | 9631 | 10 | 41 | - | POL |
- Cefas - The Centre for Environment, Fisheries and Aquaculture Science, Lowestoft (UK)
- POL - The Proudman Oceanographic Laboratory, Liverpool (UK)
Related Data Activity activities are detailed in Appendix 1
Cruise
| Cruise Name | PD22/04 |
| Departure Date | 2004-06-09 |
| Arrival Date | 2004-06-10 |
| Principal Scientist(s) | Jason Holt (Proudman Oceanographic Laboratory) |
| Ship | RV Prince Madog |
Complete Cruise Metadata Report is available here
Fixed Station Information
Fixed Station Information
| Station Name | COA |
| Category | Offshore area |
| Latitude | 53° 31.51' N |
| Longitude | 3° 23.00' W |
| Water depth below MSL | 26.0 m |
Liverpool Bay Coastal Observatory Mooring Site A (COA/Site 1/Site 9)
This station is the main mooring site for the Proudman Oceanographic Laboratory (POL) Liverpool Bay Coastal Observatory and was first occupied in 2002. It is also known both as Coastal Observatory Site 1 and Site 9. POL perform two main types of activities at this station: they deploy moorings; and in addition, they take CTD profiles during each site visit. The station lies within a box of mean water depth 22.5 m with the following coordinates:
| Box Corner | Latitude (+ve North) | Longitude (+ve East) |
|---|---|---|
| North-west corner | 53.54097 | -3.42958 |
| South-east corner | 53.50945 | -3.33714 |
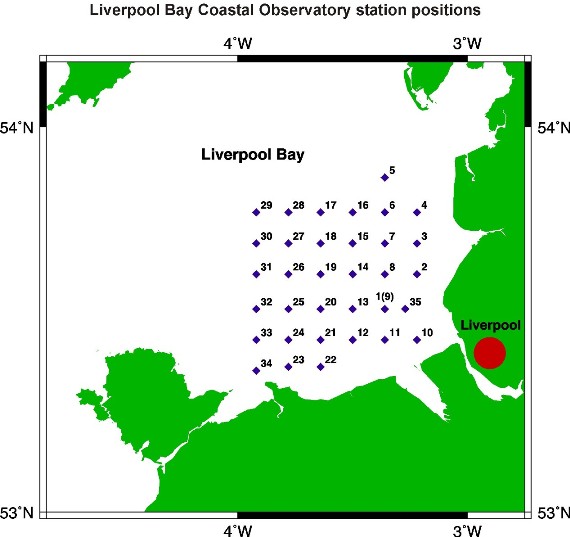
The position of this station relative to the other POL Coastal Observatory sites can be seen from the figure below.
Mooring Deployment History
2011
| Rig Type | Typical Instruments | Rig IDs | Comment |
|---|---|---|---|
| Frame | ADCP, CTD, OBS, OXY | 1117, 1121, 1125, 1127, 1130, 1132, | January - November |
| SmartBuoy | CTD x 2, AC-S, CT x 2, FL x 3, OBS x 2, PAR x 2, WMS, NAS, OXY, T x 2 | 1116, 1120, 1124 | January - November |
2010
| Rig Type | Typical Instruments | Rig IDs | Comment |
|---|---|---|---|
| Frame | ADCP, CTD, ADV, OBS | 1086, 1090, 1094, 1098, 1102, 1106, 1109 | January - December |
| SmartBuoy | CT x 2, FL x 2, OBS, PAR x 2, WMS, NAS, CTD, OXY, BD, T | 1085, 1089, 1093, 1097, 1101, 1105, 1108, 1112 | January - December |
2009
| Rig Type | Typical Instruments | Rig IDs | Comment |
|---|---|---|---|
| Frame | ADCP, CTD, ADV, OBS | 1055, 1062, 1067, 1071, 1074, 1078, 1082 | January - December |
| SmartBuoy | CT x 2, FL x 2, OBS, PAR x 2, WMS, NAS, CTD, OXY, BD, T | 1054, 1061, 1066, 1070, 1073, 1077, 1081 | January - December |
2008
| Rig Type | Typical Instruments | Rig IDs | Comment |
|---|---|---|---|
| Frame | ADCP, CTD, ADV, OBS | 1024, 1028, 1032, 1036, 1041, 1044, 1047, 1051 | January - December |
| SmartBuoy | CT x 2, FL x 2, OBS, PAR x 2, WMS, NAS, CTD, OXY, BD, T | LB1_047/1023, LB1_048/1027, LB1_049/1031, LB1_050/1035, 1040, 1043, LB1_053/1050 | January - December |
2007
| Rig Type | Typical Instruments | Rig IDs | Comment |
|---|---|---|---|
| Frame | ADCP, CTD, ADV, OBS | 990, 997, 1001, 1005, 1010, 1014, 1017, 1021 | January - December |
| SmartBuoy | CT x 2, FL x 2, OBS, PAR x 2, WMS, NAS, CTD, OXY, BD, T | LB1_039/989, LB1_040/996, LB1_041/1000, LB1_042/1004, LB1_043/1009, LB1_044/1013, LB1_045/1016, LB1_046/1020 | January - December |
2006
| Rig Type | Typical Instruments | Rig IDs | Comment |
|---|---|---|---|
| Frame | ADCP, CTD, ADV, OBS | 951, 962, 966, 970, 974, 978, 982, 986 | January - December |
| SmartBuoy | CT x 2, FL x 2, OBS, PAR x 2, WMS, NAS, CTD, OXY, BD | 958, 961, 965, 969, 973, 977, LB1_037/981, LB1_038/985 | January - December |
2005
| Rig Type | Typical Instruments | Rig IDs | Comment |
|---|---|---|---|
| Frame | ADCP, CT | 913, 914, 921, 925, 929, 933, 938, 942, 945, 949 | January - December |
| SmartBuoy | CT, FL, OBS, PAR, WMS, NAS, OXY | 912, 920, 924, 928, 932, 937, LB1_028/941, LB1_029/944, LB1_030/948 | January - December |
| Frame with telemetry buoy | ADCP | 914 | March - April |
2004
| Rig Type | Typical Instruments | Rig IDs | Comment |
|---|---|---|---|
| Frame | BPR, ADCP, TR, CT | 890, 892, 893, 896, 898, 900, 902, 904, 907, 908, 910, 911 | January - December |
| SmartBuoy | CT, FL, OBS, PAR, WMS, NAS | 889, 891, 895, 897, 899, 901, 903, 906, 909 | January - December |
| Frame with telemetry buoy | ADCP | 893, 908, 911 | April - May, October - December |
2003
| Rig Type | Instruments | Rig IDs | Comment |
|---|---|---|---|
| Frame | BPR, ADCP, TR, CT | 861, 864, 866, 869, 872, 878, 880, 883, 885, 887, 888 | January - December |
| SmartBuoy | CT, FL, OBS, PAR, WMS, NAS | 863, 865, 867, 870, 871, 877, 879, 882, 884, 886 | January - December |
2002
| Rig Type | Instruments | Rig IDs | Comment |
|---|---|---|---|
| Frame | BPR, ADCP, TR, CT | 851, 854, 856, 858 | August - December |
| Line mooring | CT x 3 | 853, 855 | August - November |
| SmartBuoy | CT, FL, OBS, PAR, WMS, NAS | 857, 860 | November - December |
2001
| Rig Type | Instruments | Rig IDs | Comment |
|---|---|---|---|
| Frame | ADCP, OBS | 838, 839, 840, 841, 843, 844, 845, 846, 848, 849 | September |
CTD Sampling History
| Year | Number of Cruises | Total Casts per year |
| 2011 | 6 | 116 including a 46 cast tidal cycle from 2011-04-18 to 2011-04-19 and a 51 cast tidal cycle station from 2011-07-27 to 2011-07-28 |
| 2010 | 8 | 71 including a 52 cast tidal cycle station from 2010-04-28 to 2010-04-29 |
| 2009 | 7 | 21 |
| 2008 | 9 | 75 including a 54 cast tidal cycle station from 2008-05-13 to 2008-05-14 |
| 2007 | 8 | 71 including a 51 cast tidal cycle station from 2007-05-15 to 2007-05-16 |
| 2006 | 9 | 72 including a 53 cast tidal cycle station from 2006-05-09 to 2006-05-10 |
| 2005 | 9 | 41 including a 22 cast tidal cycle station from 2005-04-05 to 2005-04-06 |
| 2004 | 9 | 77 including a 54 cast tidal cycle station from 2004-05-11 to 2004-05-12 |
| 2003 | 10 | 28 |
| 2002 | 4 | 13 |
The CTD instrument package for these cruises was a Sea-Bird 911plus, with beam transmissometer, fluorometer, LICOR PAR sensor, LISST-25, and oxygen sensor.
Key
AC-S = Absorption and attenuation spectrophotometer
ADCP = Acoustic Doppler Current Profiler
ADV = Acoustic Doppler Velocimeter
BD = Bacterial degradation experiment
BPR = Bottom Pressure Recorder
CT = Conductivity and temperature logger
CTD = Conductivity, temperature, depth sensor
FL = Fluorometer
NAS = in-situ nutrient analyser
OBS = Optical Backscatter Turbidity meter
OXY = Oxygen sensor
PAR = PAR sensor
T = Temperature logger
TR = Transmissometer
WMS = Automatic water sampler
Related Fixed Station activities are detailed in Appendix 2
BODC Quality Control Flags
The following single character qualifying flags may be associated with one or more individual parameters with a data cycle:
| Flag | Description |
|---|---|
| Blank | Unqualified |
| < | Below detection limit |
| > | In excess of quoted value |
| A | Taxonomic flag for affinis (aff.) |
| B | Beginning of CTD Down/Up Cast |
| C | Taxonomic flag for confer (cf.) |
| D | Thermometric depth |
| E | End of CTD Down/Up Cast |
| G | Non-taxonomic biological characteristic uncertainty |
| H | Extrapolated value |
| I | Taxonomic flag for single species (sp.) |
| K | Improbable value - unknown quality control source |
| L | Improbable value - originator's quality control |
| M | Improbable value - BODC quality control |
| N | Null value |
| O | Improbable value - user quality control |
| P | Trace/calm |
| Q | Indeterminate |
| R | Replacement value |
| S | Estimated value |
| T | Interpolated value |
| U | Uncalibrated |
| W | Control value |
| X | Excessive difference |
SeaDataNet Quality Control Flags
The following single character qualifying flags may be associated with one or more individual parameters with a data cycle:
| Flag | Description |
|---|---|
| 0 | no quality control |
| 1 | good value |
| 2 | probably good value |
| 3 | probably bad value |
| 4 | bad value |
| 5 | changed value |
| 6 | value below detection |
| 7 | value in excess |
| 8 | interpolated value |
| 9 | missing value |
| A | value phenomenon uncertain |
| B | nominal value |
| Q | value below limit of quantification |
Appendix 1: LB1_016/POLRIG897
Related series for this Data Activity are presented in the table below. Further information can be found by following the appropriate links.
If you are interested in these series, please be aware we offer a multiple file download service. Should your credentials be insufficient for automatic download, the service also offers a referral to our Enquiries Officer who may be able to negotiate access.
| Series Identifier | Data Category | Start date/time | Start position | Cruise |
|---|---|---|---|---|
| 1194207 | Fluorescence or pigments | 2004-06-09 13:00:00 | 53.5342 N, 3.3617 W | RV Prince Madog PD22/04 |
| 1194188 | Hydrography time series at depth | 2004-06-09 13:00:00 | 53.5342 N, 3.3617 W | RV Prince Madog PD22/04 |
| 1194244 | PAR radiance and irradiance | 2004-06-09 13:00:00 | 53.5342 N, 3.3617 W | RV Prince Madog PD22/04 |
| 1194219 | Transmittance/attenuance, turbidity, or SPM conc. | 2004-06-09 13:00:00 | 53.5342 N, 3.3617 W | RV Prince Madog PD22/04 |
| 664281 | Hydrography time series at depth | 2004-06-09 13:00:01 | 53.53417 N, 3.36167 W | RV Prince Madog PD22/04 |
| 664268 | Hydrography time series at depth | 2004-06-09 13:05:00 | 53.53417 N, 3.36167 W | RV Prince Madog PD22/04 |
| 1194220 | Water column chemistry | 2004-06-09 16:00:00 | 53.5342 N, 3.3617 W | RV Prince Madog PD22/04 |
| 1194256 | Water column chemistry | 2004-06-10 00:00:00 | 53.5342 N, 3.3617 W | RV Prince Madog PD22/04 |
Appendix 2: COA
Related series for this Fixed Station are presented in the table below. Further information can be found by following the appropriate links.
If you are interested in these series, please be aware we offer a multiple file download service. Should your credentials be insufficient for automatic download, the service also offers a referral to our Enquiries Officer who may be able to negotiate access.
| Series Identifier | Data Category | Start date/time | Start position | Cruise |
|---|---|---|---|---|
| 592938 | Hydrography time series at depth | 2002-08-07 12:14:00 | 53.5328 N, 3.3698 W | RV Prince Madog PD20/02 |
| 592914 | Hydrography time series at depth | 2002-08-07 12:15:00 | 53.5328 N, 3.3698 W | RV Prince Madog PD20/02 |
| 592926 | Hydrography time series at depth | 2002-08-07 12:15:00 | 53.5328 N, 3.3698 W | RV Prince Madog PD20/02 |
| 636790 | Offshore sea floor pressure series | 2002-08-07 12:49:40 | 53.5328 N, 3.3673 W | RV Prince Madog PD20/02 |
| 593235 | Currents -subsurface Eulerian | 2002-08-07 12:55:00 | 53.5328 N, 3.3673 W | RV Prince Madog PD20/02 |
| 592951 | Hydrography time series at depth | 2002-08-07 12:55:00 | 53.5328 N, 3.3673 W | RV Prince Madog PD20/02 |
| 636821 | Hydrography time series at depth | 2002-09-25 18:44:00 | 53.5332 N, 3.3668 W | RV Prince Madog PD24/02 |
| 636833 | Hydrography time series at depth | 2002-09-25 18:45:00 | 53.5332 N, 3.3668 W | RV Prince Madog PD24/02 |
| 636857 | Hydrography time series at depth | 2002-09-25 18:45:00 | 53.5332 N, 3.3668 W | RV Prince Madog PD24/02 |
| 646249 | Hydrography time series at depth | 2002-09-25 19:10:03 | 53.5332 N, 3.3632 W | RV Prince Madog PD24/02 |
| 603784 | Currents -subsurface Eulerian | 2002-09-25 19:15:00 | 53.5332 N, 3.3632 W | Not applicable |
| 636845 | Hydrography time series at depth | 2002-09-25 19:15:00 | 53.5332 N, 3.3632 W | RV Prince Madog PD24/02 |
| 636808 | Offshore sea floor pressure series | 2002-09-25 19:19:40 | 53.5332 N, 3.3632 W | RV Prince Madog PD24/02 |
| 646201 | Hydrography time series at depth | 2002-11-13 14:10:10 | 53.5328 N, 3.3627 W | RV Prince Madog PD31/02 |
| 646065 | Offshore sea floor pressure series | 2002-11-13 14:10:28 | 53.5328 N, 3.3627 W | RV Prince Madog PD31/02 |
| 646317 | Hydrography time series at depth | 2002-11-13 14:15:00 | 53.5328 N, 3.3627 W | RV Prince Madog PD31/02 |
| 646194 | Hydrography time series at depth | 2002-11-13 14:55:00 | 53.5322 N, 3.3672 W | RV Prince Madog PD31/02 |
| 1195259 | Hydrography time series at depth | 2002-11-13 15:00:00 | 53.53215 N, 3.36722 W | RV Prince Madog PD31/02 |
| 1193241 | PAR radiance and irradiance | 2002-11-13 15:00:00 | 53.53215 N, 3.36722 W | RV Prince Madog PD31/02 |
| 1193216 | Transmittance/attenuance, turbidity, or SPM conc. | 2002-11-13 15:00:00 | 53.53215 N, 3.36722 W | RV Prince Madog PD31/02 |
| 1193228 | Water column chemistry | 2002-11-13 16:00:00 | 53.53215 N, 3.36722 W | RV Prince Madog PD31/02 |
| 1193204 | Fluorescence or pigments | 2002-11-13 22:00:00 | 53.53215 N, 3.36722 W | RV Prince Madog PD31/02 |
| 1193253 | Water column chemistry | 2002-11-14 00:00:00 | 53.53215 N, 3.36722 W | RV Prince Madog PD31/02 |
| 646250 | Hydrography time series at depth | 2002-12-12 15:40:01 | 53.534 N, 3.3625 W | RV Prince Madog PD35/02 |
| 646330 | Hydrography time series at depth | 2002-12-12 15:45:00 | 53.534 N, 3.3625 W | RV Prince Madog PD35/02 |
| 646089 | Offshore sea floor pressure series | 2002-12-12 15:49:40 | 53.534 N, 3.3625 W | RV Prince Madog PD35/02 |
| 646237 | Hydrography time series at depth | 2002-12-12 16:55:00 | 53.532 N, 3.3742 W | RV Prince Madog PD35/02 |
| 1193277 | Fluorescence or pigments | 2002-12-12 17:00:00 | 53.53195 N, 3.3742 W | RV Prince Madog PD35/02 |
| 1193265 | Hydrography time series at depth | 2002-12-12 17:00:00 | 53.53195 N, 3.3742 W | RV Prince Madog PD35/02 |
| 1199875 | PAR radiance and irradiance | 2002-12-12 17:00:00 | 53.53195 N, 3.3742 W | RV Prince Madog PD35/02 |
| 1199887 | PAR radiance and irradiance | 2002-12-12 17:00:00 | 53.53195 N, 3.3742 W | RV Prince Madog PD35/02 |
| 1193289 | Transmittance/attenuance, turbidity, or SPM conc. | 2002-12-12 17:00:00 | 53.53195 N, 3.3742 W | RV Prince Madog PD35/02 |
| 1193290 | Water column chemistry | 2002-12-12 20:00:00 | 53.53195 N, 3.3742 W | RV Prince Madog PD35/02 |
| 646090 | Hydrography time series at depth | 2003-01-23 15:45:00 | 53.533 N, 3.3817 W | RV Prince Madog PD02/03 |
| 1193321 | Fluorescence or pigments | 2003-01-23 16:00:00 | 53.53323 N, 3.38145 W | RV Prince Madog PD02/03 |
| 1193308 | Hydrography time series at depth | 2003-01-23 16:00:00 | 53.53323 N, 3.38145 W | RV Prince Madog PD02/03 |
| 1193345 | PAR radiance and irradiance | 2003-01-23 16:00:00 | 53.53323 N, 3.38145 W | RV Prince Madog PD02/03 |
| 1193333 | Transmittance/attenuance, turbidity, or SPM conc. | 2003-01-23 16:00:00 | 53.53323 N, 3.38145 W | RV Prince Madog PD02/03 |
| 646004 | Offshore sea floor pressure series | 2003-01-23 16:29:40 | 53.5328 N, 3.3603 W | RV Prince Madog PD02/03 |
| 646108 | Hydrography time series at depth | 2003-01-23 16:30:00 | 53.5328 N, 3.3603 W | RV Prince Madog PD02/03 |
| 646262 | Hydrography time series at depth | 2003-01-23 16:35:00 | 53.5328 N, 3.3603 W | RV Prince Madog PD02/03 |
| 1193357 | Water column chemistry | 2003-01-24 00:00:00 | 53.53323 N, 3.38145 W | RV Prince Madog PD02/03 |
| 646121 | Hydrography time series at depth | 2003-03-06 14:24:00 | 53.5345 N, 3.3687 W | RV Prince Madog PD10/03 |
| 1193370 | Fluorescence or pigments | 2003-03-06 14:30:00 | 53.53447 N, 3.36863 W | RV Prince Madog PD10/03 |
| 1193369 | Hydrography time series at depth | 2003-03-06 14:30:00 | 53.53447 N, 3.36863 W | RV Prince Madog PD10/03 |
| 1193394 | PAR radiance and irradiance | 2003-03-06 14:30:00 | 53.53447 N, 3.36863 W | RV Prince Madog PD10/03 |
| 1193382 | Transmittance/attenuance, turbidity, or SPM conc. | 2003-03-06 14:30:00 | 53.53447 N, 3.36863 W | RV Prince Madog PD10/03 |
| 646274 | Hydrography time series at depth | 2003-03-06 14:45:00 | 53.5332 N, 3.364 W | RV Prince Madog PD10/03 |
| 646016 | Offshore sea floor pressure series | 2003-03-06 14:49:40 | 53.5332 N, 3.364 W | RV Prince Madog PD10/03 |
| 1193401 | Water column chemistry | 2003-03-07 00:00:00 | 53.53447 N, 3.36863 W | RV Prince Madog PD10/03 |
| 646286 | Hydrography time series at depth | 2003-04-16 13:45:00 | 53.5367 N, 3.3713 W | RV Prince Madog PD17/03 |
| 646028 | Offshore sea floor pressure series | 2003-04-16 13:49:40 | 53.5367 N, 3.3713 W | RV Prince Madog PD17/03 |
| 646145 | Hydrography time series at depth | 2003-04-16 13:50:00 | 53.5367 N, 3.3713 W | RV Prince Madog PD17/03 |
| 646133 | Hydrography time series at depth | 2003-04-16 15:25:00 | 53.538 N, 3.3718 W | RV Prince Madog PD17/03 |
| 1193425 | Fluorescence or pigments | 2003-04-16 15:30:00 | 53.53793 N, 3.37182 W | RV Prince Madog PD17/03 |
| 1193413 | Hydrography time series at depth | 2003-04-16 15:30:00 | 53.53793 N, 3.37182 W | RV Prince Madog PD17/03 |
| 1193450 | PAR radiance and irradiance | 2003-04-16 15:30:00 | 53.53793 N, 3.37182 W | RV Prince Madog PD17/03 |
| 1193462 | PAR radiance and irradiance | 2003-04-16 15:30:00 | 53.53793 N, 3.37182 W | RV Prince Madog PD17/03 |
| 1193437 | Transmittance/attenuance, turbidity, or SPM conc. | 2003-04-16 15:30:00 | 53.53793 N, 3.37182 W | RV Prince Madog PD17/03 |
| 1193449 | Water column chemistry | 2003-04-16 19:00:00 | 53.53793 N, 3.37182 W | RV Prince Madog PD17/03 |
| 1193474 | Water column chemistry | 2003-04-17 00:00:00 | 53.53793 N, 3.37182 W | RV Prince Madog PD17/03 |
| 1622780 | Currents -subsurface Eulerian | 2003-05-26 14:30:00 | 53.53717 N, 3.36667 W | RV Prince Madog PD23/03A |
| 646169 | Hydrography time series at depth | 2003-05-26 14:30:21 | 53.5372 N, 3.3667 W | RV Prince Madog PD23/03A |
| 646298 | Hydrography time series at depth | 2003-05-26 14:35:00 | 53.5372 N, 3.3667 W | RV Prince Madog PD23/03A |
| 646041 | Offshore sea floor pressure series | 2003-05-26 14:39:40 | 53.5372 N, 3.3667 W | RV Prince Madog PD23/03A |
| 1193498 | Fluorescence or pigments | 2003-05-26 15:00:00 | 53.5401 N, 3.37448 W | RV Prince Madog PD23/03A |
| 1193486 | Hydrography time series at depth | 2003-05-26 15:00:00 | 53.5401 N, 3.37448 W | RV Prince Madog PD23/03A |
| 1193517 | PAR radiance and irradiance | 2003-05-26 15:00:00 | 53.5401 N, 3.37448 W | RV Prince Madog PD23/03A |
| 1193529 | PAR radiance and irradiance | 2003-05-26 15:00:00 | 53.5401 N, 3.37448 W | RV Prince Madog PD23/03A |
| 1193505 | Transmittance/attenuance, turbidity, or SPM conc. | 2003-05-26 15:00:00 | 53.5401 N, 3.37448 W | RV Prince Madog PD23/03A |
| 646157 | Hydrography time series at depth | 2003-05-26 15:55:00 | 53.5402 N, 3.3745 W | RV Prince Madog PD23/03A |
| 1193542 | Fluorescence or pigments | 2003-06-26 10:30:00 | 53.53812 N, 3.3712 W | RV Prince Madog PD25/03B |
| 1193530 | Hydrography time series at depth | 2003-06-26 10:30:00 | 53.53812 N, 3.3712 W | RV Prince Madog PD25/03B |
| 1193578 | PAR radiance and irradiance | 2003-06-26 10:30:00 | 53.53812 N, 3.3712 W | RV Prince Madog PD25/03B |
| 1193591 | PAR radiance and irradiance | 2003-06-26 10:30:00 | 53.53812 N, 3.3712 W | RV Prince Madog PD25/03B |
| 1193554 | Transmittance/attenuance, turbidity, or SPM conc. | 2003-06-26 10:30:00 | 53.53812 N, 3.3712 W | RV Prince Madog PD25/03B |
| 1622792 | Currents -subsurface Eulerian | 2003-06-26 10:40:00 | 53.53617 N, 3.36567 W | RV Prince Madog PD25/03B |
| 646053 | Offshore sea floor pressure series | 2003-06-26 10:40:26 | 53.5362 N, 3.3657 W | RV Prince Madog PD25/03B |
| 646170 | Hydrography time series at depth | 2003-06-26 10:45:00 | 53.53812 N, 3.3712 W | RV Prince Madog PD25/03B |
| 646305 | Hydrography time series at depth | 2003-06-26 10:45:00 | 53.5362 N, 3.3657 W | RV Prince Madog PD25/03B |
| 646182 | Hydrography time series at depth | 2003-06-26 12:00:00 | 53.5362 N, 3.3657 W | RV Prince Madog PD25/03B |
| 1193566 | Water column chemistry | 2003-06-26 12:00:00 | 53.53812 N, 3.3712 W | RV Prince Madog PD25/03B |
| 1193609 | Water column chemistry | 2003-06-27 00:00:00 | 53.53812 N, 3.3712 W | RV Prince Madog PD25/03B |
| 1622860 | Currents -subsurface Eulerian | 2003-07-24 12:10:00 | 53.53617 N, 3.366 W | RV Prince Madog PD31/03 |
| 646225 | Hydrography time series at depth | 2003-07-24 12:10:01 | 53.5362 N, 3.366 W | RV Prince Madog PD31/03 |
| 646077 | Offshore sea floor pressure series | 2003-07-24 12:10:29 | 53.5362 N, 3.366 W | RV Prince Madog PD31/03 |
| 646329 | Hydrography time series at depth | 2003-07-24 12:15:00 | 53.5362 N, 3.366 W | RV Prince Madog PD31/03 |
| 646213 | Hydrography time series at depth | 2003-07-24 12:45:00 | 53.5385 N, 3.37 W | RV Prince Madog PD31/03 |
| 1193622 | Fluorescence or pigments | 2003-07-24 13:00:00 | 53.5385 N, 3.37 W | RV Prince Madog PD31/03 |
| 1193610 | Hydrography time series at depth | 2003-07-24 13:00:00 | 53.5385 N, 3.37 W | RV Prince Madog PD31/03 |
| 1193658 | PAR radiance and irradiance | 2003-07-24 13:00:00 | 53.5385 N, 3.37 W | RV Prince Madog PD31/03 |
| 1193671 | PAR radiance and irradiance | 2003-07-24 13:00:00 | 53.5385 N, 3.37 W | RV Prince Madog PD31/03 |
| 1193634 | Transmittance/attenuance, turbidity, or SPM conc. | 2003-07-24 13:00:00 | 53.5385 N, 3.37 W | RV Prince Madog PD31/03 |
| 1193646 | Water column chemistry | 2003-07-24 14:00:00 | 53.5385 N, 3.37 W | RV Prince Madog PD31/03 |
| 1193683 | Water column chemistry | 2003-07-25 00:00:00 | 53.5385 N, 3.37 W | RV Prince Madog PD31/03 |
| 646366 | Hydrography time series at depth | 2003-08-20 12:30:00 | 53.5358 N, 3.3625 W | RV Prince Madog PD34/03 |
| 1622884 | Currents -subsurface Eulerian | 2003-08-20 12:30:16 | 53.53583 N, 3.3625 W | RV Prince Madog PD34/03 |
| 646378 | Offshore sea floor pressure series | 2003-08-20 12:30:27 | 53.5358 N, 3.3625 W | RV Prince Madog PD34/03 |
| 646354 | Hydrography time series at depth | 2003-08-20 12:35:00 | 53.5358 N, 3.3625 W | RV Prince Madog PD34/03 |
| 646342 | Hydrography time series at depth | 2003-08-20 12:55:00 | 53.5347 N, 3.3667 W | RV Prince Madog PD34/03 |
| 1193702 | Fluorescence or pigments | 2003-08-20 13:00:00 | 53.53473 N, 3.36667 W | RV Prince Madog PD34/03 |
| 1193695 | Hydrography time series at depth | 2003-08-20 13:00:00 | 53.53473 N, 3.36667 W | RV Prince Madog PD34/03 |
| 1193738 | PAR radiance and irradiance | 2003-08-20 13:00:00 | 53.53473 N, 3.36667 W | RV Prince Madog PD34/03 |
| 1193751 | PAR radiance and irradiance | 2003-08-20 13:00:00 | 53.53473 N, 3.36667 W | RV Prince Madog PD34/03 |
| 1193714 | Transmittance/attenuance, turbidity, or SPM conc. | 2003-08-20 13:00:00 | 53.53473 N, 3.36667 W | RV Prince Madog PD34/03 |
| 1193726 | Water column chemistry | 2003-08-20 14:00:00 | 53.53473 N, 3.36667 W | RV Prince Madog PD34/03 |
| 1193763 | Water column chemistry | 2003-08-21 00:00:00 | 53.53473 N, 3.36667 W | RV Prince Madog PD34/03 |
| 1622915 | Currents -subsurface Eulerian | 2003-09-24 11:50:00 | 53.535 N, 3.3605 W | RV Prince Madog PD38/03 |
| 647007 | Hydrography time series at depth | 2003-09-24 11:50:01 | 53.535 N, 3.3605 W | RV Prince Madog PD38/03 |
| 647019 | Hydrography time series at depth | 2003-09-24 11:50:01 | 53.535 N, 3.3605 W | RV Prince Madog PD38/03 |
| 646968 | Offshore sea floor pressure series | 2003-09-24 11:50:28 | 53.535 N, 3.3605 W | RV Prince Madog PD38/03 |
| 646993 | Hydrography time series at depth | 2003-09-24 11:55:00 | 53.535 N, 3.3605 W | RV Prince Madog PD38/03 |
| 646981 | Hydrography time series at depth | 2003-09-24 12:15:00 | 53.5347 N, 3.362 W | RV Prince Madog PD38/03 |
| 1193787 | Fluorescence or pigments | 2003-09-24 12:30:00 | 53.53458 N, 3.36193 W | RV Prince Madog PD38/03 |
| 1193775 | Hydrography time series at depth | 2003-09-24 12:30:00 | 53.53458 N, 3.36193 W | RV Prince Madog PD38/03 |
| 1193818 | PAR radiance and irradiance | 2003-09-24 12:30:00 | 53.53458 N, 3.36193 W | RV Prince Madog PD38/03 |
| 1193831 | PAR radiance and irradiance | 2003-09-24 12:30:00 | 53.53458 N, 3.36193 W | RV Prince Madog PD38/03 |
| 1193799 | Transmittance/attenuance, turbidity, or SPM conc. | 2003-09-24 12:30:00 | 53.53458 N, 3.36193 W | RV Prince Madog PD38/03 |
| 1193806 | Water column chemistry | 2003-09-24 14:06:13 | 53.53458 N, 3.36193 W | RV Prince Madog PD38/03 |
| 1193843 | Water column chemistry | 2003-09-25 00:00:00 | 53.53458 N, 3.36193 W | RV Prince Madog PD38/03 |
| 1622952 | Currents -subsurface Eulerian | 2003-10-28 13:10:00 | 53.53333 N, 3.362 W | RV Prince Madog PD44/03 |
| 647044 | Hydrography time series at depth | 2003-10-28 13:10:00 | 53.5333 N, 3.362 W | Not applicable |
| 647056 | Offshore sea floor pressure series | 2003-10-28 13:10:00 | 53.5333 N, 3.362 W | Not applicable |
| 647032 | Hydrography time series at depth | 2003-10-28 13:15:00 | 53.5333 N, 3.362 W | Not applicable |
| 647020 | Hydrography time series at depth | 2003-10-28 13:25:00 | 53.5337 N, 3.3632 W | Not applicable |
| 1193867 | Fluorescence or pigments | 2003-10-28 13:30:00 | 53.53367 N, 3.36317 W | RV Prince Madog PD44/03 |
| 1193855 | Hydrography time series at depth | 2003-10-28 13:30:00 | 53.53367 N, 3.36317 W | RV Prince Madog PD44/03 |
| 1193880 | PAR radiance and irradiance | 2003-10-28 13:30:00 | 53.53367 N, 3.36317 W | RV Prince Madog PD44/03 |
| 1193892 | PAR radiance and irradiance | 2003-10-28 13:30:00 | 53.53367 N, 3.36317 W | RV Prince Madog PD44/03 |
| 1193879 | Transmittance/attenuance, turbidity, or SPM conc. | 2003-10-28 13:30:00 | 53.53367 N, 3.36317 W | RV Prince Madog PD44/03 |
| 1193911 | Water column chemistry | 2003-10-31 00:00:00 | 53.53367 N, 3.36317 W | RV Prince Madog PD44/03 |
| 1622964 | Currents -subsurface Eulerian | 2003-12-17 12:50:02 | 53.5335 N, 3.36117 W | RV Prince Madog PD48/03 |
| 647093 | Hydrography time series at depth | 2003-12-17 12:55:00 | 53.5335 N, 3.3612 W | Not applicable |
| 647112 | Hydrography time series at depth | 2003-12-17 13:00:00 | 53.5335 N, 3.3612 W | Not applicable |
| 647068 | Offshore sea floor pressure series | 2003-12-17 13:00:00 | 53.5335 N, 3.3612 W | Not applicable |
| 647081 | Hydrography time series at depth | 2003-12-17 13:15:00 | 53.5338 N, 3.3643 W | Not applicable |
| 647100 | Hydrography time series at depth | 2003-12-17 13:20:00 | 53.5338 N, 3.3643 W | Not applicable |
| 1193935 | Fluorescence or pigments | 2003-12-17 13:30:00 | 53.53378 N, 3.36428 W | RV Prince Madog PD48/03 |
| 1193923 | Hydrography time series at depth | 2003-12-17 13:30:00 | 53.53378 N, 3.36428 W | RV Prince Madog PD48/03 |
| 1193947 | PAR radiance and irradiance | 2003-12-17 13:30:00 | 53.53378 N, 3.36428 W | RV Prince Madog PD48/03 |
| 1193959 | PAR radiance and irradiance | 2003-12-17 13:30:00 | 53.53378 N, 3.36428 W | RV Prince Madog PD48/03 |
| 1622675 | Currents -subsurface Eulerian | 2004-02-24 14:40:00 | 53.53167 N, 3.3615 W | RV Prince Madog PD06/04 |
| 662667 | Offshore sea floor pressure series | 2004-02-24 14:40:26 | 53.53167 N, 3.3615 W | RV Prince Madog PD06/04 |
| 662692 | Hydrography time series at depth | 2004-02-24 14:45:00 | 53.53167 N, 3.3615 W | RV Prince Madog PD06/04 |
| 662679 | Hydrography time series at depth | 2004-02-24 14:50:00 | 53.53167 N, 3.3615 W | RV Prince Madog PD06/04 |
| 662680 | Hydrography time series at depth | 2004-02-24 15:15:00 | 53.5335 N, 3.35983 W | RV Prince Madog PD06/04 |
| 1193972 | Fluorescence or pigments | 2004-02-24 16:00:00 | 53.53468 N, 3.36012 W | RV Prince Madog PD06/04 |
| 1193960 | Hydrography time series at depth | 2004-02-24 16:00:00 | 53.53468 N, 3.36012 W | RV Prince Madog PD06/04 |
| 1194011 | PAR radiance and irradiance | 2004-02-24 16:00:00 | 53.53468 N, 3.36012 W | RV Prince Madog PD06/04 |
| 1194023 | PAR radiance and irradiance | 2004-02-24 16:00:00 | 53.53468 N, 3.36012 W | RV Prince Madog PD06/04 |
| 1193984 | Transmittance/attenuance, turbidity, or SPM conc. | 2004-02-24 16:00:00 | 53.53468 N, 3.36012 W | RV Prince Madog PD06/04 |
| 1193996 | Water column chemistry | 2004-02-24 16:00:00 | 53.53468 N, 3.36012 W | RV Prince Madog PD06/04 |
| 1194035 | Water column chemistry | 2004-02-25 00:00:00 | 53.53468 N, 3.36012 W | RV Prince Madog PD06/04 |
| 1622687 | Currents -subsurface Eulerian | 2004-04-01 09:50:00 | 53.53217 N, 3.36383 W | RV Prince Madog PD11/04B |
| 662759 | Hydrography time series at depth | 2004-04-01 09:50:01 | 53.53217 N, 3.36383 W | RV Prince Madog PD11/04B |
| 662711 | Offshore sea floor pressure series | 2004-04-01 09:50:29 | 53.53217 N, 3.36383 W | RV Prince Madog PD11/04B |
| 662735 | Hydrography time series at depth | 2004-04-01 09:55:00 | 53.53217 N, 3.36383 W | RV Prince Madog PD11/04B |
| 662747 | Hydrography time series at depth | 2004-04-01 10:20:01 | 53.533 N, 3.3685 W | RV Prince Madog PD11/04B |
| 662723 | Hydrography time series at depth | 2004-04-01 10:25:00 | 53.533 N, 3.3685 W | RV Prince Madog PD11/04B |
| 1194059 | Fluorescence or pigments | 2004-04-01 10:30:00 | 53.533 N, 3.3685 W | RV Prince Madog PD11/04B |
| 1194047 | Hydrography time series at depth | 2004-04-01 10:30:00 | 53.533 N, 3.3685 W | RV Prince Madog PD11/04B |
| 1194084 | PAR radiance and irradiance | 2004-04-01 10:30:00 | 53.533 N, 3.3685 W | RV Prince Madog PD11/04B |
| 1194096 | PAR radiance and irradiance | 2004-04-01 10:30:00 | 53.533 N, 3.3685 W | RV Prince Madog PD11/04B |
| 1194060 | Transmittance/attenuance, turbidity, or SPM conc. | 2004-04-01 10:30:00 | 53.533 N, 3.3685 W | RV Prince Madog PD11/04B |
| 1194072 | Water column chemistry | 2004-04-01 10:52:17 | 53.533 N, 3.3685 W | RV Prince Madog PD11/04B |
| 1194103 | Water column chemistry | 2004-04-03 00:00:00 | 53.533 N, 3.3685 W | RV Prince Madog PD11/04B |
| 1622718 | Currents -subsurface Eulerian | 2004-05-11 12:10:00 | 53.533 N, 3.36167 W | RV Prince Madog PD18/04 |
| 664188 | Hydrography time series at depth | 2004-05-11 12:10:01 | 53.533 N, 3.36167 W | RV Prince Madog PD18/04 |
| 664152 | Offshore sea floor pressure series | 2004-05-11 12:10:27 | 53.533 N, 3.36167 W | RV Prince Madog PD18/04 |
| 664207 | Hydrography time series at depth | 2004-05-11 12:15:00 | 53.533 N, 3.36167 W | RV Prince Madog PD18/04 |
| 664176 | Hydrography time series at depth | 2004-05-11 12:50:01 | 53.53167 N, 3.36233 W | RV Prince Madog PD18/04 |
| 664164 | Hydrography time series at depth | 2004-05-11 12:55:00 | 53.53167 N, 3.36233 W | RV Prince Madog PD18/04 |
| 1194127 | Fluorescence or pigments | 2004-05-11 13:00:00 | 53.5317 N, 3.3623 W | RV Prince Madog PD18/04 |
| 1194115 | Hydrography time series at depth | 2004-05-11 13:00:00 | 53.5317 N, 3.3623 W | RV Prince Madog PD18/04 |
| 1194152 | PAR radiance and irradiance | 2004-05-11 13:00:00 | 53.5317 N, 3.3623 W | RV Prince Madog PD18/04 |
| 1194164 | PAR radiance and irradiance | 2004-05-11 13:00:00 | 53.5317 N, 3.3623 W | RV Prince Madog PD18/04 |
| 1194139 | Transmittance/attenuance, turbidity, or SPM conc. | 2004-05-11 13:00:00 | 53.5317 N, 3.3623 W | RV Prince Madog PD18/04 |
| 1194140 | Water column chemistry | 2004-05-11 14:00:00 | 53.5317 N, 3.3623 W | RV Prince Madog PD18/04 |
| 1194176 | Water column chemistry | 2004-05-13 00:00:00 | 53.5317 N, 3.3623 W | RV Prince Madog PD18/04 |
| 1622779 | Currents -subsurface Eulerian | 2004-06-09 12:40:03 | 53.53467 N, 3.35933 W | RV Prince Madog PD22/04 |
| 664300 | Offshore sea floor pressure series | 2004-06-09 12:40:29 | 53.53467 N, 3.35933 W | RV Prince Madog PD22/04 |
| 664324 | Hydrography time series at depth | 2004-06-09 12:45:00 | 53.53467 N, 3.35933 W | RV Prince Madog PD22/04 |
| 664293 | Hydrography time series at depth | 2004-06-09 12:50:00 | 53.53467 N, 3.35933 W | RV Prince Madog PD22/04 |
| 1194207 | Fluorescence or pigments | 2004-06-09 13:00:00 | 53.5342 N, 3.3617 W | RV Prince Madog PD22/04 |
| 1194188 | Hydrography time series at depth | 2004-06-09 13:00:00 | 53.5342 N, 3.3617 W | RV Prince Madog PD22/04 |
| 1194244 | PAR radiance and irradiance | 2004-06-09 13:00:00 | 53.5342 N, 3.3617 W | RV Prince Madog PD22/04 |
| 1194219 | Transmittance/attenuance, turbidity, or SPM conc. | 2004-06-09 13:00:00 | 53.5342 N, 3.3617 W | RV Prince Madog PD22/04 |
| 664281 | Hydrography time series at depth | 2004-06-09 13:00:01 | 53.53417 N, 3.36167 W | RV Prince Madog PD22/04 |
| 664268 | Hydrography time series at depth | 2004-06-09 13:05:00 | 53.53417 N, 3.36167 W | RV Prince Madog PD22/04 |
| 1194220 | Water column chemistry | 2004-06-09 16:00:00 | 53.5342 N, 3.3617 W | RV Prince Madog PD22/04 |
| 1194256 | Water column chemistry | 2004-06-10 00:00:00 | 53.5342 N, 3.3617 W | RV Prince Madog PD22/04 |
| 1622835 | Currents -subsurface Eulerian | 2004-07-20 12:20:00 | 53.53483 N, 3.357 W | RV Prince Madog PD29/04 |
| 664336 | Hydrography time series at depth | 2004-07-20 12:25:00 | 53.53483 N, 3.357 W | RV Prince Madog PD29/04 |
| 664312 | Offshore sea floor pressure series | 2004-07-20 12:29:40 | 53.53483 N, 3.357 W | RV Prince Madog PD29/04 |
| 1194281 | Fluorescence or pigments | 2004-07-20 12:30:00 | 53.5333 N, 3.3592 W | RV Prince Madog PD29/04 |
| 1194268 | Hydrography time series at depth | 2004-07-20 12:30:00 | 53.5333 N, 3.3592 W | RV Prince Madog PD29/04 |
| 1194312 | PAR radiance and irradiance | 2004-07-20 12:30:00 | 53.5333 N, 3.3592 W | RV Prince Madog PD29/04 |
| 1194324 | PAR radiance and irradiance | 2004-07-20 12:30:00 | 53.5333 N, 3.3592 W | RV Prince Madog PD29/04 |
| 1194293 | Transmittance/attenuance, turbidity, or SPM conc. | 2004-07-20 12:30:00 | 53.5333 N, 3.3592 W | RV Prince Madog PD29/04 |
| 664256 | Hydrography time series at depth | 2004-07-20 12:30:01 | 53.53333 N, 3.35917 W | RV Prince Madog PD29/04 |
| 664244 | Hydrography time series at depth | 2004-07-20 12:35:00 | 53.53333 N, 3.35917 W | RV Prince Madog PD29/04 |
| 1194300 | Water column chemistry | 2004-07-20 16:00:00 | 53.5333 N, 3.3592 W | RV Prince Madog PD29/04 |
| 1194336 | Water column chemistry | 2004-07-22 00:00:00 | 53.5333 N, 3.3592 W | RV Prince Madog PD29/04 |
| 1622872 | Currents -subsurface Eulerian | 2004-08-11 12:40:00 | 53.53317 N, 3.36367 W | RV Prince Madog PD32/04 |
| 664232 | Hydrography time series at depth | 2004-08-11 12:40:01 | 53.53317 N, 3.36367 W | RV Prince Madog PD32/04 |
| 664348 | Hydrography time series at depth | 2004-08-11 12:45:00 | 53.53317 N, 3.36367 W | RV Prince Madog PD32/04 |
| 664220 | Hydrography time series at depth | 2004-08-11 12:50:01 | 53.53517 N, 3.36933 W | RV Prince Madog PD32/04 |
| 664219 | Hydrography time series at depth | 2004-08-11 12:55:00 | 53.53517 N, 3.36933 W | RV Prince Madog PD32/04 |
| 1194361 | Fluorescence or pigments | 2004-08-11 13:00:00 | 53.5352 N, 3.3693 W | RV Prince Madog PD32/04 |
| 1194348 | Hydrography time series at depth | 2004-08-11 13:00:00 | 53.5352 N, 3.3693 W | RV Prince Madog PD32/04 |
| 1194397 | PAR radiance and irradiance | 2004-08-11 13:00:00 | 53.5352 N, 3.3693 W | RV Prince Madog PD32/04 |
| 1194404 | PAR radiance and irradiance | 2004-08-11 13:00:00 | 53.5352 N, 3.3693 W | RV Prince Madog PD32/04 |
| 1194373 | Transmittance/attenuance, turbidity, or SPM conc. | 2004-08-11 13:00:00 | 53.5352 N, 3.3693 W | RV Prince Madog PD32/04 |
| 1194385 | Water column chemistry | 2004-08-11 16:00:00 | 53.5352 N, 3.3693 W | RV Prince Madog PD32/04 |
| 1194416 | Water column chemistry | 2004-08-12 00:00:00 | 53.5352 N, 3.3693 W | RV Prince Madog PD32/04 |
| 1622927 | Currents -subsurface Eulerian | 2004-09-08 12:20:01 | 53.533 N, 3.3645 W | RV Prince Madog PD38/04 |
| 695950 | Hydrography time series at depth | 2004-09-08 12:20:01 | 53.533 N, 3.3645 W | RV Prince Madog PD38/04 |
| 695974 | Hydrography time series at depth | 2004-09-08 12:20:03 | 53.533 N, 3.3645 W | RV Prince Madog PD38/04 |
| 695937 | Hydrography time series at depth | 2004-09-08 12:45:00 | 53.5355 N, 3.36717 W | RV Prince Madog PD38/04 |
| 695949 | Hydrography time series at depth | 2004-09-08 12:50:01 | 53.5355 N, 3.36717 W | RV Prince Madog PD38/04 |
| 1194441 | Fluorescence or pigments | 2004-09-08 13:00:00 | 53.5355 N, 3.3672 W | RV Prince Madog PD38/04 |
| 1194428 | Hydrography time series at depth | 2004-09-08 13:00:00 | 53.5355 N, 3.3672 W | RV Prince Madog PD38/04 |
| 1194477 | PAR radiance and irradiance | 2004-09-08 13:00:00 | 53.5355 N, 3.3672 W | RV Prince Madog PD38/04 |
| 1194489 | PAR radiance and irradiance | 2004-09-08 13:00:00 | 53.5355 N, 3.3672 W | RV Prince Madog PD38/04 |
| 1194453 | Transmittance/attenuance, turbidity, or SPM conc. | 2004-09-08 13:00:00 | 53.5355 N, 3.3672 W | RV Prince Madog PD38/04 |
| 1194465 | Water column chemistry | 2004-09-08 14:00:00 | 53.5355 N, 3.3672 W | RV Prince Madog PD38/04 |
| 1194490 | Water column chemistry | 2004-09-09 00:00:00 | 53.5355 N, 3.3672 W | RV Prince Madog PD38/04 |
| 1622976 | Currents -subsurface Eulerian | 2004-10-29 12:00:11 | 53.5325 N, 3.3665 W | RV Prince Madog PD48/04 |
| 1194521 | Fluorescence or pigments | 2004-10-29 12:30:00 | 53.5332 N, 3.3692 W | RV Prince Madog PD48/04 |
| 1194508 | Hydrography time series at depth | 2004-10-29 12:30:00 | 53.5332 N, 3.3692 W | RV Prince Madog PD48/04 |
| 1194557 | PAR radiance and irradiance | 2004-10-29 12:30:00 | 53.5332 N, 3.3692 W | RV Prince Madog PD48/04 |
| 1194569 | PAR radiance and irradiance | 2004-10-29 12:30:00 | 53.5332 N, 3.3692 W | RV Prince Madog PD48/04 |
| 1194533 | Transmittance/attenuance, turbidity, or SPM conc. | 2004-10-29 12:30:00 | 53.5332 N, 3.3692 W | RV Prince Madog PD48/04 |
| 1194545 | Water column chemistry | 2004-10-29 15:00:00 | 53.5332 N, 3.3692 W | RV Prince Madog PD48/04 |
| 1194570 | Water column chemistry | 2004-10-30 00:00:00 | 53.5332 N, 3.3692 W | RV Prince Madog PD48/04 |
| 1194594 | Fluorescence or pigments | 2004-12-15 14:00:00 | 53.5308 N, 3.3705 W | RV Prince Madog PD52/04 |
| 1194582 | Hydrography time series at depth | 2004-12-15 14:00:00 | 53.5308 N, 3.3705 W | RV Prince Madog PD52/04 |
| 1194625 | PAR radiance and irradiance | 2004-12-15 14:00:00 | 53.5308 N, 3.3705 W | RV Prince Madog PD52/04 |
| 1194637 | PAR radiance and irradiance | 2004-12-15 14:00:00 | 53.5308 N, 3.3705 W | RV Prince Madog PD52/04 |
| 1194601 | Transmittance/attenuance, turbidity, or SPM conc. | 2004-12-15 14:00:00 | 53.5308 N, 3.3705 W | RV Prince Madog PD52/04 |
| 1194613 | Water column chemistry | 2004-12-15 15:00:00 | 53.5308 N, 3.3705 W | RV Prince Madog PD52/04 |
| 1623003 | Currents -subsurface Eulerian | 2004-12-15 15:40:00 | 53.53183 N, 3.37783 W | RV Prince Madog PD52/04 |
| 1194649 | Water column chemistry | 2004-12-17 00:00:00 | 53.5308 N, 3.3705 W | RV Prince Madog PD52/04 |
| 701938 | Hydrography time series at depth | 2005-01-31 15:30:12 | 53.53317 N, 3.36967 W | RV Prince Madog PD02/05 |
| 701650 | Hydrography time series at depth | 2005-02-01 10:46:00 | 53.53433 N, 3.3635 W | RV Prince Madog PD02/05 |
| 701662 | Hydrography time series at depth | 2005-02-01 10:50:01 | 53.53433 N, 3.3635 W | RV Prince Madog PD02/05 |
| 1194662 | Fluorescence or pigments | 2005-02-01 11:00:00 | 53.5343 N, 3.3635 W | RV Prince Madog PD02/05 |
| 1194650 | Hydrography time series at depth | 2005-02-01 11:00:00 | 53.5343 N, 3.3635 W | RV Prince Madog PD02/05 |
| 1194698 | PAR radiance and irradiance | 2005-02-01 11:00:00 | 53.5343 N, 3.3635 W | RV Prince Madog PD02/05 |
| 1194705 | PAR radiance and irradiance | 2005-02-01 11:00:00 | 53.5343 N, 3.3635 W | RV Prince Madog PD02/05 |
| 1194674 | Transmittance/attenuance, turbidity, or SPM conc. | 2005-02-01 11:00:00 | 53.5343 N, 3.3635 W | RV Prince Madog PD02/05 |
| 1194686 | Water column chemistry | 2005-02-01 14:00:00 | 53.5343 N, 3.3635 W | RV Prince Madog PD02/05 |
| 1194717 | Water column chemistry | 2005-02-03 00:00:00 | 53.5343 N, 3.3635 W | RV Prince Madog PD02/05 |
| 1622699 | Currents -subsurface Eulerian | 2005-04-05 14:10:00 | 53.53383 N, 3.3595 W | RV Prince Madog PD11/05 |
| 701926 | Hydrography time series at depth | 2005-04-05 14:10:03 | 53.53383 N, 3.3595 W | RV Prince Madog PD11/05 |
| 701846 | Hydrography time series at depth | 2005-04-10 12:20:01 | 53.53317 N, 3.36383 W | RV Prince Madog PD11/05 |
| 701674 | Hydrography time series at depth | 2005-04-10 12:29:00 | 53.53317 N, 3.36383 W | RV Prince Madog PD12/05 |
| 1194730 | Fluorescence or pigments | 2005-04-10 12:30:00 | 53.5332 N, 3.3638 W | RV Prince Madog PD11/05 |
| 1194729 | Hydrography time series at depth | 2005-04-10 12:30:00 | 53.5332 N, 3.3638 W | RV Prince Madog PD11/05 |
| 1194766 | PAR radiance and irradiance | 2005-04-10 12:30:00 | 53.5332 N, 3.3638 W | RV Prince Madog PD11/05 |
| 1194778 | PAR radiance and irradiance | 2005-04-10 12:30:00 | 53.5332 N, 3.3638 W | RV Prince Madog PD11/05 |
| 1194742 | Transmittance/attenuance, turbidity, or SPM conc. | 2005-04-10 12:30:00 | 53.5332 N, 3.3638 W | RV Prince Madog PD11/05 |
| 1194754 | Water column chemistry | 2005-04-10 14:00:00 | 53.5332 N, 3.3638 W | RV Prince Madog PD11/05 |
| 1194791 | Water column chemistry | 2005-04-22 00:00:00 | 53.5332 N, 3.3638 W | RV Prince Madog PD11/05 |
| 1622743 | Currents -subsurface Eulerian | 2005-05-11 12:50:00 | 53.53383 N, 3.35917 W | RV Prince Madog PD18/05 |
| 701895 | Hydrography time series at depth | 2005-05-11 12:50:03 | 53.53383 N, 3.35917 W | RV Prince Madog PD18/05 |
| 701754 | Hydrography time series at depth | 2005-05-11 13:25:00 | 53.53317 N, 3.36383 W | RV Prince Madog PD18/05 |
| 1194822 | Fluorescence or pigments | 2005-05-11 13:30:00 | 53.5332 N, 3.3638 W | RV Prince Madog PD18/05 |
| 701705 | Hydrography time series at depth | 2005-05-11 13:30:00 | 53.53317 N, 3.36383 W | RV Prince Madog PD18/05 |
| 1194809 | Hydrography time series at depth | 2005-05-11 13:30:00 | 53.5332 N, 3.3638 W | RV Prince Madog PD18/05 |
| 1194858 | PAR radiance and irradiance | 2005-05-11 13:30:00 | 53.5332 N, 3.3638 W | RV Prince Madog PD18/05 |
| 1194871 | PAR radiance and irradiance | 2005-05-11 13:30:00 | 53.5332 N, 3.3638 W | RV Prince Madog PD18/05 |
| 1194834 | Transmittance/attenuance, turbidity, or SPM conc. | 2005-05-11 13:30:00 | 53.5332 N, 3.3638 W | RV Prince Madog PD18/05 |
| 1194846 | Water column chemistry | 2005-05-11 16:00:00 | 53.5332 N, 3.3638 W | RV Prince Madog PD18/05 |
| 1194883 | Water column chemistry | 2005-05-12 00:00:00 | 53.5332 N, 3.3638 W | RV Prince Madog PD18/05 |
| 1622767 | Currents -subsurface Eulerian | 2005-06-15 13:10:00 | 53.53367 N, 3.35717 W | RV Prince Madog PD21/05 |
| 701902 | Hydrography time series at depth | 2005-06-15 13:10:03 | 53.53367 N, 3.35717 W | RV Prince Madog PD21/05 |
| 701742 | Hydrography time series at depth | 2005-06-15 13:50:01 | 53.53417 N, 3.36067 W | RV Prince Madog PD21/05 |
| 701730 | Hydrography time series at depth | 2005-06-15 13:55:00 | 53.53417 N, 3.36067 W | RV Prince Madog PD21/05 |
| 1194902 | Fluorescence or pigments | 2005-06-15 14:00:00 | 53.5342 N, 3.3607 W | RV Prince Madog PD21/05 |
| 1194895 | Hydrography time series at depth | 2005-06-15 14:00:00 | 53.5342 N, 3.3607 W | RV Prince Madog PD21/05 |
| 1194938 | PAR radiance and irradiance | 2005-06-15 14:00:00 | 53.5342 N, 3.3607 W | RV Prince Madog PD21/05 |
| 1194951 | PAR radiance and irradiance | 2005-06-15 14:00:00 | 53.5342 N, 3.3607 W | RV Prince Madog PD21/05 |
| 1194914 | Transmittance/attenuance, turbidity, or SPM conc. | 2005-06-15 14:00:00 | 53.5342 N, 3.3607 W | RV Prince Madog PD21/05 |
| 1194926 | Water column chemistry | 2005-06-15 16:00:00 | 53.5342 N, 3.3607 W | RV Prince Madog PD21/05 |
| 1622811 | Currents -subsurface Eulerian | 2005-07-13 11:00:00 | 53.5335 N, 3.35717 W | RV Prince Madog PD25/05 |
| 698787 | Hydrography time series at depth | 2005-07-13 11:00:03 | 53.5335 N, 3.35717 W | RV Prince Madog PD25/05 |
| 698892 | Hydrography time series at depth | 2005-07-13 12:15:00 | 53.53467 N, 3.36533 W | RV Prince Madog PD25/05 |
| 698879 | Hydrography time series at depth | 2005-07-13 12:20:03 | 53.53467 N, 3.36533 W | RV Prince Madog PD25/05 |
| 1194975 | Fluorescence or pigments | 2005-07-13 12:30:00 | 53.5347 N, 3.3653 W | RV Prince Madog PD25/05 |
| 1194963 | Hydrography time series at depth | 2005-07-13 12:30:00 | 53.5347 N, 3.3653 W | RV Prince Madog PD25/05 |
| 1195002 | PAR radiance and irradiance | 2005-07-13 12:30:00 | 53.5347 N, 3.3653 W | RV Prince Madog PD25/05 |
| 1195014 | PAR radiance and irradiance | 2005-07-13 12:30:00 | 53.5347 N, 3.3653 W | RV Prince Madog PD25/05 |
| 1194987 | Transmittance/attenuance, turbidity, or SPM conc. | 2005-07-13 12:30:00 | 53.5347 N, 3.3653 W | RV Prince Madog PD25/05 |
| 1194999 | Water column chemistry | 2005-07-13 15:00:00 | 53.5347 N, 3.3653 W | RV Prince Madog PD25/05 |
| 1195026 | Water column chemistry | 2005-07-14 00:00:00 | 53.5347 N, 3.3653 W | RV Prince Madog PD25/05 |
| 1622847 | Currents -subsurface Eulerian | 2005-08-17 12:40:00 | 53.53367 N, 3.35733 W | RV Prince Madog PD30/05 |
| 698799 | Hydrography time series at depth | 2005-08-17 12:40:03 | 53.53367 N, 3.35733 W | RV Prince Madog PD30/05 |
| 1195051 | Fluorescence or pigments | 2005-08-17 13:00:00 | 53.5337 N, 3.3615 W | RV Prince Madog PD30/05 |
| 1195038 | Hydrography time series at depth | 2005-08-17 13:00:00 | 53.5337 N, 3.3615 W | RV Prince Madog PD30/05 |
| 1195087 | PAR radiance and irradiance | 2005-08-17 13:00:00 | 53.5337 N, 3.3615 W | RV Prince Madog PD30/05 |
| 1195099 | PAR radiance and irradiance | 2005-08-17 13:00:00 | 53.5337 N, 3.3615 W | RV Prince Madog PD30/05 |
| 1195063 | Transmittance/attenuance, turbidity, or SPM conc. | 2005-08-17 13:00:00 | 53.5337 N, 3.3615 W | RV Prince Madog PD30/05 |
| 698972 | Hydrography time series at depth | 2005-08-17 13:00:01 | 53.53367 N, 3.3615 W | RV Prince Madog PD30/05 |
| 1195075 | Water column chemistry | 2005-08-17 14:00:00 | 53.5337 N, 3.3615 W | RV Prince Madog PD30/05 |
| 1195106 | Water column chemistry | 2005-08-18 00:00:00 | 53.5337 N, 3.3615 W | RV Prince Madog PD30/05 |
| 698843 | Hydrography time series at depth | 2005-09-15 12:40:03 | 53.53333 N, 3.366 W | RV Prince Madog PD34/05 |
| 680084 | Fluorescence or pigments | 2005-09-15 13:00:00 | 53.5333 N, 3.366 W | RV Prince Madog PD34/05 |
| 680115 | PAR radiance and irradiance | 2005-09-15 13:00:00 | 53.5333 N, 3.366 W | RV Prince Madog PD34/05 |
| 680140 | PAR radiance and irradiance | 2005-09-15 13:00:00 | 53.5333 N, 3.366 W | RV Prince Madog PD34/05 |
| 680059 | Surface temp/sal | 2005-09-15 13:00:00 | 53.5333 N, 3.366 W | RV Prince Madog PD34/05 |
| 680023 | Transmittance/attenuance, turbidity, or SPM conc. | 2005-09-15 13:00:00 | 53.5333 N, 3.366 W | RV Prince Madog PD34/05 |
| 698831 | Hydrography time series at depth | 2005-09-15 14:50:03 | 53.53383 N, 3.359 W | RV Prince Madog PD34/05 |
| 1622896 | Currents -subsurface Eulerian | 2005-09-15 14:50:27 | 53.53383 N, 3.359 W | RV Prince Madog PD34/05 |
| 680219 | Water column chemistry | 2005-09-16 00:00:00 | 53.5333 N, 3.366 W | RV Prince Madog PD34/05 |
| 680176 | Water column chemistry | 2005-09-16 00:07:00 | 53.5333 N, 3.366 W | RV Prince Madog PD34/05 |
| 1622939 | Currents -subsurface Eulerian | 2005-10-26 13:50:00 | 53.53367 N, 3.35733 W | RV Prince Madog PD41/05 |
| 696326 | Hydrography time series at depth | 2005-10-26 13:50:03 | 53.53367 N, 3.35733 W | RV Prince Madog PD41/05 |
| 696271 | Hydrography time series at depth | 2005-10-26 14:20:01 | 53.53333 N, 3.362 W | RV Prince Madog PD41/05 |
| 680096 | Fluorescence or pigments | 2005-10-26 14:30:00 | 53.5333 N, 3.362 W | RV Prince Madog PD41/05 |
| 680127 | PAR radiance and irradiance | 2005-10-26 14:30:00 | 53.5333 N, 3.362 W | RV Prince Madog PD41/05 |
| 680152 | PAR radiance and irradiance | 2005-10-26 14:30:00 | 53.5333 N, 3.362 W | RV Prince Madog PD41/05 |
| 680060 | Surface temp/sal | 2005-10-26 14:30:00 | 53.5333 N, 3.362 W | RV Prince Madog PD41/05 |
| 680035 | Transmittance/attenuance, turbidity, or SPM conc. | 2005-10-26 14:30:00 | 53.5333 N, 3.362 W | RV Prince Madog PD41/05 |
| 680244 | Water column chemistry | 2005-10-26 14:30:00 | 53.5333 N, 3.362 W | RV Prince Madog PD41/05 |
| 680188 | Water column chemistry | 2005-10-26 17:08:00 | 53.5333 N, 3.362 W | RV Prince Madog PD41/05 |
| 680220 | Water column chemistry | 2005-10-27 00:00:00 | 53.5333 N, 3.362 W | RV Prince Madog PD41/05 |
| 696338 | Hydrography time series at depth | 2005-12-14 13:00:03 | 53.53417 N, 3.35917 W | RV Prince Madog PD48/05 |
| 696283 | Hydrography time series at depth | 2005-12-14 13:20:00 | 53.53467 N, 3.36033 W | RV Prince Madog PD48/05 |
| 680103 | Fluorescence or pigments | 2005-12-14 13:30:00 | 53.5346 N, 3.3602 W | RV Prince Madog PD48/05 |
| 680139 | PAR radiance and irradiance | 2005-12-14 13:30:00 | 53.5346 N, 3.3602 W | RV Prince Madog PD48/05 |
| 680164 | PAR radiance and irradiance | 2005-12-14 13:30:00 | 53.5346 N, 3.3602 W | RV Prince Madog PD48/05 |
| 680072 | Surface temp/sal | 2005-12-14 13:30:00 | 53.5346 N, 3.3602 W | RV Prince Madog PD48/05 |
| 680047 | Transmittance/attenuance, turbidity, or SPM conc. | 2005-12-14 13:30:00 | 53.5346 N, 3.3602 W | RV Prince Madog PD48/05 |
| 680256 | Water column chemistry | 2005-12-14 13:30:00 | 53.5346 N, 3.3602 W | RV Prince Madog PD48/05 |
| 680207 | Water column chemistry | 2005-12-14 15:04:00 | 53.5346 N, 3.3602 W | RV Prince Madog PD48/05 |
| 680232 | Water column chemistry | 2005-12-15 00:00:00 | 53.5346 N, 3.3602 W | RV Prince Madog PD48/05 |
| 696375 | Hydrography time series at depth | 2006-03-08 07:20:03 | 53.53283 N, 3.36 W | RV Prince Madog PD09/06 |
| 696295 | Hydrography time series at depth | 2006-03-08 07:40:01 | 53.536 N, 3.364 W | RV Prince Madog PD09/06 |
| 696302 | Hydrography time series at depth | 2006-03-08 07:40:01 | 53.536 N, 3.364 W | RV Prince Madog PD09/06 |
| 700413 | Fluorescence or pigments | 2006-03-08 08:00:00 | 53.5359 N, 3.3641 W | RV Prince Madog PD09/06 |
| 700554 | PAR radiance and irradiance | 2006-03-08 08:00:00 | 53.5359 N, 3.3641 W | RV Prince Madog PD09/06 |
| 700591 | PAR radiance and irradiance | 2006-03-08 08:00:00 | 53.5359 N, 3.3641 W | RV Prince Madog PD09/06 |
| 700345 | Surface temp/sal | 2006-03-08 08:00:00 | 53.5359 N, 3.3641 W | RV Prince Madog PD09/06 |
| 700462 | Transmittance/attenuance, turbidity, or SPM conc. | 2006-03-08 08:00:00 | 53.5359 N, 3.3641 W | RV Prince Madog PD09/06 |
| 700529 | Water column chemistry | 2006-03-08 08:00:00 | 53.5359 N, 3.3641 W | RV Prince Madog PD09/06 |
| 700498 | Water column chemistry | 2006-03-08 21:08:00 | 53.5359 N, 3.3641 W | RV Prince Madog PD09/06 |
| 700622 | Water column chemistry | 2006-03-09 00:00:00 | 53.5359 N, 3.3641 W | RV Prince Madog PD09/06 |
| 700401 | Fluorescence or pigments | 2006-05-09 12:00:00 | 53.5345 N, 3.3505 W | RV Prince Madog PD16/06 |
| 700578 | PAR radiance and irradiance | 2006-05-09 12:00:00 | 53.5345 N, 3.3505 W | RV Prince Madog PD16/06 |
| 700610 | PAR radiance and irradiance | 2006-05-09 12:00:00 | 53.5345 N, 3.3505 W | RV Prince Madog PD16/06 |
| 700357 | Surface temp/sal | 2006-05-09 12:00:00 | 53.5345 N, 3.3505 W | RV Prince Madog PD16/06 |
| 700474 | Transmittance/attenuance, turbidity, or SPM conc. | 2006-05-09 12:00:00 | 53.5345 N, 3.3505 W | RV Prince Madog PD16/06 |
| 700530 | Water column chemistry | 2006-05-09 12:00:00 | 53.5345 N, 3.3505 W | RV Prince Madog PD16/06 |
| 700505 | Water column chemistry | 2006-05-09 13:08:00 | 53.5345 N, 3.3505 W | RV Prince Madog PD16/06 |
| 700646 | Water column chemistry | 2006-05-10 00:00:00 | 53.5345 N, 3.3505 W | RV Prince Madog PD16/06 |
| 700425 | Fluorescence or pigments | 2006-06-23 10:00:00 | 53.5338 N, 3.3587 W | RV Prince Madog PD20/06 |
| 700566 | PAR radiance and irradiance | 2006-06-23 10:00:00 | 53.5338 N, 3.3587 W | RV Prince Madog PD20/06 |
| 700609 | PAR radiance and irradiance | 2006-06-23 10:00:00 | 53.5338 N, 3.3587 W | RV Prince Madog PD20/06 |
| 700369 | Surface temp/sal | 2006-06-23 10:00:00 | 53.5338 N, 3.3587 W | RV Prince Madog PD20/06 |
| 700486 | Transmittance/attenuance, turbidity, or SPM conc. | 2006-06-23 10:00:00 | 53.5338 N, 3.3587 W | RV Prince Madog PD20/06 |
| 700542 | Water column chemistry | 2006-06-23 10:00:00 | 53.5338 N, 3.3587 W | RV Prince Madog PD20/06 |
| 700517 | Water column chemistry | 2006-06-23 11:08:00 | 53.5338 N, 3.3587 W | RV Prince Madog PD20/06 |
| 700634 | Water column chemistry | 2006-06-26 00:00:00 | 53.5338 N, 3.3587 W | RV Prince Madog PD20/06 |
| 747149 | Fluorescence or pigments | 2006-07-26 13:00:00 | 53.5333 N, 3.3602 W | RV Prince Madog PD22/06 |
| 747346 | PAR radiance and irradiance | 2006-07-26 13:00:00 | 53.5333 N, 3.3602 W | RV Prince Madog PD22/06 |
| 747402 | PAR radiance and irradiance | 2006-07-26 13:00:00 | 53.5333 N, 3.3602 W | RV Prince Madog PD22/06 |
| 747008 | Surface temp/sal | 2006-07-26 13:00:00 | 53.5333 N, 3.3602 W | RV Prince Madog PD22/06 |
| 747230 | Transmittance/attenuance, turbidity, or SPM conc. | 2006-07-26 13:00:00 | 53.5333 N, 3.3602 W | RV Prince Madog PD22/06 |
| 747291 | Water column chemistry | 2006-07-26 13:00:00 | 53.5333 N, 3.3602 W | RV Prince Madog PD22/06 |
| 747518 | Water column chemistry | 2006-07-26 14:08:00 | 53.5333 N, 3.3602 W | RV Prince Madog PD22/06 |
| 747531 | Water column chemistry | 2006-07-27 00:00:00 | 53.5333 N, 3.3602 W | RV Prince Madog PD22/06 |
| 747125 | Fluorescence or pigments | 2006-08-15 13:00:00 | 53.5332 N, 3.3633 W | RV Prince Madog PD25/06 |
| 747358 | PAR radiance and irradiance | 2006-08-15 13:00:00 | 53.5332 N, 3.3633 W | RV Prince Madog PD25/06 |
| 747414 | PAR radiance and irradiance | 2006-08-15 13:00:00 | 53.5332 N, 3.3633 W | RV Prince Madog PD25/06 |
| 747021 | Surface temp/sal | 2006-08-15 13:00:00 | 53.5332 N, 3.3633 W | RV Prince Madog PD25/06 |
| 747242 | Transmittance/attenuance, turbidity, or SPM conc. | 2006-08-15 13:00:00 | 53.5332 N, 3.3633 W | RV Prince Madog PD25/06 |
| 747309 | Water column chemistry | 2006-08-15 13:00:00 | 53.5332 N, 3.3633 W | RV Prince Madog PD25/06 |
| 747543 | Water column chemistry | 2006-08-16 00:00:00 | 53.5332 N, 3.3633 W | RV Prince Madog PD25/06 |
| 747463 | Water column chemistry | 2006-08-22 17:38:00 | 53.5332 N, 3.3633 W | RV Prince Madog PD25/06 |
| 747150 | Fluorescence or pigments | 2006-09-21 12:30:00 | 53.534 N, 3.3599 W | RV Prince Madog PD29/06 |
| 747371 | PAR radiance and irradiance | 2006-09-21 12:30:00 | 53.534 N, 3.3599 W | RV Prince Madog PD29/06 |
| 747426 | PAR radiance and irradiance | 2006-09-21 12:30:00 | 53.534 N, 3.3599 W | RV Prince Madog PD29/06 |
| 747033 | Surface temp/sal | 2006-09-21 12:30:00 | 53.534 N, 3.3599 W | RV Prince Madog PD29/06 |
| 747254 | Transmittance/attenuance, turbidity, or SPM conc. | 2006-09-21 12:30:00 | 53.534 N, 3.3599 W | RV Prince Madog PD29/06 |
| 747310 | Water column chemistry | 2006-09-21 12:30:00 | 53.534 N, 3.3599 W | RV Prince Madog PD29/06 |
| 747555 | Water column chemistry | 2006-09-22 00:00:00 | 53.534 N, 3.3599 W | RV Prince Madog PD29/06 |
| 747475 | Water column chemistry | 2006-09-23 07:08:00 | 53.534 N, 3.3599 W | RV Prince Madog PD29/06 |
| 1012858 | CTD or STD cast | 2006-11-01 12:33:00 | 53.5315 N, 3.367 W | RV Prince Madog PD35/06 |
| 753099 | Hydrography time series at depth | 2006-11-01 14:40:03 | 53.534 N, 3.35783 W | RV Prince Madog PD35/06 |
| 752926 | Hydrography time series at depth | 2006-11-02 08:20:01 | 53.53367 N, 3.36317 W | RV Prince Madog PD35/06 |
| 752938 | Hydrography time series at depth | 2006-11-02 08:20:01 | 53.53367 N, 3.36317 W | RV Prince Madog PD35/06 |
| 747137 | Fluorescence or pigments | 2006-11-02 08:30:00 | 53.5337 N, 3.3632 W | RV Prince Madog PD35/06 |
| 747383 | PAR radiance and irradiance | 2006-11-02 08:30:00 | 53.5337 N, 3.3632 W | RV Prince Madog PD35/06 |
| 747438 | PAR radiance and irradiance | 2006-11-02 08:30:00 | 53.5337 N, 3.3632 W | RV Prince Madog PD35/06 |
| 747045 | Surface temp/sal | 2006-11-02 08:30:00 | 53.5337 N, 3.3632 W | RV Prince Madog PD35/06 |
| 747278 | Transmittance/attenuance, turbidity, or SPM conc. | 2006-11-02 08:30:00 | 53.5337 N, 3.3632 W | RV Prince Madog PD35/06 |
| 747322 | Water column chemistry | 2006-11-02 08:30:00 | 53.5337 N, 3.3632 W | RV Prince Madog PD35/06 |
| 1013143 | CTD or STD cast | 2006-11-02 08:39:00 | 53.53317 N, 3.36183 W | RV Prince Madog PD35/06 |
| 747487 | Water column chemistry | 2006-11-02 09:08:00 | 53.5337 N, 3.3632 W | RV Prince Madog PD35/06 |
| 747567 | Water column chemistry | 2006-11-04 00:00:00 | 53.5337 N, 3.3632 W | RV Prince Madog PD35/06 |
| 1003634 | CTD or STD cast | 2006-12-15 08:04:00 | 53.533 N, 3.36567 W | RV Prince Madog PD37/06 |
| 753118 | Hydrography time series at depth | 2006-12-15 09:10:03 | 53.534 N, 3.35783 W | RV Prince Madog PD37/06 |
| 752951 | Hydrography time series at depth | 2006-12-15 09:50:01 | 53.53317 N, 3.36067 W | RV Prince Madog PD37/06 |
| 753026 | Hydrography time series at depth | 2006-12-15 09:50:01 | 53.53317 N, 3.36067 W | RV Prince Madog PD37/06 |
| 747162 | Fluorescence or pigments | 2006-12-15 10:00:00 | 53.5332 N, 3.3607 W | RV Prince Madog PD37/06 |
| 747395 | PAR radiance and irradiance | 2006-12-15 10:00:00 | 53.5332 N, 3.3607 W | RV Prince Madog PD37/06 |
| 747451 | PAR radiance and irradiance | 2006-12-15 10:00:00 | 53.5332 N, 3.3607 W | RV Prince Madog PD37/06 |
| 747057 | Surface temp/sal | 2006-12-15 10:00:00 | 53.5332 N, 3.3607 W | RV Prince Madog PD37/06 |
| 747266 | Transmittance/attenuance, turbidity, or SPM conc. | 2006-12-15 10:00:00 | 53.5332 N, 3.3607 W | RV Prince Madog PD37/06 |
| 747334 | Water column chemistry | 2006-12-15 10:00:00 | 53.5332 N, 3.3607 W | RV Prince Madog PD37/06 |
| 747499 | Water column chemistry | 2006-12-15 10:08:00 | 53.5332 N, 3.3607 W | RV Prince Madog PD37/06 |
| 1003646 | CTD or STD cast | 2006-12-15 10:14:00 | 53.53367 N, 3.36617 W | RV Prince Madog PD37/06 |
| 747506 | Water column chemistry | 2006-12-22 00:02:00 | 53.5332 N, 3.3607 W | RV Prince Madog PD37/06 |
| 979037 | CTD or STD cast | 2007-02-14 11:31:00 | 53.534 N, 3.36417 W | RV Prince Madog PD02/07 |
| 1623040 | Currents -subsurface Eulerian | 2007-02-14 12:50:00 | 53.53417 N, 3.3585 W | RV Prince Madog PD02/07 |
| 753143 | Hydrography time series at depth | 2007-02-14 12:50:03 | 53.53417 N, 3.3585 W | RV Prince Madog PD02/07 |
| 752963 | Hydrography time series at depth | 2007-02-14 13:20:01 | 53.53317 N, 3.36267 W | RV Prince Madog PD02/07 |
| 752975 | Hydrography time series at depth | 2007-02-14 13:20:01 | 53.53317 N, 3.36267 W | RV Prince Madog PD02/07 |
| 862196 | Fluorescence or pigments | 2007-02-14 13:30:00 | 53.5331 N, 3.36265 W | RV Prince Madog PD02/07 |
| 862621 | PAR radiance and irradiance | 2007-02-14 13:30:00 | 53.5331 N, 3.36265 W | RV Prince Madog PD02/07 |
| 862725 | PAR radiance and irradiance | 2007-02-14 13:30:00 | 53.5331 N, 3.36265 W | RV Prince Madog PD02/07 |
| 861980 | Surface temp/sal | 2007-02-14 13:30:00 | 53.5331 N, 3.36265 W | RV Prince Madog PD02/07 |
| 862400 | Transmittance/attenuance, turbidity, or SPM conc. | 2007-02-14 13:30:00 | 53.5331 N, 3.36265 W | RV Prince Madog PD02/07 |
| 862829 | Water column chemistry | 2007-02-14 13:30:00 | 53.5331 N, 3.36265 W | RV Prince Madog PD02/07 |
| 1082291 | Water column chemistry | 2007-02-14 14:00:00 | 53.5331 N, 3.36265 W | RV Prince Madog PD02/07 |
| 979050 | CTD or STD cast | 2007-02-14 19:54:00 | 53.533 N, 3.3615 W | RV Prince Madog PD02/07 |
| 1082543 | Water column chemistry | 2007-02-15 00:00:00 | 53.5331 N, 3.36265 W | RV Prince Madog PD02/07 |
| 979222 | CTD or STD cast | 2007-02-15 09:58:00 | 53.53117 N, 3.35983 W | RV Prince Madog PD02/07 |
| 752999 | Hydrography time series at depth | 2007-04-16 13:40:01 | 53.53483 N, 3.361 W | RV Prince Madog PD06/07 |
| 753038 | Hydrography time series at depth | 2007-04-16 13:40:01 | 53.53483 N, 3.361 W | RV Prince Madog PD06/07 |
| 753432 | Hydrography time series at depth | 2007-04-16 13:50:00 | 53.53483 N, 3.361 W | RV Prince Madog PD06/07 |
| 753444 | Hydrography time series at depth | 2007-04-16 13:50:00 | 53.53483 N, 3.361 W | RV Prince Madog PD06/07 |
| 862203 | Fluorescence or pigments | 2007-04-16 14:00:00 | 53.5349 N, 3.36098 W | RV Prince Madog PD06/07 |
| 862633 | PAR radiance and irradiance | 2007-04-16 14:00:00 | 53.5349 N, 3.36098 W | RV Prince Madog PD06/07 |
| 862737 | PAR radiance and irradiance | 2007-04-16 14:00:00 | 53.5349 N, 3.36098 W | RV Prince Madog PD06/07 |
| 861992 | Surface temp/sal | 2007-04-16 14:00:00 | 53.5349 N, 3.36098 W | RV Prince Madog PD06/07 |
| 862412 | Transmittance/attenuance, turbidity, or SPM conc. | 2007-04-16 14:00:00 | 53.5349 N, 3.36098 W | RV Prince Madog PD06/07 |
| 862830 | Water column chemistry | 2007-04-16 14:00:00 | 53.5349 N, 3.36098 W | RV Prince Madog PD06/07 |
| 1082309 | Water column chemistry | 2007-04-16 14:00:00 | 53.5349 N, 3.36098 W | RV Prince Madog PD06/07 |
| 753167 | Hydrography time series at depth | 2007-04-16 14:40:03 | 53.5345 N, 3.35967 W | RV Prince Madog PD06/07 |
| 937502 | CTD or STD cast | 2007-04-16 14:47:00 | 53.5325 N, 3.3645 W | RV Prince Madog PD06/07 |
| 1082451 | Water column chemistry | 2007-04-17 00:00:00 | 53.5349 N, 3.36098 W | RV Prince Madog PD06/07 |
| 937680 | CTD or STD cast | 2007-04-19 20:57:00 | 53.532 N, 3.36533 W | RV Prince Madog PD06/07 |
| 941482 | CTD or STD cast | 2007-05-15 10:37:00 | 53.53267 N, 3.36217 W | RV Prince Madog PD09/07 |
| 753180 | Hydrography time series at depth | 2007-05-15 11:40:03 | 53.53417 N, 3.359 W | RV Prince Madog PD09/07 |
| 862215 | Fluorescence or pigments | 2007-05-15 12:00:00 | 53.53497 N, 3.36743 W | RV Prince Madog PD09/07 |
| 753002 | Hydrography time series at depth | 2007-05-15 12:00:00 | 53.535 N, 3.3675 W | RV Prince Madog PD09/07 |
| 753075 | Hydrography time series at depth | 2007-05-15 12:00:00 | 53.535 N, 3.3675 W | RV Prince Madog PD09/07 |
| 753456 | Hydrography time series at depth | 2007-05-15 12:00:00 | 53.535 N, 3.3675 W | RV Prince Madog PD09/07 |
| 753468 | Hydrography time series at depth | 2007-05-15 12:00:00 | 53.535 N, 3.3675 W | RV Prince Madog PD09/07 |
| 862645 | PAR radiance and irradiance | 2007-05-15 12:00:00 | 53.53497 N, 3.36743 W | RV Prince Madog PD09/07 |
| 862749 | PAR radiance and irradiance | 2007-05-15 12:00:00 | 53.53497 N, 3.36743 W | RV Prince Madog PD09/07 |
| 862006 | Surface temp/sal | 2007-05-15 12:00:00 | 53.53497 N, 3.36743 W | RV Prince Madog PD09/07 |
| 862424 | Transmittance/attenuance, turbidity, or SPM conc. | 2007-05-15 12:00:00 | 53.53497 N, 3.36743 W | RV Prince Madog PD09/07 |
| 862842 | Water column chemistry | 2007-05-15 12:00:00 | 53.53497 N, 3.36743 W | RV Prince Madog PD09/07 |
| 941494 | CTD or STD cast | 2007-05-15 15:00:00 | 53.5375 N, 3.347 W | RV Prince Madog PD09/07 |
| 941501 | CTD or STD cast | 2007-05-15 15:30:00 | 53.53733 N, 3.347 W | RV Prince Madog PD09/07 |
| 941513 | CTD or STD cast | 2007-05-15 16:00:00 | 53.53717 N, 3.347 W | RV Prince Madog PD09/07 |
| 941525 | CTD or STD cast | 2007-05-15 16:30:00 | 53.53667 N, 3.34583 W | RV Prince Madog PD09/07 |
| 941537 | CTD or STD cast | 2007-05-15 17:01:00 | 53.5365 N, 3.34567 W | RV Prince Madog PD09/07 |
| 941549 | CTD or STD cast | 2007-05-15 17:31:00 | 53.53667 N, 3.34533 W | RV Prince Madog PD09/07 |
| 941550 | CTD or STD cast | 2007-05-15 18:00:00 | 53.53683 N, 3.345 W | RV Prince Madog PD09/07 |
| 941562 | CTD or STD cast | 2007-05-15 18:32:00 | 53.53683 N, 3.34433 W | RV Prince Madog PD09/07 |
| 941574 | CTD or STD cast | 2007-05-15 19:03:00 | 53.53667 N, 3.344 W | RV Prince Madog PD09/07 |
| 941586 | CTD or STD cast | 2007-05-15 19:34:00 | 53.53667 N, 3.34417 W | RV Prince Madog PD09/07 |
| 941598 | CTD or STD cast | 2007-05-15 20:03:00 | 53.53667 N, 3.34417 W | RV Prince Madog PD09/07 |
| 941605 | CTD or STD cast | 2007-05-15 20:30:00 | 53.53667 N, 3.34417 W | RV Prince Madog PD09/07 |
| 941617 | CTD or STD cast | 2007-05-15 21:03:00 | 53.53667 N, 3.34417 W | RV Prince Madog PD09/07 |
| 941629 | CTD or STD cast | 2007-05-15 21:33:00 | 53.53667 N, 3.34417 W | RV Prince Madog PD09/07 |
| 941630 | CTD or STD cast | 2007-05-15 22:03:00 | 53.5365 N, 3.34433 W | RV Prince Madog PD09/07 |
| 941642 | CTD or STD cast | 2007-05-15 22:32:00 | 53.5365 N, 3.34433 W | RV Prince Madog PD09/07 |
| 941654 | CTD or STD cast | 2007-05-15 23:00:00 | 53.53633 N, 3.345 W | RV Prince Madog PD09/07 |
| 941666 | CTD or STD cast | 2007-05-15 23:30:00 | 53.53717 N, 3.3465 W | RV Prince Madog PD09/07 |
| 1082463 | Water column chemistry | 2007-05-16 00:00:00 | 53.53497 N, 3.36743 W | RV Prince Madog PD09/07 |
| 941678 | CTD or STD cast | 2007-05-16 00:01:00 | 53.53733 N, 3.34667 W | RV Prince Madog PD09/07 |
| 941691 | CTD or STD cast | 2007-05-16 00:31:00 | 53.53733 N, 3.3465 W | RV Prince Madog PD09/07 |
| 941709 | CTD or STD cast | 2007-05-16 01:00:00 | 53.53733 N, 3.3465 W | RV Prince Madog PD09/07 |
| 941710 | CTD or STD cast | 2007-05-16 01:32:00 | 53.53733 N, 3.34667 W | RV Prince Madog PD09/07 |
| 941722 | CTD or STD cast | 2007-05-16 02:01:00 | 53.53733 N, 3.34667 W | RV Prince Madog PD09/07 |
| 941734 | CTD or STD cast | 2007-05-16 03:00:00 | 53.537 N, 3.34717 W | RV Prince Madog PD09/07 |
| 941746 | CTD or STD cast | 2007-05-16 03:31:00 | 53.53683 N, 3.347 W | RV Prince Madog PD09/07 |
| 941758 | CTD or STD cast | 2007-05-16 03:59:00 | 53.537 N, 3.347 W | RV Prince Madog PD09/07 |
| 941771 | CTD or STD cast | 2007-05-16 04:29:00 | 53.53717 N, 3.34667 W | RV Prince Madog PD09/07 |
| 941783 | CTD or STD cast | 2007-05-16 05:00:00 | 53.5375 N, 3.34467 W | RV Prince Madog PD09/07 |
| 941795 | CTD or STD cast | 2007-05-16 05:31:00 | 53.53767 N, 3.34417 W | RV Prince Madog PD09/07 |
| 941802 | CTD or STD cast | 2007-05-16 06:00:00 | 53.53733 N, 3.34367 W | RV Prince Madog PD09/07 |
| 941814 | CTD or STD cast | 2007-05-16 06:29:00 | 53.53733 N, 3.3435 W | RV Prince Madog PD09/07 |
| 941826 | CTD or STD cast | 2007-05-16 07:03:00 | 53.53717 N, 3.3435 W | RV Prince Madog PD09/07 |
| 941838 | CTD or STD cast | 2007-05-16 07:30:00 | 53.53717 N, 3.3435 W | RV Prince Madog PD09/07 |
| 941851 | CTD or STD cast | 2007-05-16 08:00:00 | 53.537 N, 3.34333 W | RV Prince Madog PD09/07 |
| 941863 | CTD or STD cast | 2007-05-16 08:28:00 | 53.53717 N, 3.34333 W | RV Prince Madog PD09/07 |
| 941875 | CTD or STD cast | 2007-05-16 09:01:00 | 53.53717 N, 3.3435 W | RV Prince Madog PD09/07 |
| 941887 | CTD or STD cast | 2007-05-16 09:31:00 | 53.53717 N, 3.34333 W | RV Prince Madog PD09/07 |
| 941899 | CTD or STD cast | 2007-05-16 10:02:00 | 53.53717 N, 3.3435 W | RV Prince Madog PD09/07 |
| 941906 | CTD or STD cast | 2007-05-16 10:30:00 | 53.53717 N, 3.3435 W | RV Prince Madog PD09/07 |
| 941918 | CTD or STD cast | 2007-05-16 11:01:00 | 53.53733 N, 3.3435 W | RV Prince Madog PD09/07 |
| 941931 | CTD or STD cast | 2007-05-16 11:31:00 | 53.5375 N, 3.34367 W | RV Prince Madog PD09/07 |
| 941943 | CTD or STD cast | 2007-05-16 12:01:00 | 53.53717 N, 3.3455 W | RV Prince Madog PD09/07 |
| 941955 | CTD or STD cast | 2007-05-16 12:31:00 | 53.5375 N, 3.34633 W | RV Prince Madog PD09/07 |
| 941967 | CTD or STD cast | 2007-05-16 13:01:00 | 53.5365 N, 3.3465 W | RV Prince Madog PD09/07 |
| 941979 | CTD or STD cast | 2007-05-16 13:30:00 | 53.5365 N, 3.34633 W | RV Prince Madog PD09/07 |
| 941980 | CTD or STD cast | 2007-05-16 14:01:00 | 53.5375 N, 3.34683 W | RV Prince Madog PD09/07 |
| 941992 | CTD or STD cast | 2007-05-16 15:00:00 | 53.53683 N, 3.347 W | RV Prince Madog PD09/07 |
| 942006 | CTD or STD cast | 2007-05-16 15:31:00 | 53.53683 N, 3.347 W | RV Prince Madog PD09/07 |
| 942018 | CTD or STD cast | 2007-05-16 15:59:00 | 53.53683 N, 3.34683 W | RV Prince Madog PD09/07 |
| 942135 | CTD or STD cast | 2007-05-16 23:43:00 | 53.53383 N, 3.37783 W | RV Prince Madog PD09/07 |
| 942725 | CTD or STD cast | 2007-06-20 09:54:00 | 53.53517 N, 3.36067 W | RV Prince Madog PD13/07 |
| 952836 | Hydrography time series at depth | 2007-06-20 10:50:03 | 53.53433 N, 3.35467 W | RV Prince Madog PD13/07 |
| 952904 | Hydrography time series at depth | 2007-06-20 11:50:00 | 53.53533 N, 3.35717 W | RV Prince Madog PD13/07 |
| 952861 | Hydrography time series at depth | 2007-06-20 11:50:01 | 53.53533 N, 3.35717 W | RV Prince Madog PD13/07 |
| 952885 | Hydrography time series at depth | 2007-06-20 11:50:01 | 53.53533 N, 3.35717 W | RV Prince Madog PD13/07 |
| 862227 | Fluorescence or pigments | 2007-06-20 12:00:00 | 53.5363 N, 3.35708 W | RV Prince Madog PD13/07 |
| 862657 | PAR radiance and irradiance | 2007-06-20 12:00:00 | 53.5363 N, 3.35708 W | RV Prince Madog PD13/07 |
| 862750 | PAR radiance and irradiance | 2007-06-20 12:00:00 | 53.5363 N, 3.35708 W | RV Prince Madog PD13/07 |
| 862018 | Surface temp/sal | 2007-06-20 12:00:00 | 53.5363 N, 3.35708 W | RV Prince Madog PD13/07 |
| 862436 | Transmittance/attenuance, turbidity, or SPM conc. | 2007-06-20 12:00:00 | 53.5363 N, 3.35708 W | RV Prince Madog PD13/07 |
| 862854 | Water column chemistry | 2007-06-20 12:00:00 | 53.5363 N, 3.35708 W | RV Prince Madog PD13/07 |
| 942737 | CTD or STD cast | 2007-06-20 13:46:00 | 53.53867 N, 3.35167 W | RV Prince Madog PD13/07 |
| 942830 | CTD or STD cast | 2007-06-20 20:41:00 | 53.53767 N, 3.35817 W | RV Prince Madog PD13/07 |
| 943175 | CTD or STD cast | 2007-07-26 10:25:00 | 53.53783 N, 3.361 W | RV Prince Madog PD16/07 |
| 946345 | Hydrography time series at depth | 2007-07-26 12:00:03 | 53.53517 N, 3.35683 W | RV Prince Madog PD16/07 |
| 862239 | Fluorescence or pigments | 2007-07-26 12:30:00 | 53.53502 N, 3.35907 W | RV Prince Madog PD16/07 |
| 946370 | Hydrography time series at depth | 2007-07-26 12:30:00 | 53.535 N, 3.359 W | RV Prince Madog PD16/07 |
| 946382 | Hydrography time series at depth | 2007-07-26 12:30:00 | 53.535 N, 3.359 W | RV Prince Madog PD16/07 |
| 946401 | Hydrography time series at depth | 2007-07-26 12:30:00 | 53.535 N, 3.359 W | RV Prince Madog PD16/07 |
| 862669 | PAR radiance and irradiance | 2007-07-26 12:30:00 | 53.53502 N, 3.35907 W | RV Prince Madog PD16/07 |
| 862762 | PAR radiance and irradiance | 2007-07-26 12:30:00 | 53.53502 N, 3.35907 W | RV Prince Madog PD16/07 |
| 862031 | Surface temp/sal | 2007-07-26 12:30:00 | 53.53502 N, 3.35907 W | RV Prince Madog PD16/07 |
| 862448 | Transmittance/attenuance, turbidity, or SPM conc. | 2007-07-26 12:30:00 | 53.53502 N, 3.35907 W | RV Prince Madog PD16/07 |
| 862866 | Water column chemistry | 2007-07-26 12:30:00 | 53.53502 N, 3.35907 W | RV Prince Madog PD16/07 |
| 943187 | CTD or STD cast | 2007-07-26 14:56:00 | 53.53533 N, 3.352 W | RV Prince Madog PD16/07 |
| 943280 | CTD or STD cast | 2007-07-26 22:41:00 | 53.531 N, 3.36083 W | RV Prince Madog PD16/07 |
| 1082310 | Water column chemistry | 2007-07-27 02:00:00 | 53.53502 N, 3.35907 W | RV Prince Madog PD16/07 |
| 943568 | CTD or STD cast | 2007-08-29 11:12:00 | 53.53533 N, 3.33883 W | RV Prince Madog PD20/07 |
| 941433 | Hydrography time series at depth | 2007-08-29 13:20:03 | 53.535 N, 3.35733 W | RV Prince Madog PD20/07 |
| 941390 | Hydrography time series at depth | 2007-08-29 13:40:00 | 53.534 N, 3.36217 W | RV Prince Madog PD20/07 |
| 941408 | Hydrography time series at depth | 2007-08-29 13:40:00 | 53.534 N, 3.36217 W | RV Prince Madog PD20/07 |
| 941457 | Hydrography time series at depth | 2007-08-29 13:40:00 | 53.534 N, 3.36217 W | RV Prince Madog PD20/07 |
| 941469 | Hydrography time series at depth | 2007-08-29 13:40:00 | 53.534 N, 3.36217 W | RV Prince Madog PD20/07 |
| 862240 | Fluorescence or pigments | 2007-08-29 14:00:00 | 53.53393 N, 3.3621 W | RV Prince Madog PD20/07 |
| 862670 | PAR radiance and irradiance | 2007-08-29 14:00:00 | 53.53393 N, 3.3621 W | RV Prince Madog PD20/07 |
| 862774 | PAR radiance and irradiance | 2007-08-29 14:00:00 | 53.53393 N, 3.3621 W | RV Prince Madog PD20/07 |
| 862043 | Surface temp/sal | 2007-08-29 14:00:00 | 53.53393 N, 3.3621 W | RV Prince Madog PD20/07 |
| 862461 | Transmittance/attenuance, turbidity, or SPM conc. | 2007-08-29 14:00:00 | 53.53393 N, 3.3621 W | RV Prince Madog PD20/07 |
| 862878 | Water column chemistry | 2007-08-29 14:00:00 | 53.53393 N, 3.3621 W | RV Prince Madog PD20/07 |
| 943581 | CTD or STD cast | 2007-08-29 14:09:00 | 53.532 N, 3.37 W | RV Prince Madog PD20/07 |
| 943697 | CTD or STD cast | 2007-08-29 22:43:00 | 53.53067 N, 3.36067 W | RV Prince Madog PD20/07 |
| 1082322 | Water column chemistry | 2007-08-30 17:00:00 | 53.53393 N, 3.3621 W | RV Prince Madog PD20/07 |
| 1082475 | Water column chemistry | 2007-09-15 00:00:00 | 53.53393 N, 3.3621 W | RV Prince Madog PD20/07 |
| 945526 | CTD or STD cast | 2007-10-03 11:13:00 | 53.53267 N, 3.3575 W | RV Prince Madog PD23/07 |
| 767882 | Hydrography time series at depth | 2007-10-03 12:30:03 | 53.53517 N, 3.357 W | RV Prince Madog PD23/07 |
| 767901 | Hydrography time series at depth | 2007-10-03 12:50:00 | 53.53333 N, 3.36283 W | RV Prince Madog PD23/07 |
| 767833 | Hydrography time series at depth | 2007-10-03 12:50:01 | 53.53333 N, 3.36283 W | RV Prince Madog PD23/07 |
| 767869 | Hydrography time series at depth | 2007-10-03 12:50:01 | 53.53333 N, 3.36283 W | RV Prince Madog PD23/07 |
| 862252 | Fluorescence or pigments | 2007-10-03 13:00:00 | 53.5333 N, 3.36282 W | RV Prince Madog PD23/07 |
| 862682 | PAR radiance and irradiance | 2007-10-03 13:00:00 | 53.5333 N, 3.36282 W | RV Prince Madog PD23/07 |
| 862786 | PAR radiance and irradiance | 2007-10-03 13:00:00 | 53.5333 N, 3.36282 W | RV Prince Madog PD23/07 |
| 862055 | Surface temp/sal | 2007-10-03 13:00:00 | 53.5333 N, 3.36282 W | RV Prince Madog PD23/07 |
| 862473 | Transmittance/attenuance, turbidity, or SPM conc. | 2007-10-03 13:00:00 | 53.5333 N, 3.36282 W | RV Prince Madog PD23/07 |
| 862891 | Water column chemistry | 2007-10-03 13:00:00 | 53.5333 N, 3.36282 W | RV Prince Madog PD23/07 |
| 945538 | CTD or STD cast | 2007-10-03 13:17:00 | 53.53783 N, 3.356 W | RV Prince Madog PD23/07 |
| 1082334 | Water column chemistry | 2007-10-03 14:00:00 | 53.5333 N, 3.36282 W | RV Prince Madog PD23/07 |
| 945643 | CTD or STD cast | 2007-10-03 21:05:00 | 53.53233 N, 3.36183 W | RV Prince Madog PD23/07 |
| 1082487 | Water column chemistry | 2007-10-04 00:00:00 | 53.5333 N, 3.36282 W | RV Prince Madog PD23/07 |
| 946498 | CTD or STD cast | 2007-11-21 12:18:00 | 53.53083 N, 3.36317 W | RV Prince Madog PD27/07 |
| 770503 | Hydrography time series at depth | 2007-11-21 13:20:03 | 53.535 N, 3.35667 W | RV Prince Madog PD27/07 |
| 862264 | Fluorescence or pigments | 2007-11-21 13:30:00 | 53.53415 N, 3.35878 W | RV Prince Madog PD27/07 |
| 862694 | PAR radiance and irradiance | 2007-11-21 13:30:00 | 53.53415 N, 3.35878 W | RV Prince Madog PD27/07 |
| 862798 | PAR radiance and irradiance | 2007-11-21 13:30:00 | 53.53415 N, 3.35878 W | RV Prince Madog PD27/07 |
| 862067 | Surface temp/sal | 2007-11-21 13:30:00 | 53.53415 N, 3.35878 W | RV Prince Madog PD27/07 |
| 862485 | Transmittance/attenuance, turbidity, or SPM conc. | 2007-11-21 13:30:00 | 53.53415 N, 3.35878 W | RV Prince Madog PD27/07 |
| 862909 | Water column chemistry | 2007-11-21 13:30:00 | 53.53415 N, 3.35878 W | RV Prince Madog PD27/07 |
| 770515 | Hydrography time series at depth | 2007-11-21 13:40:00 | 53.53417 N, 3.35883 W | RV Prince Madog PD27/07 |
| 770527 | Hydrography time series at depth | 2007-11-21 13:40:00 | 53.53417 N, 3.35883 W | RV Prince Madog PD27/07 |
| 770552 | Hydrography time series at depth | 2007-11-21 13:40:00 | 53.53417 N, 3.35883 W | RV Prince Madog PD27/07 |
| 770564 | Hydrography time series at depth | 2007-11-21 13:40:00 | 53.53417 N, 3.35883 W | RV Prince Madog PD27/07 |
| 946505 | CTD or STD cast | 2007-11-21 13:54:00 | 53.536 N, 3.36083 W | RV Prince Madog PD27/07 |
| 1082346 | Water column chemistry | 2007-11-21 15:00:00 | 53.53415 N, 3.35878 W | RV Prince Madog PD27/07 |
| 946671 | CTD or STD cast | 2007-11-22 05:05:00 | 53.53617 N, 3.35267 W | RV Prince Madog PD27/07 |
| 1082499 | Water column chemistry | 2007-11-26 00:00:00 | 53.53415 N, 3.35878 W | RV Prince Madog PD27/07 |
| 946775 | CTD or STD cast | 2008-01-10 23:30:00 | 53.529 N, 3.35517 W | RV Prince Madog PD01/08 |
| 946867 | CTD or STD cast | 2008-01-11 06:42:00 | 53.53733 N, 3.3645 W | RV Prince Madog PD01/08 |
| 862276 | Fluorescence or pigments | 2008-01-11 08:00:00 | 53.53373 N, 3.35807 W | RV Prince Madog PD01/08 |
| 770460 | Hydrography time series at depth | 2008-01-11 08:00:00 | 53.53367 N, 3.358 W | RV Prince Madog PD01/08 |
| 770496 | Hydrography time series at depth | 2008-01-11 08:00:00 | 53.53367 N, 3.358 W | RV Prince Madog PD01/08 |
| 862701 | PAR radiance and irradiance | 2008-01-11 08:00:00 | 53.53373 N, 3.35807 W | RV Prince Madog PD01/08 |
| 862079 | Surface temp/sal | 2008-01-11 08:00:00 | 53.53373 N, 3.35807 W | RV Prince Madog PD01/08 |
| 862497 | Transmittance/attenuance, turbidity, or SPM conc. | 2008-01-11 08:00:00 | 53.53373 N, 3.35807 W | RV Prince Madog PD01/08 |
| 862910 | Water column chemistry | 2008-01-11 08:00:00 | 53.53373 N, 3.35807 W | RV Prince Madog PD01/08 |
| 1082358 | Water column chemistry | 2008-01-11 08:00:00 | 53.53373 N, 3.35807 W | RV Prince Madog PD01/08 |
| 770435 | Hydrography time series at depth | 2008-01-11 08:00:02 | 53.53367 N, 3.358 W | RV Prince Madog PD01/08 |
| 770459 | Hydrography time series at depth | 2008-01-11 08:00:02 | 53.53367 N, 3.358 W | RV Prince Madog PD01/08 |
| 862805 | PAR radiance and irradiance | 2008-01-11 08:30:00 | 53.53373 N, 3.35807 W | RV Prince Madog PD01/08 |
| 770411 | Hydrography time series at depth | 2008-01-11 10:30:03 | 53.53283 N, 3.3625 W | RV Prince Madog PD01/08 |
| 1623039 | Currents -subsurface Eulerian | 2008-01-11 10:30:38 | 53.53283 N, 3.3625 W | RV Prince Madog PD01/08 |
| 946879 | CTD or STD cast | 2008-01-11 10:46:00 | 53.53083 N, 3.35617 W | RV Prince Madog PD01/08 |
| 1082506 | Water column chemistry | 2008-01-13 00:00:00 | 53.53373 N, 3.35807 W | RV Prince Madog PD01/08 |
| 947103 | CTD or STD cast | 2008-03-14 07:57:00 | 53.53417 N, 3.36783 W | RV Prince Madog PD07/08 |
| 772374 | Hydrography time series at depth | 2008-03-14 10:30:03 | 53.53367 N, 3.35683 W | RV Prince Madog PD07/08 |
| 862288 | Fluorescence or pigments | 2008-03-14 11:00:00 | 53.53362 N, 3.35818 W | RV Prince Madog PD07/08 |
| 772386 | Hydrography time series at depth | 2008-03-14 11:00:00 | 53.53367 N, 3.35817 W | RV Prince Madog PD07/08 |
| 772405 | Hydrography time series at depth | 2008-03-14 11:00:00 | 53.53367 N, 3.35817 W | RV Prince Madog PD07/08 |
| 772430 | Hydrography time series at depth | 2008-03-14 11:00:00 | 53.53367 N, 3.35817 W | RV Prince Madog PD07/08 |
| 772442 | Hydrography time series at depth | 2008-03-14 11:00:00 | 53.53367 N, 3.35817 W | RV Prince Madog PD07/08 |
| 862713 | PAR radiance and irradiance | 2008-03-14 11:00:00 | 53.53362 N, 3.35818 W | RV Prince Madog PD07/08 |
| 862817 | PAR radiance and irradiance | 2008-03-14 11:00:00 | 53.53362 N, 3.35818 W | RV Prince Madog PD07/08 |
| 862080 | Surface temp/sal | 2008-03-14 11:00:00 | 53.53362 N, 3.35818 W | RV Prince Madog PD07/08 |
| 862504 | Transmittance/attenuance, turbidity, or SPM conc. | 2008-03-14 11:00:00 | 53.53362 N, 3.35818 W | RV Prince Madog PD07/08 |
| 862922 | Water column chemistry | 2008-03-14 11:00:00 | 53.53362 N, 3.35818 W | RV Prince Madog PD07/08 |
| 1082371 | Water column chemistry | 2008-03-14 11:00:00 | 53.53362 N, 3.35818 W | RV Prince Madog PD07/08 |
| 947115 | CTD or STD cast | 2008-03-14 11:31:00 | 53.52933 N, 3.35117 W | RV Prince Madog PD07/08 |
| 947244 | CTD or STD cast | 2008-04-16 09:26:00 | 53.53067 N, 3.363 W | RV Prince Madog PD09/08 |
| 772294 | Hydrography time series at depth | 2008-04-16 10:40:00 | 53.53367 N, 3.362 W | RV Prince Madog PD09/08 |
| 772313 | Hydrography time series at depth | 2008-04-16 10:40:00 | 53.53367 N, 3.362 W | RV Prince Madog PD09/08 |
| 772337 | Hydrography time series at depth | 2008-04-16 10:40:00 | 53.53367 N, 3.362 W | RV Prince Madog PD09/08 |
| 772349 | Hydrography time series at depth | 2008-04-16 10:40:00 | 53.53367 N, 3.362 W | RV Prince Madog PD09/08 |
| 1082229 | Fluorescence or pigments | 2008-04-16 11:00:00 | 53.53 N, 3.36 W | RV Prince Madog PD09/08 |
| 1082162 | Hydrography time series at depth | 2008-04-16 11:00:00 | 53.53 N, 3.36 W | RV Prince Madog PD09/08 |
| 1082426 | PAR radiance and irradiance | 2008-04-16 11:00:00 | 53.53 N, 3.36 W | RV Prince Madog PD09/08 |
| 1082555 | PAR radiance and irradiance | 2008-04-16 11:00:00 | 53.53 N, 3.36 W | RV Prince Madog PD09/08 |
| 1082242 | Transmittance/attenuance, turbidity, or SPM conc. | 2008-04-16 11:00:00 | 53.53 N, 3.36 W | RV Prince Madog PD09/08 |
| 1082383 | Water column chemistry | 2008-04-16 11:00:00 | 53.53 N, 3.36 W | RV Prince Madog PD09/08 |
| 1082402 | Water column chemistry | 2008-04-16 11:00:00 | 53.53 N, 3.36 W | RV Prince Madog PD09/08 |
| 947256 | CTD or STD cast | 2008-04-16 13:32:00 | 53.53767 N, 3.35917 W | RV Prince Madog PD09/08 |
| 772270 | Hydrography time series at depth | 2008-04-16 13:40:03 | 53.53367 N, 3.35683 W | RV Prince Madog PD09/08 |
| 1082518 | Water column chemistry | 2008-04-17 00:00:00 | 53.53 N, 3.36 W | RV Prince Madog PD09/08 |
| 947441 | CTD or STD cast | 2008-05-13 12:09:00 | 53.53633 N, 3.3625 W | RV Prince Madog PD14/08 |
| 838319 | Hydrography time series at depth | 2008-05-13 13:40:00 | 53.53433 N, 3.357 W | RV Prince Madog PD14/08 |
| 838332 | Hydrography time series at depth | 2008-05-13 13:40:00 | 53.53433 N, 3.357 W | RV Prince Madog PD14/08 |
| 838356 | Hydrography time series at depth | 2008-05-13 13:50:00 | 53.53433 N, 3.357 W | RV Prince Madog PD14/08 |
| 838368 | Hydrography time series at depth | 2008-05-13 13:50:00 | 53.53433 N, 3.357 W | RV Prince Madog PD14/08 |
| 1082230 | Fluorescence or pigments | 2008-05-13 14:00:00 | 53.53 N, 3.36 W | RV Prince Madog PD14/08 |
| 1082174 | Hydrography time series at depth | 2008-05-13 14:00:00 | 53.53 N, 3.36 W | RV Prince Madog PD14/08 |
| 1082438 | PAR radiance and irradiance | 2008-05-13 14:00:00 | 53.53 N, 3.36 W | RV Prince Madog PD14/08 |
| 1082567 | PAR radiance and irradiance | 2008-05-13 14:00:00 | 53.53 N, 3.36 W | RV Prince Madog PD14/08 |
| 1082254 | Transmittance/attenuance, turbidity, or SPM conc. | 2008-05-13 14:00:00 | 53.53 N, 3.36 W | RV Prince Madog PD14/08 |
| 1082414 | Water column chemistry | 2008-05-13 14:00:00 | 53.53 N, 3.36 W | RV Prince Madog PD14/08 |
| 947453 | CTD or STD cast | 2008-05-13 14:13:00 | 53.53183 N, 3.3505 W | RV Prince Madog PD14/08 |
| 1082395 | Water column chemistry | 2008-05-13 14:30:00 | 53.53 N, 3.36 W | RV Prince Madog PD14/08 |
| 947465 | CTD or STD cast | 2008-05-13 16:02:00 | 53.53783 N, 3.34667 W | RV Prince Madog PD14/08 |
| 947477 | CTD or STD cast | 2008-05-13 16:31:00 | 53.53733 N, 3.3465 W | RV Prince Madog PD14/08 |
| 947489 | CTD or STD cast | 2008-05-13 17:03:00 | 53.537 N, 3.34717 W | RV Prince Madog PD14/08 |
| 947490 | CTD or STD cast | 2008-05-13 17:31:00 | 53.53717 N, 3.34817 W | RV Prince Madog PD14/08 |
| 947508 | CTD or STD cast | 2008-05-13 18:05:00 | 53.53717 N, 3.34817 W | RV Prince Madog PD14/08 |
| 947521 | CTD or STD cast | 2008-05-13 18:32:00 | 53.53717 N, 3.34833 W | RV Prince Madog PD14/08 |
| 947533 | CTD or STD cast | 2008-05-13 19:02:00 | 53.53717 N, 3.34833 W | RV Prince Madog PD14/08 |
| 947545 | CTD or STD cast | 2008-05-13 19:30:00 | 53.53733 N, 3.34833 W | RV Prince Madog PD14/08 |
| 947557 | CTD or STD cast | 2008-05-13 20:04:00 | 53.53733 N, 3.34833 W | RV Prince Madog PD14/08 |
| 947569 | CTD or STD cast | 2008-05-13 20:33:00 | 53.53733 N, 3.3485 W | RV Prince Madog PD14/08 |
| 947570 | CTD or STD cast | 2008-05-13 21:02:00 | 53.5375 N, 3.34833 W | RV Prince Madog PD14/08 |
| 947582 | CTD or STD cast | 2008-05-13 21:32:00 | 53.5375 N, 3.3485 W | RV Prince Madog PD14/08 |
| 947594 | CTD or STD cast | 2008-05-13 22:01:00 | 53.5375 N, 3.3485 W | RV Prince Madog PD14/08 |
| 947601 | CTD or STD cast | 2008-05-13 22:30:00 | 53.5375 N, 3.34833 W | RV Prince Madog PD14/08 |
| 947613 | CTD or STD cast | 2008-05-13 23:01:00 | 53.5375 N, 3.3485 W | RV Prince Madog PD14/08 |
| 947625 | CTD or STD cast | 2008-05-13 23:33:00 | 53.5375 N, 3.3485 W | RV Prince Madog PD14/08 |
| 947637 | CTD or STD cast | 2008-05-14 00:00:00 | 53.5375 N, 3.3485 W | RV Prince Madog PD14/08 |
| 947649 | CTD or STD cast | 2008-05-14 00:29:00 | 53.5375 N, 3.3485 W | RV Prince Madog PD14/08 |
| 947650 | CTD or STD cast | 2008-05-14 01:03:00 | 53.53733 N, 3.3485 W | RV Prince Madog PD14/08 |
| 947662 | CTD or STD cast | 2008-05-14 01:32:00 | 53.53733 N, 3.34833 W | RV Prince Madog PD14/08 |
| 947674 | CTD or STD cast | 2008-05-14 02:03:00 | 53.53717 N, 3.34817 W | RV Prince Madog PD14/08 |
| 947686 | CTD or STD cast | 2008-05-14 02:31:00 | 53.53733 N, 3.34833 W | RV Prince Madog PD14/08 |
| 947698 | CTD or STD cast | 2008-05-14 03:02:00 | 53.537 N, 3.34783 W | RV Prince Madog PD14/08 |
| 947705 | CTD or STD cast | 2008-05-14 03:30:00 | 53.537 N, 3.34733 W | RV Prince Madog PD14/08 |
| 947717 | CTD or STD cast | 2008-05-14 04:01:00 | 53.53717 N, 3.34717 W | RV Prince Madog PD14/08 |
| 947729 | CTD or STD cast | 2008-05-14 04:28:00 | 53.537 N, 3.3475 W | RV Prince Madog PD14/08 |
| 947730 | CTD or STD cast | 2008-05-14 05:01:00 | 53.53717 N, 3.348 W | RV Prince Madog PD14/08 |
| 947742 | CTD or STD cast | 2008-05-14 05:46:00 | 53.53733 N, 3.34833 W | RV Prince Madog PD14/08 |
| 947754 | CTD or STD cast | 2008-05-14 06:02:00 | 53.53733 N, 3.34833 W | RV Prince Madog PD14/08 |
| 947766 | CTD or STD cast | 2008-05-14 06:28:00 | 53.53717 N, 3.34833 W | RV Prince Madog PD14/08 |
| 947778 | CTD or STD cast | 2008-05-14 07:04:00 | 53.53733 N, 3.34833 W | RV Prince Madog PD14/08 |
| 947791 | CTD or STD cast | 2008-05-14 07:29:00 | 53.53733 N, 3.34833 W | RV Prince Madog PD14/08 |
| 947809 | CTD or STD cast | 2008-05-14 08:00:00 | 53.53733 N, 3.34833 W | RV Prince Madog PD14/08 |
| 947810 | CTD or STD cast | 2008-05-14 08:31:00 | 53.53733 N, 3.34833 W | RV Prince Madog PD14/08 |
| 947822 | CTD or STD cast | 2008-05-14 09:01:00 | 53.5375 N, 3.34833 W | RV Prince Madog PD14/08 |
| 947834 | CTD or STD cast | 2008-05-14 09:34:00 | 53.53767 N, 3.34833 W | RV Prince Madog PD14/08 |
| 947846 | CTD or STD cast | 2008-05-14 10:00:00 | 53.53767 N, 3.34833 W | RV Prince Madog PD14/08 |
| 947858 | CTD or STD cast | 2008-05-14 10:28:00 | 53.53767 N, 3.34833 W | RV Prince Madog PD14/08 |
| 947871 | CTD or STD cast | 2008-05-14 11:01:00 | 53.53767 N, 3.34833 W | RV Prince Madog PD14/08 |
| 947883 | CTD or STD cast | 2008-05-14 11:31:00 | 53.53783 N, 3.34817 W | RV Prince Madog PD14/08 |
| 947895 | CTD or STD cast | 2008-05-14 12:02:00 | 53.53783 N, 3.34817 W | RV Prince Madog PD14/08 |
| 947902 | CTD or STD cast | 2008-05-14 12:32:00 | 53.53783 N, 3.34817 W | RV Prince Madog PD14/08 |
| 947914 | CTD or STD cast | 2008-05-14 13:03:00 | 53.53783 N, 3.34783 W | RV Prince Madog PD14/08 |
| 947926 | CTD or STD cast | 2008-05-14 13:33:00 | 53.53783 N, 3.34783 W | RV Prince Madog PD14/08 |
| 947938 | CTD or STD cast | 2008-05-14 14:02:00 | 53.5375 N, 3.34733 W | RV Prince Madog PD14/08 |
| 947951 | CTD or STD cast | 2008-05-14 14:37:00 | 53.53767 N, 3.34717 W | RV Prince Madog PD14/08 |
| 947963 | CTD or STD cast | 2008-05-14 15:03:00 | 53.53733 N, 3.34717 W | RV Prince Madog PD14/08 |
| 947975 | CTD or STD cast | 2008-05-14 15:32:00 | 53.5375 N, 3.3465 W | RV Prince Madog PD14/08 |
| 947987 | CTD or STD cast | 2008-05-14 16:03:00 | 53.53767 N, 3.3465 W | RV Prince Madog PD14/08 |
| 947999 | CTD or STD cast | 2008-05-14 16:33:00 | 53.5375 N, 3.3465 W | RV Prince Madog PD14/08 |
| 948002 | CTD or STD cast | 2008-05-14 17:05:00 | 53.53733 N, 3.3465 W | RV Prince Madog PD14/08 |
| 948118 | CTD or STD cast | 2008-05-15 03:16:00 | 53.5315 N, 3.36167 W | RV Prince Madog PD14/08 |
| 838288 | Hydrography time series at depth | 2008-05-15 13:30:03 | 53.53467 N, 3.35883 W | RV Prince Madog PD14/08 |
| 1082531 | Water column chemistry | 2008-05-18 00:00:00 | 53.53 N, 3.36 W | RV Prince Madog PD14/08 |
| 948500 | CTD or STD cast | 2008-06-25 10:49:00 | 53.5325 N, 3.35483 W | RV Prince Madog PD19/08 |
| 948745 | CTD or STD cast | 2008-06-26 07:34:00 | 53.53367 N, 3.356 W | RV Prince Madog PD19/08 |
| 949238 | CTD or STD cast | 2008-07-30 09:39:00 | 53.53583 N, 3.36283 W | RV Prince Madog PD23/08 |
| 1024583 | Fluorescence or pigments | 2008-07-30 12:30:00 | 53.53 N, 3.36 W | RV Prince Madog PD23/08 |
| 1024779 | PAR radiance and irradiance | 2008-07-30 12:30:00 | 53.53 N, 3.36 W | RV Prince Madog PD23/08 |
| 1024811 | PAR radiance and irradiance | 2008-07-30 12:30:00 | 53.53 N, 3.36 W | RV Prince Madog PD23/08 |
| 1024509 | Surface temp/sal | 2008-07-30 12:30:00 | 53.53 N, 3.36 W | RV Prince Madog PD23/08 |
| 1024663 | Transmittance/attenuance, turbidity, or SPM conc. | 2008-07-30 12:30:00 | 53.53 N, 3.36 W | RV Prince Madog PD23/08 |
| 1024743 | Water column chemistry | 2008-07-30 12:30:00 | 53.53 N, 3.36 W | RV Prince Madog PD23/08 |
| 949251 | CTD or STD cast | 2008-07-30 15:23:00 | 53.53867 N, 3.36367 W | RV Prince Madog PD23/08 |
| 949367 | CTD or STD cast | 2008-07-30 23:30:00 | 53.53333 N, 3.36983 W | RV Prince Madog PD23/08 |
| 857907 | Hydrography time series at depth | 2008-07-31 06:00:00 | 53.534 N, 3.36333 W | RV Prince Madog PD23/08 |
| 857932 | Hydrography time series at depth | 2008-07-31 06:00:02 | 53.534 N, 3.36333 W | RV Prince Madog PD23/08 |
| 857888 | Hydrography time series at depth | 2008-07-31 06:00:03 | 53.535 N, 3.35933 W | RV Prince Madog PD23/08 |
| 939220 | Hydrography time series at depth | 2008-09-10 11:30:03 | 53.53517 N, 3.35933 W | RV Prince Madog PD29/08 |
| 1024595 | Fluorescence or pigments | 2008-09-10 12:00:00 | 53.5342 N, 3.3596 W | RV Prince Madog PD29/08 |
| 939256 | Hydrography time series at depth | 2008-09-10 12:00:00 | 53.53483 N, 3.3605 W | RV Prince Madog PD29/08 |
| 939268 | Hydrography time series at depth | 2008-09-10 12:00:00 | 53.53483 N, 3.3605 W | RV Prince Madog PD29/08 |
| 939281 | Hydrography time series at depth | 2008-09-10 12:00:00 | 53.53483 N, 3.3605 W | RV Prince Madog PD29/08 |
| 939293 | Hydrography time series at depth | 2008-09-10 12:00:00 | 53.53483 N, 3.3605 W | RV Prince Madog PD29/08 |
| 1024780 | PAR radiance and irradiance | 2008-09-10 12:00:00 | 53.5342 N, 3.3596 W | RV Prince Madog PD29/08 |
| 1024823 | PAR radiance and irradiance | 2008-09-10 12:00:00 | 53.5342 N, 3.3596 W | RV Prince Madog PD29/08 |
| 1024510 | Surface temp/sal | 2008-09-10 12:00:00 | 53.5342 N, 3.3596 W | RV Prince Madog PD29/08 |
| 1024675 | Transmittance/attenuance, turbidity, or SPM conc. | 2008-09-10 12:00:00 | 53.5342 N, 3.3596 W | RV Prince Madog PD29/08 |
| 1024755 | Water column chemistry | 2008-09-10 12:00:00 | 53.5342 N, 3.3596 W | RV Prince Madog PD29/08 |
| 1024847 | Water column chemistry | 2008-09-10 13:39:00 | 53.5342 N, 3.3596 W | RV Prince Madog PD29/08 |
| 1024860 | Water column chemistry | 2008-09-11 00:00:00 | 53.5342 N, 3.3596 W | RV Prince Madog PD29/08 |
| 949668 | CTD or STD cast | 2008-10-22 14:50:00 | 53.53567 N, 3.36267 W | RV Prince Madog PD33/08 |
| 805455 | Hydrography time series at depth | 2008-10-22 16:30:03 | 53.5345 N, 3.35583 W | RV Prince Madog PD33/08 |
| 808730 | Hydrography time series at depth | 2008-10-22 16:30:12 | 53.5345 N, 3.35583 W | RV Prince Madog PD33/08 |
| 949681 | CTD or STD cast | 2008-10-22 16:39:00 | 53.53167 N, 3.35283 W | RV Prince Madog PD33/08 |
| 949889 | CTD or STD cast | 2008-12-10 13:17:00 | 53.5315 N, 3.36217 W | RV Prince Madog PD37/08 |
| 1022877 | Hydrography time series at depth | 2008-12-10 16:20:03 | 53.5335 N, 3.3575 W | RV Prince Madog PD37/08 |
| 1022889 | Hydrography time series at depth | 2008-12-10 16:20:12 | 53.5335 N, 3.3575 W | RV Prince Madog PD37/08 |
| 949890 | CTD or STD cast | 2008-12-10 16:21:00 | 53.53067 N, 3.35783 W | RV Prince Madog PD37/08 |
| 950092 | CTD or STD cast | 2008-12-11 08:24:00 | 53.53767 N, 3.3635 W | RV Prince Madog PD37/08 |
| 1022945 | Hydrography time series at depth | 2008-12-11 08:50:00 | 53.537 N, 3.357 W | RV Prince Madog PD37/08 |
| 1022957 | Hydrography time series at depth | 2008-12-11 08:50:00 | 53.537 N, 3.357 W | RV Prince Madog PD37/08 |
| 1022890 | Hydrography time series at depth | 2008-12-11 08:50:01 | 53.537 N, 3.357 W | RV Prince Madog PD37/08 |
| 1022933 | Hydrography time series at depth | 2008-12-11 08:50:01 | 53.537 N, 3.357 W | RV Prince Madog PD37/08 |
| 1024602 | Fluorescence or pigments | 2008-12-11 09:00:00 | 53.5369 N, 3.3571 W | RV Prince Madog PD37/08 |
| 1024792 | PAR radiance and irradiance | 2008-12-11 09:00:00 | 53.5369 N, 3.3571 W | RV Prince Madog PD37/08 |
| 1024835 | PAR radiance and irradiance | 2008-12-11 09:00:00 | 53.5369 N, 3.3571 W | RV Prince Madog PD37/08 |
| 1024522 | Surface temp/sal | 2008-12-11 09:00:00 | 53.5369 N, 3.3571 W | RV Prince Madog PD37/08 |
| 1024687 | Transmittance/attenuance, turbidity, or SPM conc. | 2008-12-11 09:00:00 | 53.5369 N, 3.3571 W | RV Prince Madog PD37/08 |
| 1024767 | Water column chemistry | 2008-12-11 09:00:00 | 53.5369 N, 3.3571 W | RV Prince Madog PD37/08 |
| 950111 | CTD or STD cast | 2008-12-11 09:30:00 | 53.53417 N, 3.35667 W | RV Prince Madog PD37/08 |
| 1024859 | Water column chemistry | 2008-12-11 10:10:00 | 53.5369 N, 3.3571 W | RV Prince Madog PD37/08 |
| 950203 | CTD or STD cast | 2009-02-05 08:36:00 | 53.53417 N, 3.35617 W | RV Prince Madog PD02/09B |
| 1048388 | Hydrography time series at depth | 2009-02-05 10:00:03 | 53.53333 N, 3.35783 W | RV Prince Madog PD02/09B |
| 1048407 | Hydrography time series at depth | 2009-02-05 10:00:12 | 53.53333 N, 3.35783 W | RV Prince Madog PD02/09B |
| 1075767 | Fluorescence or pigments | 2009-02-05 10:30:00 | 53.5335 N, 3.3614 W | RV Prince Madog PD02/09B |
| 1048419 | Hydrography time series at depth | 2009-02-05 10:30:00 | 53.5335 N, 3.36133 W | RV Prince Madog PD02/09B |
| 1048420 | Hydrography time series at depth | 2009-02-05 10:30:00 | 53.5335 N, 3.36133 W | RV Prince Madog PD02/09B |
| 1048456 | Hydrography time series at depth | 2009-02-05 10:30:00 | 53.5335 N, 3.36133 W | RV Prince Madog PD02/09B |
| 1048468 | Hydrography time series at depth | 2009-02-05 10:30:00 | 53.5335 N, 3.36133 W | RV Prince Madog PD02/09B |
| 1075350 | Hydrography time series at depth | 2009-02-05 10:30:00 | 53.5335 N, 3.3614 W | RV Prince Madog PD02/09B |
| 1076470 | PAR radiance and irradiance | 2009-02-05 10:30:00 | 53.5335 N, 3.3614 W | RV Prince Madog PD02/09B |
| 1076863 | PAR radiance and irradiance | 2009-02-05 10:30:00 | 53.5335 N, 3.3614 W | RV Prince Madog PD02/09B |
| 1075927 | Transmittance/attenuance, turbidity, or SPM conc. | 2009-02-05 10:30:00 | 53.5335 N, 3.3614 W | RV Prince Madog PD02/09B |
| 1076261 | Water column chemistry | 2009-02-05 10:30:00 | 53.5335 N, 3.3614 W | RV Prince Madog PD02/09B |
| 950589 | CTD or STD cast | 2009-02-05 10:57:00 | 53.53533 N, 3.36717 W | RV Prince Madog PD02/09B |
| 1076144 | Water column chemistry | 2009-02-05 12:09:00 | 53.5335 N, 3.3614 W | RV Prince Madog PD02/09B |
| 950461 | CTD or STD cast | 2009-02-06 07:29:00 | 53.53133 N, 3.3595 W | RV Prince Madog PD02/09B |
| 951218 | CTD or STD cast | 2009-04-01 06:22:00 | 53.54033 N, 3.35267 W | RV Prince Madog PD12/09 |
| 1075779 | Fluorescence or pigments | 2009-04-01 09:00:00 | 53.5328 N, 3.3648 W | RV Prince Madog PD12/09 |
| 1075362 | Hydrography time series at depth | 2009-04-01 09:00:00 | 53.5328 N, 3.3648 W | RV Prince Madog PD12/09 |
| 1076482 | PAR radiance and irradiance | 2009-04-01 09:00:00 | 53.5328 N, 3.3648 W | RV Prince Madog PD12/09 |
| 1076709 | PAR radiance and irradiance | 2009-04-01 09:00:00 | 53.5328 N, 3.3648 W | RV Prince Madog PD12/09 |
| 1075939 | Transmittance/attenuance, turbidity, or SPM conc. | 2009-04-01 09:00:00 | 53.5328 N, 3.3648 W | RV Prince Madog PD12/09 |
| 1076273 | Water column chemistry | 2009-04-01 09:00:00 | 53.5328 N, 3.3648 W | RV Prince Madog PD12/09 |
| 951231 | CTD or STD cast | 2009-04-01 09:08:00 | 53.53483 N, 3.36433 W | RV Prince Madog PD12/09 |
| 1076156 | Water column chemistry | 2009-04-01 09:40:00 | 53.5328 N, 3.3648 W | RV Prince Madog PD12/09 |
| 951488 | CTD or STD cast | 2009-04-02 05:32:00 | 53.53217 N, 3.366 W | RV Prince Madog PD12/09 |
| 953495 | CTD or STD cast | 2009-05-12 05:21:00 | 53.53733 N, 3.3665 W | RV Prince Madog PD18/09 |
| 1075780 | Fluorescence or pigments | 2009-05-12 08:30:00 | 53.5332 N, 3.3605 W | RV Prince Madog PD18/09 |
| 1075374 | Hydrography time series at depth | 2009-05-12 08:30:00 | 53.5332 N, 3.3605 W | RV Prince Madog PD18/09 |
| 1076494 | PAR radiance and irradiance | 2009-05-12 08:30:00 | 53.5332 N, 3.3605 W | RV Prince Madog PD18/09 |
| 1076710 | PAR radiance and irradiance | 2009-05-12 08:30:00 | 53.5332 N, 3.3605 W | RV Prince Madog PD18/09 |
| 1076617 | Transmittance/attenuance, turbidity, or SPM conc. | 2009-05-12 08:30:00 | 53.5332 N, 3.3605 W | RV Prince Madog PD18/09 |
| 1076285 | Water column chemistry | 2009-05-12 08:30:00 | 53.5332 N, 3.3605 W | RV Prince Madog PD18/09 |
| 953502 | CTD or STD cast | 2009-05-12 09:53:00 | 53.5305 N, 3.3575 W | RV Prince Madog PD18/09 |
| 1076408 | Water column chemistry | 2009-05-13 00:00:00 | 53.5332 N, 3.3605 W | RV Prince Madog PD18/09 |
| 953784 | CTD or STD cast | 2009-05-13 09:39:00 | 53.53717 N, 3.36067 W | RV Prince Madog PD18/09 |
| 1076168 | Water column chemistry | 2009-05-24 18:09:00 | 53.5332 N, 3.3605 W | RV Prince Madog PD18/09 |
| 1022982 | CTD or STD cast | 2009-06-17 07:10:00 | 53.53883 N, 3.359 W | RV Prince Madog PD24/09 |
| 1075792 | Fluorescence or pigments | 2009-06-17 08:30:00 | 53.534 N, 3.3595 W | RV Prince Madog PD24/09 |
| 1075386 | Hydrography time series at depth | 2009-06-17 08:30:00 | 53.534 N, 3.3595 W | RV Prince Madog PD24/09 |
| 1076501 | PAR radiance and irradiance | 2009-06-17 08:30:00 | 53.534 N, 3.3595 W | RV Prince Madog PD24/09 |
| 1076722 | PAR radiance and irradiance | 2009-06-17 08:30:00 | 53.534 N, 3.3595 W | RV Prince Madog PD24/09 |
| 1075940 | Transmittance/attenuance, turbidity, or SPM conc. | 2009-06-17 08:30:00 | 53.534 N, 3.3595 W | RV Prince Madog PD24/09 |
| 1076297 | Water column chemistry | 2009-06-17 08:30:00 | 53.534 N, 3.3595 W | RV Prince Madog PD24/09 |
| 1022994 | CTD or STD cast | 2009-06-17 08:35:00 | 53.53633 N, 3.36183 W | RV Prince Madog PD24/09 |
| 1023008 | CTD or STD cast | 2009-06-17 09:27:00 | 53.53533 N, 3.362 W | RV Prince Madog PD24/09 |
| 1023125 | CTD or STD cast | 2009-06-17 19:57:00 | 53.5355 N, 3.3635 W | RV Prince Madog PD24/09 |
| 1076421 | Water column chemistry | 2009-06-18 00:00:00 | 53.534 N, 3.3595 W | RV Prince Madog PD24/09 |
| 1023402 | CTD or STD cast | 2009-08-03 05:18:00 | 53.53767 N, 3.35433 W | RV Prince Madog PD33/09 |
| 1075811 | Fluorescence or pigments | 2009-08-03 07:30:00 | 53.534 N, 3.3637 W | RV Prince Madog PD33/09 |
| 1075398 | Hydrography time series at depth | 2009-08-03 07:30:00 | 53.534 N, 3.3637 W | RV Prince Madog PD33/09 |
| 1076513 | PAR radiance and irradiance | 2009-08-03 07:30:00 | 53.534 N, 3.3637 W | RV Prince Madog PD33/09 |
| 1076734 | PAR radiance and irradiance | 2009-08-03 07:30:00 | 53.534 N, 3.3637 W | RV Prince Madog PD33/09 |
| 1075952 | Transmittance/attenuance, turbidity, or SPM conc. | 2009-08-03 07:30:00 | 53.534 N, 3.3637 W | RV Prince Madog PD33/09 |
| 1076304 | Water column chemistry | 2009-08-03 07:30:00 | 53.534 N, 3.3637 W | RV Prince Madog PD33/09 |
| 1023414 | CTD or STD cast | 2009-08-03 07:54:00 | 53.53617 N, 3.35683 W | RV Prince Madog PD33/09 |
| 1023438 | CTD or STD cast | 2009-08-03 09:21:00 | 53.53583 N, 3.3605 W | RV Prince Madog PD33/09 |
| 1076181 | Water column chemistry | 2009-08-06 18:00:00 | 53.534 N, 3.3637 W | RV Prince Madog PD33/09 |
| 1024097 | CTD or STD cast | 2009-09-15 08:03:00 | 53.53133 N, 3.35783 W | RV Prince Madog PD38/09 |
| 1075823 | Fluorescence or pigments | 2009-09-15 09:30:00 | 53.5337 N, 3.3597 W | RV Prince Madog PD38/09 |
| 1075405 | Hydrography time series at depth | 2009-09-15 09:30:00 | 53.5337 N, 3.3597 W | RV Prince Madog PD38/09 |
| 1076525 | PAR radiance and irradiance | 2009-09-15 09:30:00 | 53.5337 N, 3.3597 W | RV Prince Madog PD38/09 |
| 1076746 | PAR radiance and irradiance | 2009-09-15 09:30:00 | 53.5337 N, 3.3597 W | RV Prince Madog PD38/09 |
| 1075964 | Transmittance/attenuance, turbidity, or SPM conc. | 2009-09-15 09:30:00 | 53.5337 N, 3.3597 W | RV Prince Madog PD38/09 |
| 1076678 | Water column chemistry | 2009-09-15 09:30:00 | 53.5337 N, 3.3597 W | RV Prince Madog PD38/09 |
| 1024104 | CTD or STD cast | 2009-09-15 09:41:00 | 53.53167 N, 3.359 W | RV Prince Madog PD38/09 |
| 1076193 | Water column chemistry | 2009-09-15 20:00:00 | 53.5337 N, 3.3597 W | RV Prince Madog PD38/09 |
| 1024362 | CTD or STD cast | 2009-09-16 05:56:00 | 53.53267 N, 3.35717 W | RV Prince Madog PD38/09 |
| 1030299 | CTD or STD cast | 2009-12-02 11:47:00 | 53.53233 N, 3.363 W | RV Prince Madog PD47/09 |
| 1075835 | Fluorescence or pigments | 2009-12-02 13:00:00 | 53.5342 N, 3.3638 W | RV Prince Madog PD47/09 |
| 1075417 | Hydrography time series at depth | 2009-12-02 13:00:00 | 53.5342 N, 3.3638 W | RV Prince Madog PD47/09 |
| 1076537 | PAR radiance and irradiance | 2009-12-02 13:00:00 | 53.5342 N, 3.3638 W | RV Prince Madog PD47/09 |
| 1076758 | PAR radiance and irradiance | 2009-12-02 13:00:00 | 53.5342 N, 3.3638 W | RV Prince Madog PD47/09 |
| 1075976 | Transmittance/attenuance, turbidity, or SPM conc. | 2009-12-02 13:00:00 | 53.5342 N, 3.3638 W | RV Prince Madog PD47/09 |
| 1076316 | Water column chemistry | 2009-12-02 13:00:00 | 53.5342 N, 3.3638 W | RV Prince Madog PD47/09 |
| 1030306 | CTD or STD cast | 2009-12-02 13:36:00 | 53.53583 N, 3.36717 W | RV Prince Madog PD47/09 |
| 1076433 | Water column chemistry | 2009-12-03 00:00:00 | 53.5342 N, 3.3638 W | RV Prince Madog PD47/09 |
| 1030367 | CTD or STD cast | 2010-01-26 08:50:00 | 53.53333 N, 3.36367 W | RV Prince Madog PD02/10 |
| 1075847 | Fluorescence or pigments | 2010-01-26 10:00:00 | 53.5332 N, 3.362 W | RV Prince Madog PD02/10 |
| 1075429 | Hydrography time series at depth | 2010-01-26 10:00:00 | 53.5332 N, 3.362 W | RV Prince Madog PD02/10 |
| 1076549 | PAR radiance and irradiance | 2010-01-26 10:00:00 | 53.5332 N, 3.362 W | RV Prince Madog PD02/10 |
| 1076771 | PAR radiance and irradiance | 2010-01-26 10:00:00 | 53.5332 N, 3.362 W | RV Prince Madog PD02/10 |
| 1075988 | Transmittance/attenuance, turbidity, or SPM conc. | 2010-01-26 10:00:00 | 53.5332 N, 3.362 W | RV Prince Madog PD02/10 |
| 1076328 | Water column chemistry | 2010-01-26 10:00:00 | 53.5332 N, 3.362 W | RV Prince Madog PD02/10 |
| 1030379 | CTD or STD cast | 2010-01-26 10:18:00 | 53.5345 N, 3.36683 W | RV Prince Madog PD02/10 |
| 1030540 | CTD or STD cast | 2010-01-27 04:00:00 | 53.5365 N, 3.35483 W | RV Prince Madog PD02/10 |
| 1038290 | CTD or STD cast | 2010-03-17 12:36:00 | 53.53167 N, 3.34967 W | RV Prince Madog PD05/10 |
| 1075859 | Fluorescence or pigments | 2010-03-17 13:30:00 | 53.5323 N, 3.3638 W | RV Prince Madog PD05/10 |
| 1075430 | Hydrography time series at depth | 2010-03-17 13:30:00 | 53.5323 N, 3.3638 W | RV Prince Madog PD05/10 |
| 1076550 | PAR radiance and irradiance | 2010-03-17 13:30:00 | 53.5323 N, 3.3638 W | RV Prince Madog PD05/10 |
| 1076783 | PAR radiance and irradiance | 2010-03-17 13:30:00 | 53.5323 N, 3.3638 W | RV Prince Madog PD05/10 |
| 1076003 | Transmittance/attenuance, turbidity, or SPM conc. | 2010-03-17 13:30:00 | 53.5323 N, 3.3638 W | RV Prince Madog PD05/10 |
| 1076200 | Water column chemistry | 2010-03-17 13:30:00 | 53.5323 N, 3.3638 W | RV Prince Madog PD05/10 |
| 1076341 | Water column chemistry | 2010-03-17 13:30:00 | 53.5323 N, 3.3638 W | RV Prince Madog PD05/10 |
| 1038308 | CTD or STD cast | 2010-03-17 13:52:00 | 53.53467 N, 3.36917 W | RV Prince Madog PD05/10 |
| 1076445 | Water column chemistry | 2010-03-18 00:00:00 | 53.5323 N, 3.3638 W | RV Prince Madog PD05/10 |
| 1075860 | Fluorescence or pigments | 2010-04-28 12:30:00 | 53.533 N, 3.3632 W | RV Prince Madog PD10/10 |
| 1075442 | Hydrography time series at depth | 2010-04-28 12:30:00 | 53.533 N, 3.3632 W | RV Prince Madog PD10/10 |
| 1076562 | PAR radiance and irradiance | 2010-04-28 12:30:00 | 53.533 N, 3.3632 W | RV Prince Madog PD10/10 |
| 1076795 | PAR radiance and irradiance | 2010-04-28 12:30:00 | 53.533 N, 3.3632 W | RV Prince Madog PD10/10 |
| 1076015 | Transmittance/attenuance, turbidity, or SPM conc. | 2010-04-28 12:30:00 | 53.533 N, 3.3632 W | RV Prince Madog PD10/10 |
| 1076353 | Water column chemistry | 2010-04-28 12:30:00 | 53.533 N, 3.3632 W | RV Prince Madog PD10/10 |
| 1076457 | Water column chemistry | 2010-04-29 00:00:00 | 53.533 N, 3.3632 W | RV Prince Madog PD10/10 |
| 1076212 | Water column chemistry | 2010-04-29 18:00:00 | 53.533 N, 3.3632 W | RV Prince Madog PD10/10 |
| 1090383 | CTD or STD cast | 2010-06-09 09:10:00 | 53.53033 N, 3.34717 W | RV Prince Madog PD17/10 |
| 1075872 | Fluorescence or pigments | 2010-06-09 10:30:00 | 53.5343 N, 3.3637 W | RV Prince Madog PD17/10 |
| 1075454 | Hydrography time series at depth | 2010-06-09 10:30:00 | 53.5343 N, 3.3637 W | RV Prince Madog PD17/10 |
| 1076574 | PAR radiance and irradiance | 2010-06-09 10:30:00 | 53.5343 N, 3.3637 W | RV Prince Madog PD17/10 |
| 1076802 | PAR radiance and irradiance | 2010-06-09 10:30:00 | 53.5343 N, 3.3637 W | RV Prince Madog PD17/10 |
| 1076027 | Transmittance/attenuance, turbidity, or SPM conc. | 2010-06-09 10:30:00 | 53.5343 N, 3.3637 W | RV Prince Madog PD17/10 |
| 1076365 | Water column chemistry | 2010-06-09 10:30:00 | 53.5343 N, 3.3637 W | RV Prince Madog PD17/10 |
| 1090395 | CTD or STD cast | 2010-06-09 12:32:00 | 53.53317 N, 3.3675 W | RV Prince Madog PD17/10 |
| 1090715 | CTD or STD cast | 2010-06-10 20:13:00 | 53.5285 N, 3.36117 W | RV Prince Madog PD17/10 |
| 1090739 | CTD or STD cast | 2010-07-07 07:55:00 | 53.53233 N, 3.3515 W | RV Prince Madog PD21/10 |
| 1075884 | Fluorescence or pigments | 2010-07-07 10:00:00 | 53.5352 N, 3.3615 W | RV Prince Madog PD21/10 |
| 1075466 | Hydrography time series at depth | 2010-07-07 10:00:00 | 53.5352 N, 3.3615 W | RV Prince Madog PD21/10 |
| 1076586 | PAR radiance and irradiance | 2010-07-07 10:00:00 | 53.5352 N, 3.3615 W | RV Prince Madog PD21/10 |
| 1076814 | PAR radiance and irradiance | 2010-07-07 10:00:00 | 53.5352 N, 3.3615 W | RV Prince Madog PD21/10 |
| 1076039 | Transmittance/attenuance, turbidity, or SPM conc. | 2010-07-07 10:00:00 | 53.5352 N, 3.3615 W | RV Prince Madog PD21/10 |
| 1076377 | Water column chemistry | 2010-07-07 10:00:00 | 53.5352 N, 3.3615 W | RV Prince Madog PD21/10 |
| 1090740 | CTD or STD cast | 2010-07-07 10:15:00 | 53.534 N, 3.36317 W | RV Prince Madog PD21/10 |
| 1090868 | CTD or STD cast | 2010-07-07 19:58:00 | 53.53717 N, 3.35767 W | RV Prince Madog PD21/10 |
| 1112036 | CTD or STD cast | 2010-08-11 06:16:00 | 53.5355 N, 3.34933 W | RV Prince Madog PD29/10 |
| 1075896 | Fluorescence or pigments | 2010-08-11 08:00:00 | 53.5332 N, 3.3613 W | RV Prince Madog PD29/10 |
| 1075478 | Hydrography time series at depth | 2010-08-11 08:00:00 | 53.5332 N, 3.3613 W | RV Prince Madog PD29/10 |
| 1076598 | PAR radiance and irradiance | 2010-08-11 08:00:00 | 53.5332 N, 3.3613 W | RV Prince Madog PD29/10 |
| 1076826 | PAR radiance and irradiance | 2010-08-11 08:00:00 | 53.5332 N, 3.3613 W | RV Prince Madog PD29/10 |
| 1076040 | Transmittance/attenuance, turbidity, or SPM conc. | 2010-08-11 08:00:00 | 53.5332 N, 3.3613 W | RV Prince Madog PD29/10 |
| 1076389 | Water column chemistry | 2010-08-11 08:00:00 | 53.5332 N, 3.3613 W | RV Prince Madog PD29/10 |
| 1112048 | CTD or STD cast | 2010-08-11 09:05:00 | 53.53967 N, 3.3505 W | RV Prince Madog PD29/10 |
| 1076224 | Water column chemistry | 2010-08-11 16:30:00 | 53.5332 N, 3.3613 W | RV Prince Madog PD29/10 |
| 1076666 | Water column chemistry | 2010-08-12 00:00:00 | 53.5332 N, 3.3613 W | RV Prince Madog PD29/10 |
| 1112313 | CTD or STD cast | 2010-08-12 08:04:00 | 53.5305 N, 3.35517 W | RV Prince Madog PD29/10 |
| 1113906 | CTD or STD cast | 2010-09-28 06:10:00 | 53.53617 N, 3.36783 W | RV Prince Madog PD36/10 |
| 1075903 | Fluorescence or pigments | 2010-09-28 09:00:00 | 53.5335 N, 3.3637 W | RV Prince Madog PD36/10 |
| 1075491 | Hydrography time series at depth | 2010-09-28 09:00:00 | 53.5335 N, 3.3637 W | RV Prince Madog PD36/10 |
| 1076605 | PAR radiance and irradiance | 2010-09-28 09:00:00 | 53.5335 N, 3.3637 W | RV Prince Madog PD36/10 |
| 1076838 | PAR radiance and irradiance | 2010-09-28 09:00:00 | 53.5335 N, 3.3637 W | RV Prince Madog PD36/10 |
| 1076052 | Transmittance/attenuance, turbidity, or SPM conc. | 2010-09-28 09:00:00 | 53.5335 N, 3.3637 W | RV Prince Madog PD36/10 |
| 1076691 | Water column chemistry | 2010-09-28 09:00:00 | 53.5335 N, 3.3637 W | RV Prince Madog PD36/10 |
| 1113918 | CTD or STD cast | 2010-09-28 09:42:00 | 53.53467 N, 3.35883 W | RV Prince Madog PD36/10 |
| 1076236 | Water column chemistry | 2010-09-28 10:00:00 | 53.5335 N, 3.3637 W | RV Prince Madog PD36/10 |
| 1114184 | CTD or STD cast | 2010-09-29 05:41:00 | 53.5355 N, 3.36983 W | RV Prince Madog PD36/10 |
| 1075915 | Fluorescence or pigments | 2010-12-07 13:00:00 | 53.5345 N, 3.3573 W | RV Prince Madog PD49/10 |
| 1075509 | Hydrography time series at depth | 2010-12-07 13:00:00 | 53.5345 N, 3.3573 W | RV Prince Madog PD49/10 |
| 1076851 | PAR radiance and irradiance | 2010-12-07 13:00:00 | 53.5345 N, 3.3573 W | RV Prince Madog PD49/10 |
| 1076064 | Transmittance/attenuance, turbidity, or SPM conc. | 2010-12-07 13:00:00 | 53.5345 N, 3.3573 W | RV Prince Madog PD49/10 |
| 1076390 | Water column chemistry | 2010-12-07 13:00:00 | 53.5345 N, 3.3573 W | RV Prince Madog PD49/10 |
| 1076248 | Water column chemistry | 2010-12-07 16:00:00 | 53.5345 N, 3.3573 W | RV Prince Madog PD49/10 |
| 1141041 | CTD or STD cast | 2010-12-07 22:34:00 | 53.5295 N, 3.35817 W | RV Prince Madog PD49/10 |
| 1076469 | Water column chemistry | 2010-12-08 00:00:00 | 53.5345 N, 3.3573 W | RV Prince Madog PD49/10 |
| 1148802 | CTD or STD cast | 2011-01-12 08:07:00 | 53.539 N, 3.35117 W | RV Prince Madog PD01/11 |
| 1166440 | Hydrography time series at depth | 2011-01-12 09:30:00 | 53.5472 N, 3.361 W | RV Prince Madog PD01/11 |
| 1166476 | PAR radiance and irradiance | 2011-01-12 09:30:00 | 53.5472 N, 3.361 W | RV Prince Madog PD01/11 |
| 1166488 | PAR radiance and irradiance | 2011-01-12 09:30:00 | 53.5472 N, 3.361 W | RV Prince Madog PD01/11 |
| 1166452 | Transmittance/attenuance, turbidity, or SPM conc. | 2011-01-12 09:30:00 | 53.5472 N, 3.361 W | RV Prince Madog PD01/11 |
| 1166464 | Water column chemistry | 2011-01-12 09:30:00 | 53.5472 N, 3.361 W | RV Prince Madog PD01/11 |
| 1148814 | CTD or STD cast | 2011-01-12 09:49:00 | 53.53267 N, 3.35683 W | RV Prince Madog PD01/11 |
| 1166821 | Water column chemistry | 2011-01-13 00:00:00 | 53.5472 N, 3.361 W | RV Prince Madog PD01/11 |
| 1149092 | CTD or STD cast | 2011-01-13 10:47:00 | 53.5335 N, 3.3675 W | RV Prince Madog PD01/11 |
| 1149669 | CTD or STD cast | 2011-03-16 10:03:00 | 53.53083 N, 3.35233 W | RV Prince Madog PD07/11 |
| 1166507 | Hydrography time series at depth | 2011-03-16 11:30:00 | 53.5333 N, 3.3624 W | RV Prince Madog PD07/11 |
| 1166532 | PAR radiance and irradiance | 2011-03-16 11:30:00 | 53.5333 N, 3.3624 W | RV Prince Madog PD07/11 |
| 1166544 | PAR radiance and irradiance | 2011-03-16 11:30:00 | 53.5333 N, 3.3624 W | RV Prince Madog PD07/11 |
| 1166556 | PAR radiance and irradiance | 2011-03-16 11:30:00 | 53.5333 N, 3.3624 W | RV Prince Madog PD07/11 |
| 1166519 | Transmittance/attenuance, turbidity, or SPM conc. | 2011-03-16 11:30:00 | 53.5333 N, 3.3624 W | RV Prince Madog PD07/11 |
| 1166520 | Water column chemistry | 2011-03-16 11:30:00 | 53.5333 N, 3.3624 W | RV Prince Madog PD07/11 |
| 1149670 | CTD or STD cast | 2011-03-16 11:46:00 | 53.53567 N, 3.36083 W | RV Prince Madog PD07/11 |
| 1166833 | Water column chemistry | 2011-03-16 13:30:00 | 53.5333 N, 3.3624 W | RV Prince Madog PD07/11 |
| 1149971 | CTD or STD cast | 2011-03-17 10:41:00 | 53.53033 N, 3.365 W | RV Prince Madog PD07/11 |
| 1150136 | CTD or STD cast | 2011-03-18 16:29:00 | 53.53267 N, 3.36083 W | RV Prince Madog PD07/11 |
| 1116873 | CTD or STD cast | 2011-04-18 10:24:00 | 53.53283 N, 3.3575 W | RV Prince Madog PD11/11 |
| 1116885 | CTD or STD cast | 2011-04-18 12:39:00 | 53.534 N, 3.36783 W | RV Prince Madog PD11/11 |
| 1116897 | CTD or STD cast | 2011-04-18 13:00:00 | 53.53067 N, 3.359 W | RV Prince Madog PD11/11 |
| 1116904 | CTD or STD cast | 2011-04-18 13:33:00 | 53.53067 N, 3.36 W | RV Prince Madog PD11/11 |
| 1116916 | CTD or STD cast | 2011-04-18 14:01:00 | 53.53067 N, 3.36 W | RV Prince Madog PD11/11 |
| 1116928 | CTD or STD cast | 2011-04-18 14:34:00 | 53.53067 N, 3.36 W | RV Prince Madog PD11/11 |
| 1116941 | CTD or STD cast | 2011-04-18 15:00:00 | 53.53067 N, 3.36 W | RV Prince Madog PD11/11 |
| 1116977 | CTD or STD cast | 2011-04-18 15:34:00 | 53.53083 N, 3.36 W | RV Prince Madog PD11/11 |
| 1116989 | CTD or STD cast | 2011-04-18 16:01:00 | 53.53083 N, 3.35983 W | RV Prince Madog PD11/11 |
| 1116990 | CTD or STD cast | 2011-04-18 16:32:00 | 53.53083 N, 3.35983 W | RV Prince Madog PD11/11 |
| 1117004 | CTD or STD cast | 2011-04-18 17:02:00 | 53.53067 N, 3.35983 W | RV Prince Madog PD11/11 |
| 1117016 | CTD or STD cast | 2011-04-18 17:32:00 | 53.53083 N, 3.35983 W | RV Prince Madog PD11/11 |
| 1117028 | CTD or STD cast | 2011-04-18 18:02:00 | 53.53067 N, 3.35967 W | RV Prince Madog PD11/11 |
| 1117041 | CTD or STD cast | 2011-04-18 18:31:00 | 53.5305 N, 3.35867 W | RV Prince Madog PD11/11 |
| 1117053 | CTD or STD cast | 2011-04-18 19:02:00 | 53.53033 N, 3.35833 W | RV Prince Madog PD11/11 |
| 1117065 | CTD or STD cast | 2011-04-18 19:32:00 | 53.53033 N, 3.35717 W | RV Prince Madog PD11/11 |
| 1117077 | CTD or STD cast | 2011-04-18 20:01:00 | 53.5305 N, 3.3565 W | RV Prince Madog PD11/11 |
| 1117089 | CTD or STD cast | 2011-04-18 21:03:00 | 53.53 N, 3.35667 W | RV Prince Madog PD11/11 |
| 1117090 | CTD or STD cast | 2011-04-18 21:32:00 | 53.53033 N, 3.3565 W | RV Prince Madog PD11/11 |
| 1117108 | CTD or STD cast | 2011-04-18 22:02:00 | 53.53033 N, 3.35667 W | RV Prince Madog PD11/11 |
| 1117121 | CTD or STD cast | 2011-04-18 22:32:00 | 53.5305 N, 3.35667 W | RV Prince Madog PD11/11 |
| 1117133 | CTD or STD cast | 2011-04-18 23:04:00 | 53.53033 N, 3.35683 W | RV Prince Madog PD11/11 |
| 1117145 | CTD or STD cast | 2011-04-18 23:36:00 | 53.5305 N, 3.3575 W | RV Prince Madog PD11/11 |
| 1117201 | CTD or STD cast | 2011-04-19 00:03:00 | 53.53033 N, 3.35783 W | RV Prince Madog PD11/11 |
| 1117213 | CTD or STD cast | 2011-04-19 00:33:00 | 53.53033 N, 3.3585 W | RV Prince Madog PD11/11 |
| 1117225 | CTD or STD cast | 2011-04-19 01:00:00 | 53.53033 N, 3.35883 W | RV Prince Madog PD11/11 |
| 1117237 | CTD or STD cast | 2011-04-19 01:32:00 | 53.53017 N, 3.35917 W | RV Prince Madog PD11/11 |
| 1117249 | CTD or STD cast | 2011-04-19 03:34:00 | 53.53033 N, 3.35983 W | RV Prince Madog PD11/11 |
| 1117250 | CTD or STD cast | 2011-04-19 04:10:00 | 53.53033 N, 3.35983 W | RV Prince Madog PD11/11 |
| 1117262 | CTD or STD cast | 2011-04-19 04:34:00 | 53.5305 N, 3.35983 W | RV Prince Madog PD11/11 |
| 1117274 | CTD or STD cast | 2011-04-19 05:03:00 | 53.53033 N, 3.35983 W | RV Prince Madog PD11/11 |
| 1117286 | CTD or STD cast | 2011-04-19 05:32:00 | 53.53033 N, 3.35983 W | RV Prince Madog PD11/11 |
| 1117298 | CTD or STD cast | 2011-04-19 06:01:00 | 53.53 N, 3.35967 W | RV Prince Madog PD11/11 |
| 1117305 | CTD or STD cast | 2011-04-19 06:32:00 | 53.53017 N, 3.35967 W | RV Prince Madog PD11/11 |
| 1117317 | CTD or STD cast | 2011-04-19 07:02:00 | 53.53 N, 3.3585 W | RV Prince Madog PD11/11 |
| 1117329 | CTD or STD cast | 2011-04-19 07:32:00 | 53.53033 N, 3.358 W | RV Prince Madog PD11/11 |
| 1117330 | CTD or STD cast | 2011-04-19 08:01:00 | 53.5305 N, 3.3575 W | RV Prince Madog PD11/11 |
| 1117342 | CTD or STD cast | 2011-04-19 08:31:00 | 53.53067 N, 3.35683 W | RV Prince Madog PD11/11 |
| 1117354 | CTD or STD cast | 2011-04-19 10:00:00 | 53.5305 N, 3.3565 W | RV Prince Madog PD11/11 |
| 1166568 | Hydrography time series at depth | 2011-04-19 10:00:00 | 53.5342 N, 3.3619 W | RV Prince Madog PD11/11 |
| 1166600 | PAR radiance and irradiance | 2011-04-19 10:00:00 | 53.5342 N, 3.3619 W | RV Prince Madog PD11/11 |
| 1166612 | PAR radiance and irradiance | 2011-04-19 10:00:00 | 53.5342 N, 3.3619 W | RV Prince Madog PD11/11 |
| 1166624 | PAR radiance and irradiance | 2011-04-19 10:00:00 | 53.5342 N, 3.3619 W | RV Prince Madog PD11/11 |
| 1166581 | Transmittance/attenuance, turbidity, or SPM conc. | 2011-04-19 10:00:00 | 53.5342 N, 3.3619 W | RV Prince Madog PD11/11 |
| 1166593 | Water column chemistry | 2011-04-19 10:00:00 | 53.5342 N, 3.3619 W | RV Prince Madog PD11/11 |
| 1166857 | Water column chemistry | 2011-04-19 10:00:00 | 53.5342 N, 3.3619 W | RV Prince Madog PD11/11 |
| 1117366 | CTD or STD cast | 2011-04-19 10:32:00 | 53.5305 N, 3.3565 W | RV Prince Madog PD11/11 |
| 1117378 | CTD or STD cast | 2011-04-19 11:01:00 | 53.5305 N, 3.35667 W | RV Prince Madog PD11/11 |
| 1117391 | CTD or STD cast | 2011-04-19 11:33:00 | 53.53033 N, 3.357 W | RV Prince Madog PD11/11 |
| 1117409 | CTD or STD cast | 2011-04-19 12:03:00 | 53.53017 N, 3.35717 W | RV Prince Madog PD11/11 |
| 1117410 | CTD or STD cast | 2011-04-19 12:34:00 | 53.53033 N, 3.35833 W | RV Prince Madog PD11/11 |
| 1117422 | CTD or STD cast | 2011-04-19 13:04:00 | 53.5305 N, 3.35867 W | RV Prince Madog PD11/11 |
| 1117434 | CTD or STD cast | 2011-04-19 13:32:00 | 53.53067 N, 3.35933 W | RV Prince Madog PD11/11 |
| 1117446 | CTD or STD cast | 2011-04-19 14:00:00 | 53.52983 N, 3.36283 W | RV Prince Madog PD11/11 |
| 1117711 | CTD or STD cast | 2011-04-20 09:21:00 | 53.53583 N, 3.3575 W | RV Prince Madog PD11/11 |
| 1166845 | Water column chemistry | 2011-04-23 00:00:00 | 53.5342 N, 3.3619 W | RV Prince Madog PD11/11 |
| 1118486 | CTD or STD cast | 2011-06-06 08:31:00 | 53.532 N, 3.35767 W | RV Prince Madog PD43/11 |
| 1166636 | Hydrography time series at depth | 2011-06-06 10:00:00 | 53.5175 N, 3.3618 W | RV Prince Madog PD43/11 |
| 1166661 | PAR radiance and irradiance | 2011-06-06 10:00:00 | 53.5175 N, 3.3618 W | RV Prince Madog PD43/11 |
| 1166673 | PAR radiance and irradiance | 2011-06-06 10:00:00 | 53.5175 N, 3.3618 W | RV Prince Madog PD43/11 |
| 1166685 | PAR radiance and irradiance | 2011-06-06 10:00:00 | 53.5175 N, 3.3618 W | RV Prince Madog PD43/11 |
| 1166648 | Transmittance/attenuance, turbidity, or SPM conc. | 2011-06-06 10:00:00 | 53.5175 N, 3.3618 W | RV Prince Madog PD43/11 |
| 1166870 | Water column chemistry | 2011-06-06 10:00:00 | 53.5175 N, 3.3618 W | RV Prince Madog PD43/11 |
| 1118498 | CTD or STD cast | 2011-06-06 10:01:00 | 53.53167 N, 3.35783 W | RV Prince Madog PD43/11 |
| 1118658 | CTD or STD cast | 2011-06-06 22:58:00 | 53.537 N, 3.35817 W | RV Prince Madog PD43/11 |
| 1166869 | Water column chemistry | 2011-06-11 00:00:00 | 53.5175 N, 3.3618 W | RV Prince Madog PD43/11 |
| 1166697 | Hydrography time series at depth | 2011-07-25 19:00:00 | 53.5339 N, 3.3648 W | RV Prince Madog PD21/11 |
| 1166728 | PAR radiance and irradiance | 2011-07-25 19:00:00 | 53.5339 N, 3.3648 W | RV Prince Madog PD21/11 |
| 1166741 | PAR radiance and irradiance | 2011-07-25 19:00:00 | 53.5339 N, 3.3648 W | RV Prince Madog PD21/11 |
| 1166753 | PAR radiance and irradiance | 2011-07-25 19:00:00 | 53.5339 N, 3.3648 W | RV Prince Madog PD21/11 |
| 1166704 | Transmittance/attenuance, turbidity, or SPM conc. | 2011-07-25 19:00:00 | 53.5339 N, 3.3648 W | RV Prince Madog PD21/11 |
| 1166716 | Water column chemistry | 2011-07-25 19:00:00 | 53.5339 N, 3.3648 W | RV Prince Madog PD21/11 |
| 1166894 | Water column chemistry | 2011-07-25 20:00:00 | 53.5339 N, 3.3648 W | RV Prince Madog PD21/11 |
| 1166882 | Transmittance/attenuance, turbidity, or SPM conc. | 2011-08-03 00:00:00 | 53.5339 N, 3.3648 W | RV Prince Madog PD21/11 |
| 1118333 | CTD or STD cast | 2011-09-19 09:06:00 | 53.53117 N, 3.363 W | RV Prince Madog PD25/11 |
| 1352981 | Water sample data | 2011-09-19 09:09:00 | 53.53113 N, 3.36305 W | RV Prince Madog PD25/11 |
| 1118345 | CTD or STD cast | 2011-09-19 11:36:00 | 53.537 N, 3.368 W | RV Prince Madog PD25/11 |
| 1118357 | CTD or STD cast | 2011-09-19 12:48:00 | 53.5315 N, 3.35117 W | RV Prince Madog PD25/11 |
| 1352993 | Water sample data | 2011-09-19 12:50:00 | 53.53158 N, 3.35122 W | RV Prince Madog PD25/11 |
| 1118437 | CTD or STD cast | 2011-09-20 07:48:00 | 53.53433 N, 3.36117 W | RV Prince Madog PD25/11 |
| 1353032 | Water sample data | 2011-09-20 07:52:00 | 53.5343 N, 3.36113 W | RV Prince Madog PD25/11 |
| 1166765 | Hydrography time series at depth | 2012-01-11 10:30:00 | 53.5316 N, 3.3612 W | RV Corystes CO 01/12 |
| 1166789 | PAR radiance and irradiance | 2012-01-11 10:30:00 | 53.5316 N, 3.3612 W | RV Corystes CO 01/12 |
| 1166790 | PAR radiance and irradiance | 2012-01-11 10:30:00 | 53.5316 N, 3.3612 W | RV Corystes CO 01/12 |
| 1166808 | PAR radiance and irradiance | 2012-01-11 10:30:00 | 53.5316 N, 3.3612 W | RV Corystes CO 01/12 |
| 1166777 | Water column chemistry | 2012-01-11 10:30:00 | 53.5316 N, 3.3612 W | RV Corystes CO 01/12 |
| 1623710 | Currents -subsurface Eulerian | 2002-08-07 12:55:00 | 53.53283 N, 3.36733 W | RV Prince Madog PD20/02 |
| 1623802 | Currents -subsurface Eulerian | 2002-09-25 19:15:00 | 53.53317 N, 3.36317 W | RV Prince Madog PD24/02 |
| 1623875 | Currents -subsurface Eulerian | 2002-11-13 14:15:00 | 53.53283 N, 3.36267 W | RV Prince Madog PD31/02 |
| 1623678 | Currents -subsurface Eulerian | 2002-12-12 15:45:00 | 53.534 N, 3.3625 W | RV Prince Madog PD35/02 |
| 1623598 | Currents -subsurface Eulerian | 2003-01-23 16:35:00 | 53.53283 N, 3.36033 W | RV Prince Madog PD02/03 |
| 1623783 | Currents -subsurface Eulerian | 2003-03-06 14:45:00 | 53.53317 N, 3.364 W | RV Prince Madog PD10/03 |
| 1623795 | Currents -subsurface Eulerian | 2003-04-16 13:45:00 | 53.53667 N, 3.37133 W | RV Prince Madog PD17/03 |
| 1623918 | Currents -subsurface Eulerian | 2005-03-03 07:55:00 | 53.53033 N, 3.36533 W | RV Prince Madog PD02/05 |
| 1623212 | Currents -subsurface Eulerian | 2006-05-09 14:30:00 | 53.53283 N, 3.36017 W | RV Prince Madog PD16/06 |
| 1623273 | Currents -subsurface Eulerian | 2006-06-28 10:06:52 | 53.53283 N, 3.361 W | RV Prince Madog PD20/06 |
| 1623304 | Currents -subsurface Eulerian | 2006-07-27 10:24:26 | 53.53283 N, 3.357 W | RV Prince Madog PD22/06 |
| 1623328 | Currents -subsurface Eulerian | 2006-08-15 18:50:00 | 53.53383 N, 3.35883 W | RV Prince Madog PD25/06 |
| 1623365 | Currents -subsurface Eulerian | 2006-09-21 12:00:00 | 53.53383 N, 3.35867 W | RV Prince Madog PD29/06 |
| 1623390 | Currents -subsurface Eulerian | 2006-11-01 14:40:00 | 53.534 N, 3.35783 W | RV Prince Madog PD35/06 |
| 1623408 | Currents -subsurface Eulerian | 2006-12-15 09:10:00 | 53.534 N, 3.35783 W | RV Prince Madog PD37/06 |
| 1623107 | Currents -subsurface Eulerian | 2007-04-16 14:40:00 | 53.5345 N, 3.35967 W | RV Prince Madog PD06/07 |
| 1623120 | Currents -subsurface Eulerian | 2007-05-15 11:40:00 | 53.53417 N, 3.359 W | RV Prince Madog PD09/07 |
| 1623193 | Currents -subsurface Eulerian | 2007-06-20 10:50:00 | 53.53433 N, 3.35467 W | RV Prince Madog PD13/07 |
| 1623236 | Currents -subsurface Eulerian | 2007-07-26 12:00:00 | 53.53517 N, 3.35683 W | RV Prince Madog PD16/07 |
| 1623285 | Currents -subsurface Eulerian | 2007-08-29 13:20:00 | 53.535 N, 3.35733 W | RV Prince Madog PD20/07 |
| 1623353 | Currents -subsurface Eulerian | 2007-11-21 13:20:00 | 53.535 N, 3.35667 W | RV Prince Madog PD27/07 |
| 1623156 | Currents -subsurface Eulerian | 2008-04-16 13:30:05 | 53.53367 N, 3.35683 W | RV Prince Madog PD09/08 |
| 1623605 | Currents -subsurface Eulerian | 2008-07-31 06:05:00 | 53.535 N, 3.35933 W | RV Prince Madog PD23/08 |
| 1623629 | Currents -subsurface Eulerian | 2008-09-10 11:35:00 | 53.53517 N, 3.35933 W | RV Prince Madog PD29/08 |
| 1623887 | Currents -subsurface Eulerian | 2008-10-22 16:35:00 | 53.5345 N, 3.35583 W | RV Prince Madog PD33/08 |
| 1623709 | Currents -subsurface Eulerian | 2008-12-10 16:25:00 | 53.5335 N, 3.3575 W | RV Prince Madog PD37/08 |
| 1623814 | Currents -subsurface Eulerian | 2009-02-05 09:55:02 | 53.53333 N, 3.35783 W | RV Prince Madog PD02/09B |
| 1640749 | Hydrography time series at depth | 2009-04-01 08:20:03 | 53.533 N, 3.35783 W | RV Prince Madog PD12/09 |
| 1623734 | Currents -subsurface Eulerian | 2009-04-01 08:25:00 | 53.533 N, 3.35783 W | RV Prince Madog PD12/09 |
| 1640750 | Hydrography time series at depth | 2009-04-01 08:40:00 | 53.53283 N, 3.36483 W | RV Prince Madog PD12/09 |
| 1640762 | Hydrography time series at depth | 2009-04-01 08:40:00 | 53.53283 N, 3.36483 W | RV Prince Madog PD12/09 |
| 1640701 | Hydrography time series at depth | 2009-04-01 08:40:01 | 53.53283 N, 3.36483 W | RV Prince Madog PD12/09 |
| 1640713 | Hydrography time series at depth | 2009-04-01 08:40:01 | 53.53283 N, 3.36483 W | RV Prince Madog PD12/09 |
| 1640842 | Hydrography time series at depth | 2009-05-12 07:20:03 | 53.5335 N, 3.3575 W | RV Prince Madog PD18/09 |
| 1623943 | Currents -subsurface Eulerian | 2009-05-12 07:25:00 | 53.5335 N, 3.3575 W | RV Prince Madog PD18/09 |
| 1640798 | Hydrography time series at depth | 2009-05-12 08:20:00 | 53.53317 N, 3.3605 W | RV Prince Madog PD18/09 |
| 1640817 | Hydrography time series at depth | 2009-05-12 08:20:00 | 53.53317 N, 3.3605 W | RV Prince Madog PD18/09 |
| 1640854 | Hydrography time series at depth | 2009-05-12 08:20:00 | 53.53317 N, 3.3605 W | RV Prince Madog PD18/09 |
| 1640866 | Hydrography time series at depth | 2009-05-12 08:20:00 | 53.53317 N, 3.3605 W | RV Prince Madog PD18/09 |
| 1640910 | Hydrography time series at depth | 2009-06-17 08:00:03 | 53.53367 N, 3.357 W | RV Prince Madog PD24/09 |
| 1623630 | Currents -subsurface Eulerian | 2009-06-17 08:05:00 | 53.53367 N, 3.357 W | RV Prince Madog PD24/09 |
| 1640934 | Hydrography time series at depth | 2009-06-17 08:30:00 | 53.534 N, 3.3595 W | RV Prince Madog PD24/09 |
| 1640946 | Hydrography time series at depth | 2009-06-17 08:30:00 | 53.534 N, 3.3595 W | RV Prince Madog PD24/09 |
| 1640891 | Hydrography time series at depth | 2009-06-17 08:30:01 | 53.534 N, 3.3595 W | RV Prince Madog PD24/09 |
| 1640909 | Hydrography time series at depth | 2009-06-19 12:00:01 | 53.534 N, 3.3595 W | RV Prince Madog PD24/09 |
| 1624006 | Currents -subsurface Eulerian | 2009-08-03 06:35:01 | 53.53367 N, 3.35667 W | RV Prince Madog PD33/09 |
| 1641009 | Hydrography time series at depth | 2009-08-03 07:00:03 | 53.53367 N, 3.35667 W | RV Prince Madog PD33/09 |
| 1641022 | Hydrography time series at depth | 2009-08-03 07:30:00 | 53.534 N, 3.36367 W | RV Prince Madog PD33/09 |
| 1641034 | Hydrography time series at depth | 2009-08-03 07:30:00 | 53.534 N, 3.36367 W | RV Prince Madog PD33/09 |
| 1640958 | Hydrography time series at depth | 2009-08-03 07:30:01 | 53.534 N, 3.36367 W | RV Prince Madog PD33/09 |
| 1640995 | Hydrography time series at depth | 2009-08-03 07:30:01 | 53.534 N, 3.36367 W | RV Prince Madog PD33/09 |
| 1641114 | Hydrography time series at depth | 2009-09-15 08:50:03 | 53.53333 N, 3.3575 W | RV Prince Madog PD38/09 |
| 1623838 | Currents -subsurface Eulerian | 2009-09-15 08:55:00 | 53.53333 N, 3.3575 W | RV Prince Madog PD38/09 |
| 1641138 | Hydrography time series at depth | 2009-09-15 09:10:00 | 53.53367 N, 3.35967 W | RV Prince Madog PD38/09 |
| 1641151 | Hydrography time series at depth | 2009-09-15 09:10:00 | 53.53367 N, 3.35967 W | RV Prince Madog PD38/09 |
| 1641071 | Hydrography time series at depth | 2009-09-15 09:10:01 | 53.53367 N, 3.35967 W | RV Prince Madog PD38/09 |
| 1641095 | Hydrography time series at depth | 2009-09-15 09:10:01 | 53.53367 N, 3.35967 W | RV Prince Madog PD38/09 |
| 1641231 | Hydrography time series at depth | 2009-12-02 12:50:03 | 53.533 N, 3.358 W | RV Prince Madog PD47/09 |
| 1623899 | Currents -subsurface Eulerian | 2009-12-02 12:55:00 | 53.533 N, 3.358 W | RV Prince Madog PD47/09 |
| 1641255 | Hydrography time series at depth | 2009-12-02 13:10:00 | 53.53417 N, 3.36383 W | RV Prince Madog PD47/09 |
| 1641267 | Hydrography time series at depth | 2009-12-02 13:10:00 | 53.53417 N, 3.36383 W | RV Prince Madog PD47/09 |
| 1641187 | Hydrography time series at depth | 2009-12-02 13:10:01 | 53.53417 N, 3.36383 W | RV Prince Madog PD47/09 |
| 1641206 | Hydrography time series at depth | 2009-12-02 13:10:01 | 53.53417 N, 3.36383 W | RV Prince Madog PD47/09 |
| 1641359 | Hydrography time series at depth | 2010-01-26 09:40:03 | 53.53267 N, 3.358 W | RV Prince Madog PD02/10 |
| 1624147 | Currents -subsurface Eulerian | 2010-01-26 09:45:11 | 53.53267 N, 3.358 W | RV Prince Madog PD02/10 |
| 1641360 | Hydrography time series at depth | 2010-01-26 10:00:00 | 53.53317 N, 3.362 W | RV Prince Madog PD02/10 |
| 1641372 | Hydrography time series at depth | 2010-01-26 10:00:00 | 53.53317 N, 3.362 W | RV Prince Madog PD02/10 |
| 1641292 | Hydrography time series at depth | 2010-01-26 10:00:01 | 53.53317 N, 3.362 W | RV Prince Madog PD02/10 |
| 1641311 | Hydrography time series at depth | 2010-01-26 10:00:01 | 53.53317 N, 3.362 W | RV Prince Madog PD02/10 |
| 2294175 | Water sample data | 2010-03-17 12:38:30 | 53.5317 N, 3.3496 W | RV Prince Madog PD05/10 |
| 1641452 | Hydrography time series at depth | 2010-03-17 13:20:03 | 53.53267 N, 3.35833 W | RV Prince Madog PD05/10 |
| 1624092 | Currents -subsurface Eulerian | 2010-03-17 13:25:00 | 53.53267 N, 3.35833 W | RV Prince Madog PD05/10 |
| 1641464 | Hydrography time series at depth | 2010-03-17 13:30:00 | 53.53233 N, 3.36383 W | RV Prince Madog PD05/10 |
| 1641476 | Hydrography time series at depth | 2010-03-17 13:30:00 | 53.53233 N, 3.36383 W | RV Prince Madog PD05/10 |
| 1641403 | Hydrography time series at depth | 2010-03-17 13:30:01 | 53.53233 N, 3.36383 W | RV Prince Madog PD05/10 |
| 1641427 | Hydrography time series at depth | 2010-03-17 13:30:01 | 53.53233 N, 3.36383 W | RV Prince Madog PD05/10 |
| 2294187 | Water sample data | 2010-03-17 13:55:30 | 53.53461 N, 3.36924 W | RV Prince Madog PD05/10 |
| 1641568 | Hydrography time series at depth | 2010-04-28 11:40:03 | 53.53283 N, 3.35817 W | RV Prince Madog PD10/10 |
| 1624018 | Currents -subsurface Eulerian | 2010-04-28 11:45:00 | 53.53283 N, 3.35817 W | RV Prince Madog PD10/10 |
| 1641581 | Hydrography time series at depth | 2010-04-28 12:30:00 | 53.533 N, 3.36317 W | RV Prince Madog PD10/10 |
| 1641593 | Hydrography time series at depth | 2010-04-28 12:30:00 | 53.533 N, 3.36317 W | RV Prince Madog PD10/10 |
| 1641520 | Hydrography time series at depth | 2010-04-28 12:30:01 | 53.533 N, 3.36317 W | RV Prince Madog PD10/10 |
| 1641544 | Hydrography time series at depth | 2010-04-28 12:30:01 | 53.533 N, 3.36317 W | RV Prince Madog PD10/10 |
| 2213813 | Water sample data | 2010-04-28 12:36:00 | 53.5343 N, 3.3912 W | RV Prince Madog PD10/10 |
| 1624067 | Currents -subsurface Eulerian | 2010-06-09 10:25:09 | 53.53317 N, 3.35867 W | RV Prince Madog PD17/10 |
| 1641624 | Hydrography time series at depth | 2010-06-09 10:30:01 | 53.53433 N, 3.36367 W | RV Prince Madog PD17/10 |
| 1641636 | Hydrography time series at depth | 2010-06-09 10:30:01 | 53.53433 N, 3.36367 W | RV Prince Madog PD17/10 |
| 1641673 | Hydrography time series at depth | 2010-06-09 10:30:03 | 53.53317 N, 3.35867 W | RV Prince Madog PD17/10 |
| 1641697 | Hydrography time series at depth | 2010-06-09 10:40:00 | 53.53433 N, 3.36367 W | RV Prince Madog PD17/10 |
| 1641704 | Hydrography time series at depth | 2010-06-09 10:40:00 | 53.53433 N, 3.36367 W | RV Prince Madog PD17/10 |
| 1641789 | Hydrography time series at depth | 2010-07-07 09:10:03 | 53.533 N, 3.35917 W | RV Prince Madog PD21/10 |
| 1624055 | Currents -subsurface Eulerian | 2010-07-07 09:14:59 | 53.533 N, 3.35917 W | RV Prince Madog PD21/10 |
| 1641808 | Hydrography time series at depth | 2010-07-07 09:50:00 | 53.53517 N, 3.3615 W | RV Prince Madog PD21/10 |
| 1641821 | Hydrography time series at depth | 2010-07-07 09:50:00 | 53.53517 N, 3.3615 W | RV Prince Madog PD21/10 |
| 1641753 | Hydrography time series at depth | 2010-07-07 09:50:01 | 53.53517 N, 3.3615 W | RV Prince Madog PD21/10 |
| 1641765 | Hydrography time series at depth | 2010-07-07 09:50:01 | 53.53517 N, 3.3615 W | RV Prince Madog PD21/10 |
| 1641882 | Hydrography time series at depth | 2010-08-11 07:20:03 | 53.5335 N, 3.358 W | RV Prince Madog PD29/10 |
| 1623979 | Currents -subsurface Eulerian | 2010-08-11 07:25:00 | 53.5335 N, 3.358 W | RV Prince Madog PD29/10 |
| 1641894 | Hydrography time series at depth | 2010-08-11 08:00:00 | 53.53317 N, 3.36133 W | RV Prince Madog PD29/10 |
| 1641901 | Hydrography time series at depth | 2010-08-11 08:00:00 | 53.53317 N, 3.36133 W | RV Prince Madog PD29/10 |
| 1641857 | Hydrography time series at depth | 2010-08-11 08:00:01 | 53.53317 N, 3.36133 W | RV Prince Madog PD29/10 |
| 1641869 | Hydrography time series at depth | 2010-08-11 08:00:01 | 53.53317 N, 3.36133 W | RV Prince Madog PD29/10 |
| 1641950 | Hydrography time series at depth | 2010-09-28 07:30:03 | 53.53367 N, 3.35817 W | RV Prince Madog PD36/10 |
| 1623863 | Currents -subsurface Eulerian | 2010-09-28 07:35:00 | 53.53367 N, 3.35817 W | RV Prince Madog PD36/10 |
| 1641974 | Hydrography time series at depth | 2010-09-28 08:50:00 | 53.5335 N, 3.36367 W | RV Prince Madog PD36/10 |
| 1641986 | Hydrography time series at depth | 2010-09-28 08:50:00 | 53.5335 N, 3.36367 W | RV Prince Madog PD36/10 |
| 1641925 | Hydrography time series at depth | 2010-09-28 08:50:01 | 53.5335 N, 3.36367 W | RV Prince Madog PD36/10 |
| 1641949 | Hydrography time series at depth | 2010-09-28 08:50:01 | 53.5335 N, 3.36367 W | RV Prince Madog PD36/10 |
| 1642050 | Hydrography time series at depth | 2010-12-07 12:30:03 | 53.53417 N, 3.35833 W | RV Prince Madog PD49/10 |
| 1623654 | Currents -subsurface Eulerian | 2010-12-07 12:35:00 | 53.53417 N, 3.35833 W | RV Prince Madog PD49/10 |
| 1642074 | Hydrography time series at depth | 2010-12-07 13:10:00 | 53.53067 N, 3.36167 W | RV Prince Madog PD49/10 |
| 1642086 | Hydrography time series at depth | 2010-12-07 13:10:00 | 53.53067 N, 3.36167 W | RV Prince Madog PD49/10 |
| 1642037 | Hydrography time series at depth | 2010-12-07 13:10:01 | 53.53067 N, 3.36167 W | RV Prince Madog PD49/10 |
| 1642049 | Hydrography time series at depth | 2010-12-07 13:10:01 | 53.53067 N, 3.36167 W | RV Prince Madog PD49/10 |
| 2213837 | Water sample data | 2010-12-07 13:20:00 | 53.5319 N, 3.3643 W | RV Prince Madog PD49/10 |
| 1642166 | Hydrography time series at depth | 2011-01-12 09:10:03 | 53.53433 N, 3.35733 W | RV Prince Madog PD01/11 |
| 1623758 | Currents -subsurface Eulerian | 2011-01-12 09:15:00 | 53.53433 N, 3.35733 W | RV Prince Madog PD01/11 |
| 1642191 | Hydrography time series at depth | 2011-01-12 09:30:00 | 53.53467 N, 3.361 W | RV Prince Madog PD01/11 |
| 1642154 | Hydrography time series at depth | 2011-01-12 09:30:01 | 53.53467 N, 3.361 W | RV Prince Madog PD01/11 |
| 1642129 | Hydrography time series at depth | 2011-01-12 09:30:02 | 53.53467 N, 3.361 W | RV Prince Madog PD01/11 |
| 1642302 | Hydrography time series at depth | 2011-03-16 11:20:00 | 53.53333 N, 3.36233 W | RV Prince Madog PD07/11 |
| 1642314 | Hydrography time series at depth | 2011-03-16 11:20:00 | 53.53333 N, 3.36233 W | RV Prince Madog PD07/11 |
| 1642234 | Hydrography time series at depth | 2011-03-16 11:20:01 | 53.53333 N, 3.36233 W | RV Prince Madog PD07/11 |
| 1642258 | Hydrography time series at depth | 2011-03-16 11:20:01 | 53.53333 N, 3.36233 W | RV Prince Madog PD07/11 |
| 1642283 | Hydrography time series at depth | 2011-03-16 11:20:03 | 53.53367 N, 3.35733 W | RV Prince Madog PD07/11 |
| 1624123 | Currents -subsurface Eulerian | 2011-03-16 12:59:50 | 53.53367 N, 3.35733 W | RV Prince Madog PD07/11 |
| 1623980 | Currents -subsurface Eulerian | 2011-04-18 11:05:00 | 53.53367 N, 3.3575 W | RV Prince Madog PD11/11 |
| 1623722 | Currents -subsurface Eulerian | 2011-06-06 09:15:00 | 53.534 N, 3.35733 W | RV Prince Madog PD43/11 |
| 1623931 | Currents -subsurface Eulerian | 2011-07-25 18:35:00 | 53.53383 N, 3.35283 W | RV Prince Madog PD21/11 |
